11/9/22 LTHMLivent Corporation ( NYSE:LTHM )
Sector: Process Industries (Chemicals: Specialty)
Market Capitalization: $5.778B
Current Price: $30.49
Breakout price: $32.90
Buy Zone (Top/Bottom Range): $30.10-$26.70
Price Target: $44.80-$46.20
Estimated Duration to Target: 117-125d
Contract of Interest: $LTHM 4/21/23 35c
Trade price as of publish date: $4.00/contract
Lithium

looking sketchy$tsla, (and the battery cars sector), about to go terminal.
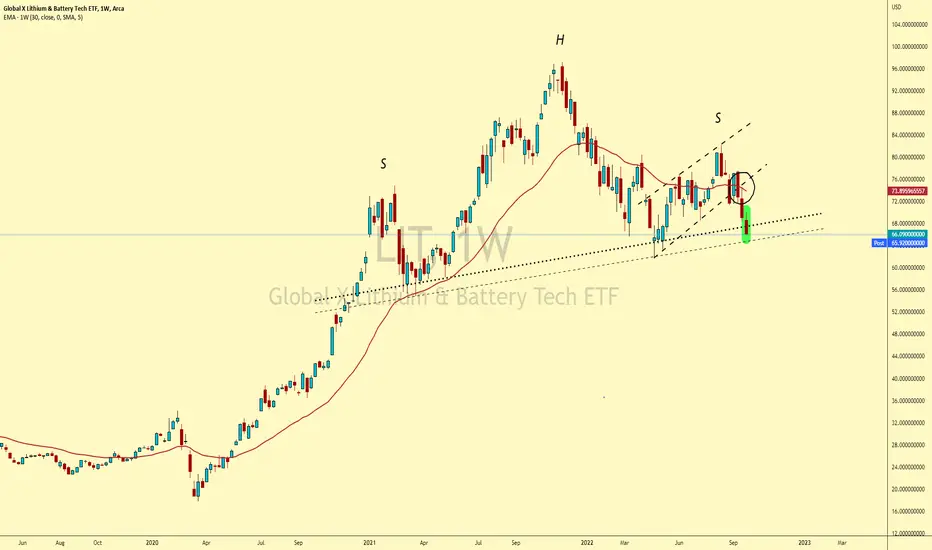
Have a close eye on lithium stocks here. $lit showing a bit more life, but is obviously correlated to Tesla, bigtime. This week, was rejected by weekly 30EMA, indicating a new leg of downside is probable.

about to dump$tsla, (and the battery cars sector), about to go terminal.
Have a close eye on lithium stocks here. $lit showing a bit more life, but is obviously correlated to Tesla, bigtime. This week, was rejected by weekly 30EMA, indicating a new leg of downside is probable.

ATLX PARABOLIC GROWTH CURVE IN PLAY TARGET $36 ATLX formerly known as BMIX is in this parabolic growth curve. Volume has been increasing steadily over the past year or so, lots of buying happening from what I see. I think this stock has a lot of potential. This is a great cheap entry point in my opinion. Also ATLX has acquired some land right next to Sigma Lithium Corp. which stock is valued at almost $40. This is not trading or financial advice this is just my opinion. Thank you and if you appreciate this content please give me a boost and follow for more updates.

Lithium FocusLithium Focus: Main companies in the sector. Strong Lithium prices are giving current producers massive cashflows & strong incentives to all to introduce extra production asap

#NNOMF_NANO $NANO will the share price go up?#NanoOneMaterials has signed some great deals this year:
#RioTinto
#EuroManganese
#JohnsonMatthey
I'm curious if the share price will take some positive action in this years last quater?
After touching a 2 years low in May it did a good run till August. Since than the share price was cooling down and tries the next run to the resistance at about CAD 3,3x
If the price can sustainably brake through that resistance again, it could become a nice run. Specially if more positive news will arrive! But first it has to defeat the support at about CAD 2,57
No financial advice - just my opinion.


short set upthe lithium ETF vs Palladium/platinum ETF.
down is bearish for lithium things and bullish for palladium things.

head and shoulders about to go terminalthe charts are saying something about #lithium and the #battery cars that you won't see on the twitter.
ASX:CXO Bull FlagWeekly Bull Flag breakout
Measured move lines up with the 100 fib ext + psychological level of $2

Gold breaks out of the downtrend?!As discussed in this video, gold breaks out of the downtrend as indicated by the RSI which can be a reliable leading indicator when it comes to increasing your odds of foreseeing a change in trend.

LIT - Lithium ETF setting up: 5 month basing patternBasing for 5 months. Confirmed breakout, pullback and reversing back up.
You don't need to know what's going to happen next to make money ~Mark Douglas
Lose like a pro and keep trading, or lose like a novice and quit ~Mark Ritchie

$GAL $GAL.AXThis is how i would play GAL.
So much to explain could do with a video. But anyway il try explain.
Identified three ranges. R1 R2 and R3.. H=High, L=Low and Mid = Mid range.
Price rejected R2 High and is currently consolidating between R2 H and R2 Low...
Plan A looking for entry on retest of R3 H or deep to R3 Low. This level has not been retested yet. Will look for entry on 15 or 5 minute tf using the EMA cross and some sort of falling resistance break.
T1 = 1.255
T2 = 1.330
If it trades below the MID range and holds im not interested and will have to re-evaluate.

$LRS Latin ResourcesLRS is currently using the range high of that consolidation block weekly range marked on the chart. this range is important as this range was the last range before the market had a huge bull run march.
I have targets market on the chart, I will Cut if we get back and close below that weekly important range.
lets see.

TMC the metals company Options Ahead Of EarningsLooking at the TMC the metals company options chain, i would buy the $1.0 strike price Calls with
2023-02-17 expiration date for about
$0.40 premium.
Looking forward to read your opinion about it.

$MAYwatching for a push above the breakout line for entry signal,
Green box is the target if we get entry signal.
currently backtesting the low for that "daily range" that sent the market lower into the 1 month consolidation.
A push above the ema's and into 95-96 price range will be but signal.. lets see.
FYI a lot of news coming from the US this month so got to be cautious.

ASX:INR TO REGAIN LT UPTREND?Watching INR closely after recent bullish fundamental news regarding Ford Binding Offtake Agreement.
I have charted key levels of support and resistance as well as added in long-term and short-term trends.
Direction 1: Recently validating short-term uptrend and testing current daily resistance zone IF momentum continues it could regain long-term uptrend and eventually breach current daily resistance.
Direction 2: Short-term uptrend eventually breaks due to lack of bullish momentum and a selloff but manages to maintain support, eventually regaining long-term uptrend for a slower and more stable rally as it targets upper band downtrend resistance and ath resistance.
Direction 3: Short-term uptrend fails and price fails to regain long-term uptrend due to selloff, price manages to hold and validate daily support and moves sideways developing a short-term range.
Direction 4: Short-term trend fails and daily support fails, selloff increases and price moves back to the former low territory to find and validate a level of support.
Indicator RSI: Currently trending above the 50 midway mark and in Bullish territory. I will be watching closely to see which way momentum swings and see if it fails the current uptrend.
"DISCLAIMER: NO ADVICE. The information presented here is general in nature and is for education purposes only. Nothing should be considered to be advice. You should consult with an appropriate professional for specific advice tailored to your situation."

$LLLJuly 5th "Sale of 28.6m Leo Lithium Shares-Cash Injection $12.9m"
Recent news catalyst.
-Looking for deviation of the low range and backtest.
-Trigger is on the backtest.
-Target is market on chart.
Confluence
-Above 20 day EMA
-Breakout of falling resistance.
focus on one thing. execute and be patient.
Doesn't work. move on to the next plan.

SYA Sayona MiningSYA deviate mid range with ST target March low.
Pops and holds March low looking for March High as T1 and 2021 High as T2..
Reevaluate as the weeks play out.

$LRS" New Pegmatite Zone at depth at Colina Lithium Prospect
Mon, 27 Jun 2022 08:41"
-News catalyst
-Back above Low Range.
-Backtesting low range
-Above the 20 day EMA all intraday TF's
Targets Mid Range.
patience is key to see this work out.. markets are extremely volatile ATM with FED meeting in july is also to be wary of.

$AGY- Breaking out - Closed above 200 MA$AGY closed above 200MA and is above and 20 EMA . Possibility of going higher due to all ordinaries going higher than 7000 points on the 21/07/22 in my opinion.

$CRR $CRR.ax-Bullish descending Broadening wedge
-Fakeout complete
-real breakout underway.
-targets market on chart.
Drilling started. plenty of news catalysts on the horizon.
