WMT Long Term GrowthWMT has proven logarithmic action and recently touched the support side of the logarithmic channel. Looking for an exponential move upwards over the next 1-2 years with the revenue growth from the newly adopted health care/clinics. Price target of 165.00 by JAN2021. Hold long and prosper.
Logarithmicchannel

Close Up Of Previous Idea and LevelsCOST Ideas are attached, had opportunities to get in and ride this ride on up while everyone else thought it had ran too far too fast. Now sitting at an inner resistance area of its lifetime channel. Break above and hold here then opens up 370's-380's next, knocking on the door of 400. Make sure you look at this chart through the correct lens, and don't just take anyone's word for it that its "overbought" or "exhausted" or "parabolic" and has to come down. It isn't and it doesn't. Congrats if you've been in here a while, or if you bought just a few weeks ago. For now just watch price action around this trend line, and trade accordingly. Happy hunting and GLTA!!

How High Is High Enough??SHOP Has just been on a tear, my goodness. I had this move marked out when it was flagging, had my buy marked at 125. Got distracted elsewhere, missed the buy, and now have just been absolutely kicking myself over this. What a run. My best estimate for a target sits around 428. May buy a put option at that point if it does in fact reach it, but I obviously don't wanna be short for very long in this name. If you have been in, congrats on the move. May wanna consider realizing some gains in the next 20 bucks or so of price action. Happy hunting and GLTA!!

Well, Whatdya Know??MDB Linked Ideas. Just strength and growth, plain and simple. Like I said, 200 or bust. Happy hunting and GLTA!!

Like I Said, Think Again...As mentioned in previous idea about COST (linked) if you think this has run too far too fast, think again. As mentioned then, the critical level is this inner resistance near 300, which if broken can open the floodgates for COST. If it closes 305 convincingly, this thing can feasibly hit 400 without much trouble. Just because a chart looks straight up in "Auto" charting mode doesn't mean it's overextended. Take another look from the right perspective and things become much clearer. Congrats if you bought then. Happy hunting and GLTA!!

I'd Wait Another 100 Bucks before Buying $NFLX NetflixNFLX Just an observation on the lifetime channel of NFLX Netflix. It seems to me that any increased selling pressure should easily bring this down to the 200 range by the end of September without breaking much of a sweat. I'm looking for the RSI support break myself. Note the Klinger Oscillator has crosed over bearish, turned below zero and began to spread. Not a good sign for now. Whatever your beliefs in this stock fundamentally may be, I won't argue. But technically, I would not go long this stock until it either touches its midpoint line around the 200 area or it broke above its ATH. I don't care how much gain I would miss in between, because my piece of mind being able to sleep knowing I'm not worrying to death over my NFLX investment is worth way more. Much much better opportunities in the market at this time than this stock. Just one man's opinion. Happy hunting and GLTA!!

Splunk Could Have A Ton of Downside Left...SPLK Shown is the lifetime channel of SPLK Splunk. As shown in the chart, it has been bouncing around near the channesl resistance for some time, and without in any way breaking its pattern could see the Mid 60's-70's. This represents a 40% drop. However, a catch on the uptrend support line and ride back up to the channel resistance represents about a 35% gain. Therefore, from this current position, it is still a watch and wait. If it loses support, I will short on the retest. If it catches convincingly on support, I will go long. I don't like getting in when its in that in-between stage. If you were short today, congrats on the gains. If you are looking to get in, might wanna look elsewhere until we reach key levels. Happy hunting and GLTA!!

$MDB Bet Paying OffMDB As shown in linked idea on MongoDB, it was sitting at a minimum 6:1 risk/reward ratio at open Monday. If you took that trade there, which I did at open, you're currently up around 6% after one day. Has broken out of inner resistance, now headed toward outer resistance at 153 area. If it is able to convincingly break that trendline, it is very possible for this thing to have an extended run as it has every other time it bouyed around the 125 MA. If so, the logarithmic channel top would end up being over 250 per share. I'm an owner of this strong growth stock. Happy hunting and GLTA!!

Remember when I said don't bet against this one??AYX Pure strength. As you can see from the chart, AYX is in the process of breaking out of its lifetime channel resistance. If this is able to hold the breakout this week, the sky is the limit for this thing. No overhead resistance, so only psychological resistances to worry about technically. Usually those come in numbers divisible by 5, so likely looking at 150 first resistance, then 155, and so on. Just a super strong growth stock. Short at your own peril. Happy hunting and GLTA!!

200 or Bust...NASDAQ:MDB Each time MDB gets the chance to reset to its 125 MA in the past, it has had a very nice rebound followed by an extended run. I don't believe this time to be any different. If this things can make it to 160, then it's 200 or bust. Buy and hold. Take profits near channel tops. Happy hunting and GLTA!!

Don't bet against this one...NYSE:AYX You wanns see a beautiful logarithmic channel, then look no further. If you make the mistake of charting this bad boy in "auto" mode, you could easily make the argument it has run too far too fast. but if you look at this thing the right way, it sure does look like a tough short to me. Even when it tops out at channel resistance it doesn't tend to fall back down to a midpoint or anything, it just kinda grinds on up. if you do want to short here, best wait until it drops below that midline. Even then it's a dangerous proposition. My advice? Look for basically ANY pullback, especially if it brings it back down to the 100-110 range, and then just buy. Don't wanna be the person fighting this mammoth trend. See the pic below for what this same chart and lines look like in "auto" mode. Learn that log button boys and girls!! Happy hunting and GLTA!!

Decision point for $HSYNYSE:HSY HSY has reached the resistance trend line in its current channel. That doesn't mean it HAS to go down now, it could very well bust through, or chop around just below for a bit. The Stochastic indicator is pegged out at 100 on the monthly, but can easily ride there for months to come. The daily and weekly Stochastic still has room either way. If it gets rejected over the next two days, I will initiate a short position using put options. If it pops above the resistance, I will attempt to play a pullback to test that breakout, then enter long. If neither of these happen convincingly, and it chops around right here at this spot, I will sit on my hands until it chooses a direction. Just good to know when a stock reaches a critical moment so that you can put alerts on the trend line and make your bet. Happy hunting!!

Think $COST has run too far? Think again...NASDAQ:COST It really pays to understand the "log" button on your chart and when to use it. Because looking at COST monthly chart in this way shows a very clearly defined channel and midpoint line. So, instead of looking like an unchartable stock that looks as if it has to be out of gas, it becomes much clearer that in fact, it could have much further to go. This is further evidenced by the Stochastic Indicator, which is nowhere near a point of exhaustion. So COST will likely rise up to the 297-300 mark which is resistance in this smaller, inner channel currently being ridden. Then comes the decision point, and if COST is able to break past 300 convincingly, it is very possible--even likely--that it could be sitting 370-380 by the end of 2019 without too much fuss. Beautiful, strong chart here. Below is an example of what this exact same chart and trend lines look like if you keep the monthly chart in linear mode. Good luck charting that thing. Happy hunting, hope we all make it out alive!!

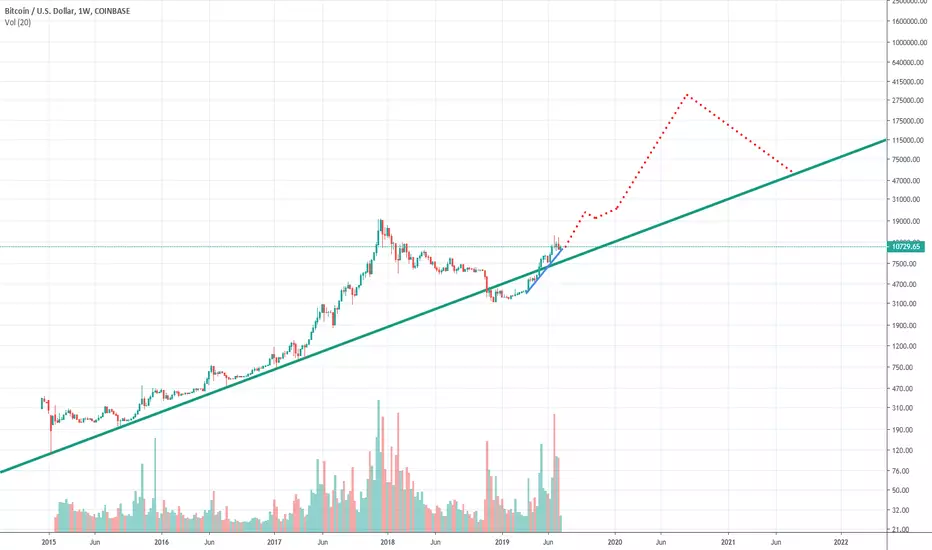
Taking a closer look on this long term possible bullish outlookA few days back i've posted a possible mid-term bearish scenario that left many traders doubtful and i understand their point. This time with more in debt analysis i present you my more bullish scenario for the future of blockchain technology. This is only part 1. Enjoy ;)

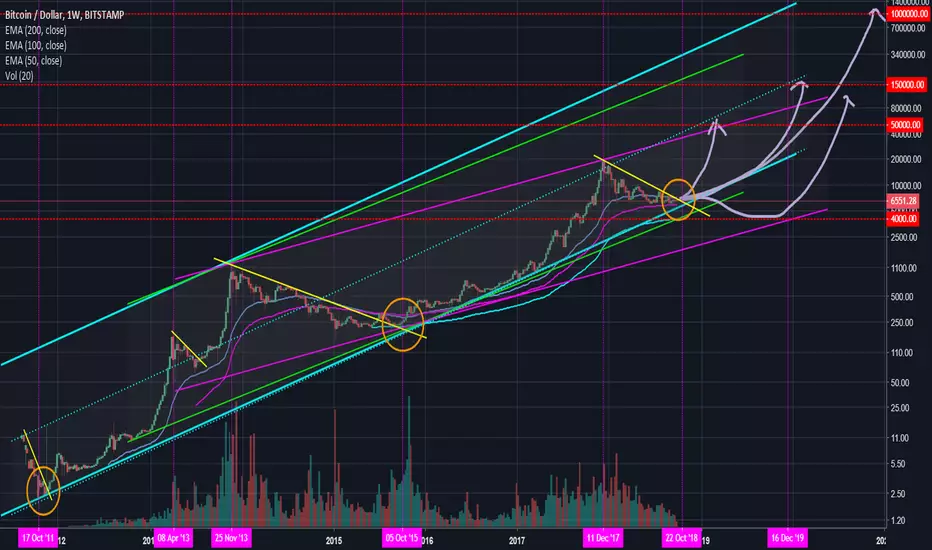
MIGHT JOHN MCAFEE BE RIGHT? The log scale proves it !The one scale pro's use for longterm predictions is still the log scale. It might sound crazy, but it could predict what is coming.
Truth is:
Bitcoin has traded in a logarithmic channel since the beginning, and it would near/touch the bottom of the largest, blue channel for a 3th time.
This is a big probability as it is seasonally around the same period of the year atm, which is 'October'.
In october 2011 we had a start of a bullmarket, a stop around the end of the year of 2013 = 2 years.
In october 2013 we had a midterm break and continuation of a bullrun again until end of 2013 as said previously.
In october 2015 we had a bottom and BTC marked a trendline very clearly and was in a bullmarket till end of 2017 = 2 years
Now we're october 2018, and there's a potential to break up and go to insane levels, if we get rejected from the bottom of the blue parallel again.
Levels of 50,000 and even levels of 1000,000 usd are in this case really possible, and John Mcafee might have a point.
If it would hit 1M, BTC will definitely be saturated as we would be entering a trillion dollar market, but... that would be just a glimpse of the total stock market ... so who knows?
On the regular scale it looks much out of proportion, but on the log scale it makes sense.
On the other hand, there could be a hold up for about a year, if bitcoin breaks down from the blue parallel (which never happened)
and swap to the pink parallel to go to levels of about 4000 usd, but I believe certainly not more than that, eventually it should go up around October 2019 then !
Let's hope we don't have to wait a year longer, but in this case the highest probability is that bitcoin will go up right around this time... or at least end of this year,
which it then would follow the green parallel.
All this means that a rise to 50 K is certainly possible !
We could have a bullrun until end of this year, or until mid next year, as 4 years ago, BTC went into a mid-phase until april 2013.
So, even if I personally cannot believe this myself, it is a very high probability !
So far the TA explained what John Mcafee, and... some hedge fund managers projected as well.
The run from OCT. 2011 until NOV. 2013 went from 2 usd to 1100 usd in 2 years ! That's 550 X,
with a break from APRIL 2013 til OCTOBER 2013 !
On the regular scale it would look like this in my older projection:
Bitcoin long term overview (logarithmic)Time to sobering for btc, in spite of all uneasiness, ordeals, even tears i like to hear the footsteps of beautiful things. Community psychology, bluntly below zero this is exactly perfect time to initiate bull market on the other hand ''Bakkt'' (ICE) news is solidly remarkable and most of news will follow this sentiment. Let's take a look at what is chart telling us. The first cross between ma's witnessed a growth of 7000% within just 2 years However, when second cross occured tremendously held at the btc 6000 level. From my point of view 6k levels were the dip of btc also this ''Tether'' fud brought us to 0.618 fib level. If/when we obtain some upward movement above 0.618 fib level most likely we should wait possible cross between ma's and possible bull market as well according to chart. Frankly, i always adopt win-win market and I want to be on the side every re-tail trader wins so all i need that keep our motivation high and prepare for next bull market technically and emotionally. Cheers

Manually made channelAs I couldn't match a pitchfork correctly for this log scale trend, so then decided to Make own channel manually out of an older trend. Placed the mane lines, measured them with fib channels to draw other continual channel lines which would mach the pattern so We could try to predict the next tops/bottoms of this awesome trend. What do you think of this channel? if you have any advises or ideas which you want to share, feel free to post in the comments

#BTCUSD Inverse Head and ShouldersSimplified BTC TA. We have a parallel channel and a downtrend line. We have been recovering from sub 6k ever since breaking below the channel. This was followed by many hard bounces and fomos. Eventually we made it to the top of the descending trend line and failed to break out. Price action has been decreasing ever since. I expect BTC drop down to the bottom the channel and bounce up to the resistance line and breaking out. This will form a large inverse head and shoulders. This Inverse H&S can take us to 17k where we might reject, if we do not reject, open target.

BTC USD .. Is it really that unpredictable peeps !!!haha ! seems like a no brainer to me !
Buy !!!!!! hahahaha
Seriously though, take a good look, it's going to 50k soon...
