17/11/25 Weekly OutlookLast weeks high: $107,526.18
Last weeks low: $93,034.53
Midpoint: $100,280.35
Bitcoins downtrend continues as price reaches a 6-month low of $93,000. This price action came as a result of a failed attempt to flip the $107,000-$108,000 level, as this area rejected the bears gained momentum sending BTC sub $100k big even level and the most worrying part of all for the bulls losing the $97,000-$98,000 level. On the Higher timeframes this new lower low sets up for a trend shift. Should any reaction from the bulls fail to flip the weekly high and rollover, I would then have confirmation of a bearish trend and trade accordingly.
Despite the US Government shut down coming to an end, it appears this has not been enough to get the market in a risk-on mood, at least not yet. This compounded with Nvidia earnings in midweek and the larger question mark about the AI industry as a whole has meant buyers are just not will to step in yet. My opinion is that IF Bitcoin trades into the $89,000-$92,000 area that is where support may be found, that's because we have an area of imbalance that broke the previous downtrend in April earlier this year during the tariff war.
This week I expect Wednesday 19th November to be a day of volatility, and some formation of a local bottom in Bitcoin, at least in the short term.
Good luck this week everybody!
Long!!!!

EURUSD Sellers In Panic! BUY!
My dear subscribers,
EURUSD looks like it will make a good move, and here are the details:
The market is trading on 1.1601 pivot level.
Bias - Bullish
My Stop Loss - 1.1593
Technical Indicators: Both Super Trend & Pivot HL indicate a highly probable Bullish continuation.
Target - 1.1617
About Used Indicators:
The average true range (ATR) plays an important role in 'Supertrend' as the indicator uses ATR to calculate its value. The ATR indicator signals the degree of price volatility.
Disclosure: I am part of Trade Nation's Influencer program and receive a monthly fee for using their TradingView charts in my analysis.
———————————
WISH YOU ALL LUCK

USD/JPY - Multi Timeframe Analysis🚀 USD/JPY Forecast: Breaking Out of the Wedge! 🚀
Hey traders! 👀 The USD/JPY is looking like it’s gearing up for a big move, so let’s dive into the charts and break it down.
🔍 4-Hour Chart (Top Left):
We’ve got an Ascending Wedge Formation on our hands! Price has been creeping up towards key resistance, but it’s been bouncing off this trendline like a pinball. Look at the Entry Zone right here — we could see a breakout soon, either to the upside or downside. Are we going to push higher, or is this the calm before the storm? ⚡
🎯 Target Levels:
Target 1: First stop if the breakout happens is just above 155.00.
Target 2 : After that, we’re eyeing 156.00, which could be a major resistance zone.
📅 Daily Chart (Middle):
On the daily, we’re still seeing that wedge formation play out. The pressure is building, and it's almost time for the price to make its move. Will the bulls keep charging, or will we see a shift in momentum? That strong support below might just give us a push if we drop back down.
📊 Weekly Chart (Bottom Right):
Looking at the long-term picture, USD/JPY is in an upward trend, breaking through key resistance levels over the last few months. We’ve already seen a Break of Structure (BOS) at 151.00, and now we’re breaking above 154.00! This could signal the continuation of the uptrend as we eye 156.00 next.
💥 Key Levels to Watch:
Resistance: 156.00 (Eyes on this level — it could be the next big hurdle!)
Support : 152.00 (Look for a possible retracement here if we see a pullback)
Next Target: If we break 156.00, we could see USD/JPY heading even higher towards 160.00 in the coming months!
🔥 What’s Next?
The squeeze is real! Will USD/JPY break higher, or are we about to see a sharp reversal? Either way, there’s plenty of action to look forward to in the coming days. Make sure you’re ready!
💬 How are you planning to trade USD/JPY right now? Drop your thoughts below and let’s discuss the setup!

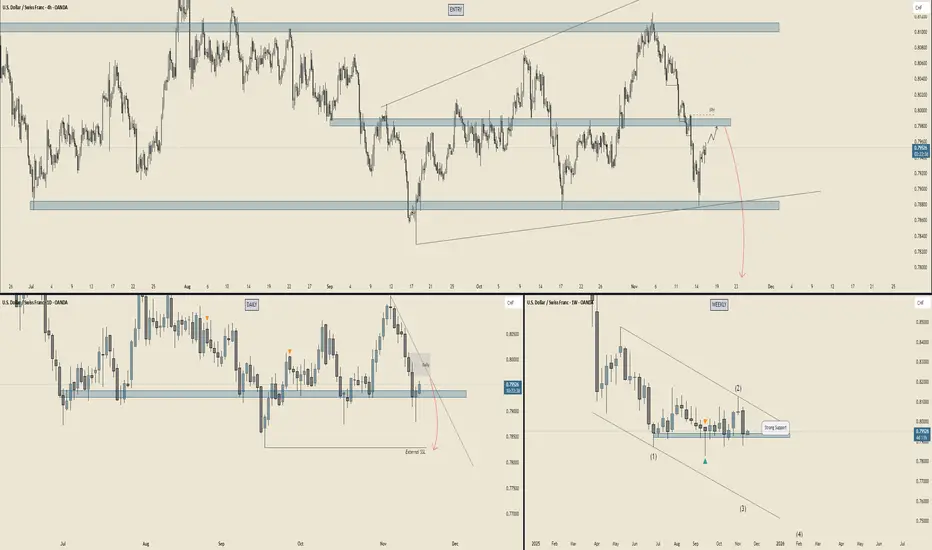
USD/CHF - Multi Timeframe Analysis🚨 USD/CHF Forecast: The Next Move is Almost Here! 🚨
Hey traders, check out this detailed analysis of USD/CHF on the 4-hour, Daily, and Weekly charts. A lot's going on, so let's break it down!
🔍 4-Hour Chart (Top Left):
We’re seeing price testing major support and resistance levels (highlighted in blue). The market looks ready to make a move! We’re keeping a close eye on the Entry Zone at the top, where we might see a continuation of the trend. If we see price action confirming this, it’s game time! ⚡
📅 Daily Chart (Middle Left):
Price has been in a downward trend, but notice that crucial support zone forming below. The trend seems like it could be ready for a bounce back. Will the support hold, or are we headed for a deeper pullback? The next few days will be key! 💡
📊 Weekly Chart (Bottom Right):
Big picture time! This looks like the beginning of something exciting. The longer-term trend is in a clear downward channel (marked by those diagonal lines). That strong support at 0.7800 could be our lifeline. If it holds, we might see the pair shoot up in the coming weeks. 📈✨
💥 Key Levels to Watch:
Resistance : 0.8100 (Keep your eyes on this! It’s a major barrier to break).
Support : 0.7800 (This is where things could get interesting).
Next Target : If the support holds, we could see a move higher toward 0.8000, and potentially test the resistance zone again.
🌟 What’s Next?
The battle between the bulls and bears is heating up! Will USD/CHF rebound off this support level, or will it break lower? Stay tuned for confirmation of the move and prepare for action. 📉📈
EURGBP: Watching 0.87900 as UK Data Signals Stagflation RiskHey Traders,
In tomorrow's session we are monitoring EURGBP for a buying opportunity around the 0.87900 zone. The pair remains in a broader uptrend, and the current pullback is bringing price back toward a key support and resistance area at 0.87900.
From the fundamental side, the UK data continues to print weak, earlier this week we saw soft labor market figures, and now the latest GDP release has also disappointed. At the same time, inflation remains elevated, creating the classic mix no central bank wants to see…
This environment is typically bearish for GBP, adding confluence to the bullish EURGBP setup.
Trade safe,
Joe.

GOLD: Long Signal Explained
GOLD
- Classic bullish formation
- Our team expects pullback
SUGGESTED TRADE:
Swing Trade
Long GOLD
Entry - 4077.1
Sl - 4066.2
Tp - 4094.8
Our Risk - 1%
Start protection of your profits from lower levels
Disclosure: I am part of Trade Nation's Influencer program and receive a monthly fee for using their TradingView charts in my analysis.
❤️ Please, support our work with like & comment! ❤️

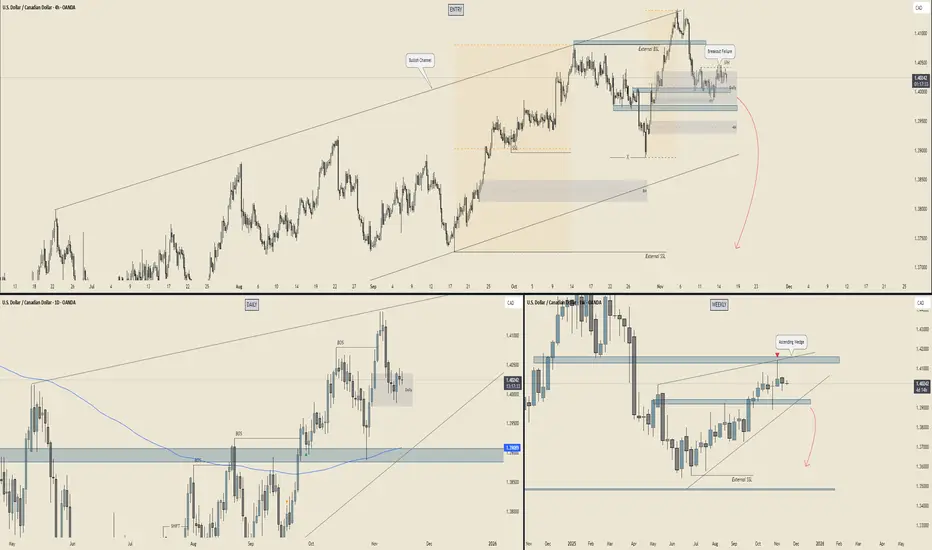
USD/CAD - Multi Timeframe Analysis🧱 WEEKLY – The Big Dog View
Bias: 🐻 Bearish pressure building
Why:
Price is pushing into that massive weekly supply while sitting inside an ascending wedge — textbook distribution energy.
The wedge resistance + supply block is basically a double whammy ceiling.
Reaction wicks show buyers getting tired… sellers warming up.
Beneath current price? A HUGE vacuum of clean, unmitigated price action → easy liquidity to the downside.
🎯 Weekly Target Zones:
1.3900–1.3850 = first stop (mid-range demand)
1.3650–1.3550 = main deep target
External SSL much lower = long-term magnet
👉 Weekly says: “Yo… down only unless we get a breakout above supply.”
📆 DAILY – Internal Structure Rolling Over
Bias : 🐻 Turning bearish
Why : Daily BOS formed on the drop → clear bearish intent.
Price pulled back into a fresh daily supply, reacted cleanly, and is now stalling.
Daily is coiling under resistance = distribution micro-pattern.
As long as the daily mitigation block holds, rallies are just liquidity grabs.
🔥 Daily Key Levels:
Hold below 1.4070 = bearish continuation
Break below 1.3950 = flush into 1.3900
Lose 1.3900 = full send toward 1.38 → 1.37
👉 Daily is setting up the breakdown leg.
⏳ 4H – The Execution Chart (The Juice)
Bias : 🐻 Bearish retest + roll
Why : The 4H bullish channel got broken → structure shift.
We even have a breakout failure at the top = classic “trap the buyers then nuke it.”
4H supply stacking beautifully (Daily + 4H combo).
Price trapped sideways waiting for a trigger → likely a fake-out pop then drop, or a straight collapse.
📌 4H Key Areas:
4H supply: 1.4030–1.4060 = Sell zone
4H support: 1.3950 = Break this → waterfall
Next demand: 1.3880 then the huge imbalance to 1.3800
🎯 4H Targets:
Short-term: 1.3950
Medium: 1.3880
Main: 1.3800
🚀 SUMMARY – USD/CAD Forecast
🔥 Overall Bias: BEARISH (Weekly + Daily + 4H aligned)
🔽 Direction: Expect downside continuation
🎯 Main Target: 1.3800
🧯 Invalidation: Clean daily close above 1.4070 (rare unless oil nukes or USD goes parabolic)
✨ The Likely Path:
Small 4H pullback into supply
Break of 1.3950 internal floor
Fast slide into 1.3880
Larger drop toward 1.3800–1.3750
EURUSD Long: Buyers Targeting a Move Toward 1.1670 ResistanceHello traders! EURUSD is maintaining a bullish structure after rebounding from the Demand Zone at 1.1600–1.1610, where buyers consistently stepped in to defend support. This area also aligns with the Demand Line of the ascending channel, making it a key decision point for the current uptrend. Earlier, the pair formed a Rounding Top near the 1.1650–1.1670 Supply Zone, which triggered a downside breakout and a short-term correction. Once price reached the pivot point around 1.1530, buyers regained control and initiated a steady recovery, forming a clean ascending channel.
Currently, EURUSD is approaching the Supply Zone at 1.1650–1.1670, which also aligns with the Supply Line of the channel — creating a strong confluence resistance area. A breakout above this zone would confirm bullish continuation toward the next major liquidity cluster. As long as the pair holds above the Demand Line, the bullish structure remains intact. A minor pullback toward the 1.1610–1.1620 Demand Zone would be considered a healthy correction within the trend.
My scenario as long as EURUSD stays above 1.1600–1.1610, buyers remain in control and the bullish channel is valid. The primary upside target is 1.1670, which serves as both a Supply Zone and a key structural resistance. A confirmed breakout above 1.1670 would signal continuation toward higher levels and mark a shift into a stronger bullish phase. If the pair rejects the Supply Zone, a pullback toward 1.1620–1.1600 is likely, where buyers may re-enter. A break below 1.1600 would weaken the bullish outlook and open the path toward deeper correction. For now, the market favors buying pullbacks while holding above demand. Manage your risk!

EURNZD Massive Long! BUY!
My dear subscribers,
This is my opinion on the EURNZD next move:
The instrument tests an important psychological level 2.0428
Bias - Bullish
Technical Indicators: Supper Trend gives a precise Bullish signal, while Pivot Point HL predicts price changes and potential reversals in the market.
Target - 2.0477
About Used Indicators:
On the subsequent day, trading above the pivot point is thought to indicate ongoing bullish sentiment, while trading below the pivot point indicates bearish sentiment.
Disclosure: I am part of Trade Nation's Influencer program and receive a monthly fee for using their TradingView charts in my analysis.
———————————
WISH YOU ALL LUCK

EURUSD Eyes 1.15900 Support as DXY Slips Below TrendHey Traders,
In the coming week, we’re monitoring EURUSD for a buying opportunity around the 1.15900 zone. The pair is trading in a broader uptrend and is currently in a correction phase, approaching a key support and resistance area at 1.15900.
On the other hand, the DXY has broken below its uptrend and is now heading toward its retrace area, adding confluence for potential EURUSD upside if dollar weakness continues.
Trade safe,
Joe.

AUDUSD The Target Is UP! BUY!
My dear followers,
I analysed this chart on AUDUSD and concluded the following:
The market is trading on 0.6519 pivot level.
Bias - Bullish
Technical Indicators: Both Super Trend & Pivot HL indicate a highly probable Bullish continuation.
Target - 0.6545
About Used Indicators:
A super-trend indicator is plotted on either above or below the closing price to signal a buy or sell. The indicator changes color, based on whether or not you should be buying. If the super-trend indicator moves below the closing price, the indicator turns green, and it signals an entry point or points to buy.
Disclosure: I am part of Trade Nation's Influencer program and receive a monthly fee for using their TradingView charts in my analysis.
———————————
WISH YOU ALL LUCK

EURUSD: Breakout Structure Supports Move Toward 1.1650Hello everyone, here is my breakdown of the current Euro setup.
Market Analysis
EURUSD is showing a clear bullish shift after breaking out of multiple downward structures and reclaiming higher support levels. The chart highlights several key phases: a prolonged decline inside two consecutive Downward Channels, followed by confirmed breakouts, each signaling weakening bearish momentum. After the second downward channel breakout, EURUSD established a stable bullish structure, forming an ascending move supported by the Triangle Support Line. Price has been consistently creating higher lows along this line, indicating strong buyer presence.
Currently, EURUSD retraced back toward the Triangle Support Line after being rejected from the major Resistance Area around 1.16500. This zone has acted as a key supply region multiple times, and it also aligns with the Triangle Resistance Line, making it a significant confluence area. As long as price remains above the ascending support, the bullish structure stays intact. The overall market behavior shows healthy correction patterns followed by breakouts, suggesting that buyers remain in control, with momentum gradually building toward the upper resistance once again.
My Scenario & Strategy
I expect price to rebound from the current correction zone and attempt another move toward the 1.16500 Resistance, which is the next major decision point. A successful breakout above 1.16500, followed by consolidation, would signal a bullish expansion and could open the path toward higher targets in the coming sessions.
However, if EURUSD breaks below the Triangle Support Line, the current bullish structure would weaken, and price may return to lower support areas before buyers attempt another recovery. For now, structure remains bullish, and pullback-based long entries continue to offer the best opportunity while price respects the rising support trendline.
That's the setup I'm tracking. Thank you for your attention, and always manage your risk.

BTCUSD On The Rise! BUY!
My dear friends,
My technical analysis for BTCUSD is below:
The market is trading on 94419 pivot level.
Bias - Bullish
Technical Indicators: Both Super Trend & Pivot HL indicate a highly probable Bullish continuation.
Target - 98381
About Used Indicators:
A pivot point is a technical analysis indicator, or calculations, used to determine the overall trend of the market over different time frames.
Disclosure: I am part of Trade Nation's Influencer program and receive a monthly fee for using their TradingView charts in my analysis.
———————————
WISH YOU ALL LUCK

EURUSD Will Go Up From Support! Buy!
Take a look at our analysis for EURUSD.
Time Frame: 5h
Current Trend: Bullish
Sentiment: Oversold (based on 7-period RSI)
Forecast: Bullish
The price is testing a key support 1.161.
Current market trend & oversold RSI makes me think that buyers will push the price. I will anticipate a bullish movement at least to 1.167 level.
P.S
We determine oversold/overbought condition with RSI indicator.
When it drops below 30 - the market is considered to be oversold.
When it bounces above 70 - the market is considered to be overbought.
Like and subscribe and comment my ideas if you enjoy them!

USDCAD Will Go Higher! Long!
Please, check our technical outlook for USDCAD.
Time Frame: 5h
Current Trend: Bullish
Sentiment: Oversold (based on 7-period RSI)
Forecast: Bullish
The market is trading around a solid horizontal structure 1.401.
The above observations make me that the market will inevitably achieve 1.407 level.
P.S
Overbought describes a period of time where there has been a significant and consistent upward move in price over a period of time without much pullback.
Like and subscribe and comment my ideas if you enjoy them!

EURCAD Will Go Up! Buy!
Here is our detailed technical review for EURCAD.
Time Frame: 9h
Current Trend: Bullish
Sentiment: Oversold (based on 7-period RSI)
Forecast: Bullish
The market is testing a major horizontal structure 1.628.
Taking into consideration the structure & trend analysis, I believe that the market will reach 1.639 level soon.
P.S
Please, note that an oversold/overbought condition can last for a long time, and therefore being oversold/overbought doesn't mean a price rally will come soon, or at all.
Like and subscribe and comment my ideas if you enjoy them!

GOLD Is Going Up! Long!
Take a look at our analysis for GOLD.
Time Frame: 2h
Current Trend: Bullish
Sentiment: Oversold (based on 7-period RSI)
Forecast: Bullish
The market is approaching a key horizontal level 4,007.16.
Considering the today's price action, probabilities will be high to see a movement to 4,053.41.
P.S
Overbought describes a period of time where there has been a significant and consistent upward move in price over a period of time without much pullback.
Like and subscribe and comment my ideas if you enjoy them!

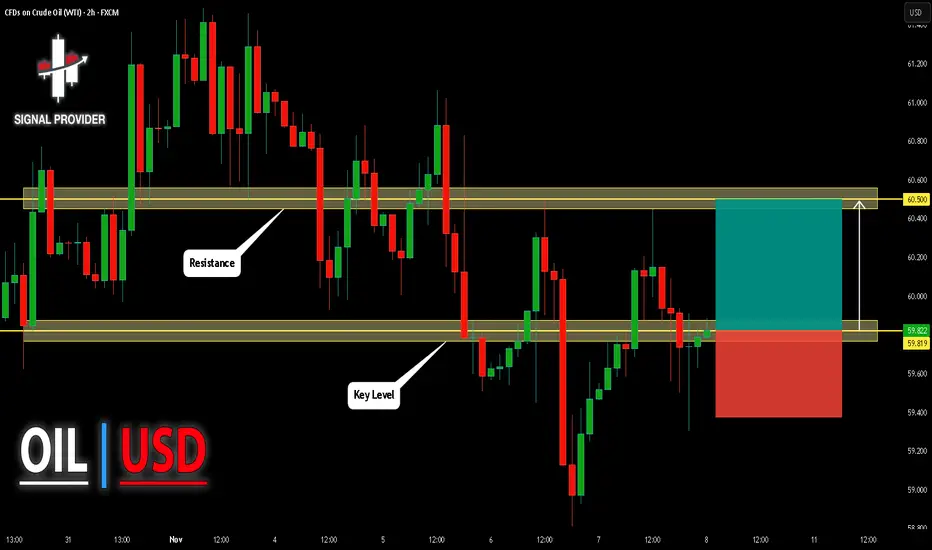
USOIL Will Move Higher! Buy!
Take a look at our analysis for USOIL.
Time Frame: 2h
Current Trend: Bullish
Sentiment: Oversold (based on 7-period RSI)
Forecast: Bullish
The price is testing a key support 59.819.
Current market trend & oversold RSI makes me think that buyers will push the price. I will anticipate a bullish movement at least to 60.500 level.
P.S
Please, note that an oversold/overbought condition can last for a long time, and therefore being oversold/overbought doesn't mean a price rally will come soon, or at all.
Like and subscribe and comment my ideas if you enjoy them!
XAUUSD Buyers Step In — Market Aiming for $4,140 RetestHello traders! Let’s take a look at XAUUSD (Gold). XAUUSD maintains a bullish structure after bouncing from the key $4,050–$4,060 support zone, where price also retested the ascending trendline. After breaking out of the descending channel, Gold formed a new accumulation zone and moved higher, approaching the strong $4,140 resistance level. The price is now trading between the ascending support and the local supply zone near $4,140, forming a tightening structure. A breakout above this level could open the way for further upside, while a rejection may trigger a correction back toward $4,060. As long as XAUUSD holds above $4,060 and the ascending trendline, a renewed move toward $4,140 remains likely, with potential for a breakout. Please share this idea with your friends and click Boost 🚀

BTCUSD Rebounds From Buyer Zone — Correction Toward $101KHello traders! Let’s take a look at BTCUSD (Bitcoin). After an extended bearish phase inside a broad descending channel, price consistently respected both the resistance and support lines, forming a clear series of lower highs. Each touch of the descending resistance line resulted in a Turned Around reaction, confirming strong seller control throughout the structure. Earlier, Bitcoin broke below its local support area, initiating a deeper correction toward the major Support Level near $96,000. This zone aligns with the lower boundary of the descending channel and historically served as a strong reaction area for buyers. Recently, BTCUSD reached the bottom of the structure and is now showing early signs of a potential pullback. Price is attempting to rebound from the Buyer Zone, aiming toward the nearest resistance cluster around $100,800–$101,600, which also forms the lower boundary of the Seller Zone. This level previously acted as support and is now expected to serve as a strong retest area. As long as price remains below the descending resistance line, the overall trend stays bearish. A short-term bullish correction toward TP1: $101,600 remains possible, especially if buyers maintain control above the $96,000 support. However, if BTC fails to break above the Seller Zone, sellers may step in again, potentially pushing the price back toward the major support and even extending the downtrend. A confirmed breakout above the descending resistance would invalidate the bearish scenario and open the door for a stronger recovery. Please share this idea with your friends and click Boost 🚀

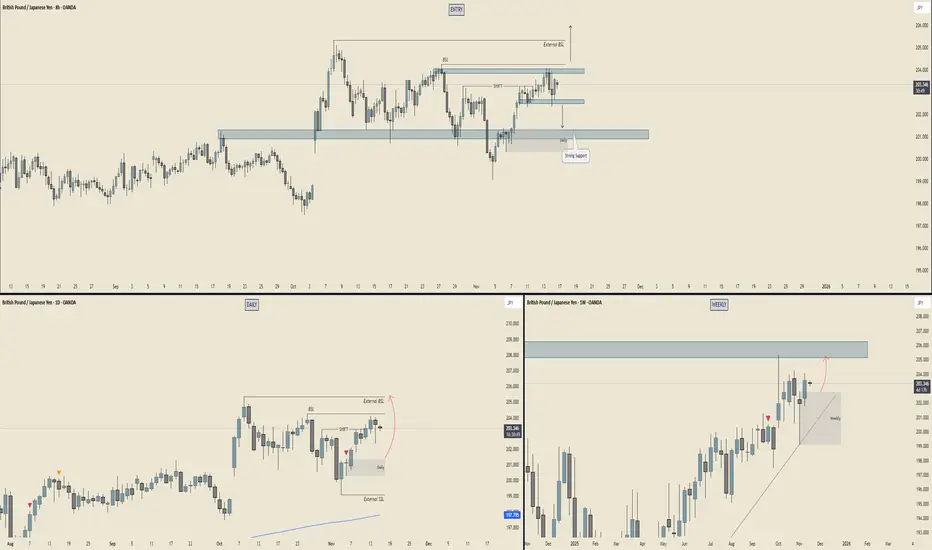
GBP/JPY - Multi Timeframe Analysis⭐ 8H CHART – Mid-Range Chop But Setting Up a Sneaky Play
📍 Current Situation
Price is chilling just under that internal BSL, repeatedly tapping a mini supply shelf. You’ve got a SHIFT marked and a clear reaction zone sitting underneath (your grey + blue combo).
💡 Key Levels
Internal BSL → Gets run, we go hunting for External BSL above.
Strong support block below → Price keeps respecting this like a trampoline.
Market is compressing between:
🔼 8H supply above
🔽 Bullish support block below
📌 Interpretation:
This looks like accumulation under liquidity → classic build-up for a sweep + pop.
If price dips first, your grey demand is the reload zone before any upper raid.
⭐ DAILY CHART – Clean Buyside Above, Built For a Run
📍 Structure
Daily is holding bullish order flow. You’ve got:
Daily BSL close overhead
External BSL even further up
A beautiful Daily demand block (highlighted) that caused the last impulsive leg.
📌 Interpretation:
The arrow you drew says it all — Daily wants that buy-side.
Sweep the daily demand → send price into external liquidity.
Momentum = bullish unless that daily block breaks.
⭐ WEEKLY CHART – HTF Premium Zone Waiting Above
📍 The Big Picture
Weekly demand held weeks ago and price has been climbing ever since.
Key details:
That massive weekly supply / inefficiency block above 205-207 is the magnet.
Price is stair-stepping higher with clean bullish candles.
Arrow toward weekly imbalance = HTF target.
📌 Interpretation:
Weekly is bullish and wants that macro supply fill.
Shorts inside here = countertrend until we hit the big zone.
🎯 SUMMARY – What’s the Play?
🔥 Bias : Bullish on all timeframes
📌 What the market wants:
A tiny correction to demand (8H or Daily)
Run internal liquidity
Push toward 205-207 weekly supply
🧨 What invalidates this?
A clean break and close below daily demand — then the bullish engine loses fuel.
TESLA Technical Analysis! BUY!
My dear friends,
Please, find my technical outlook for TESLA below:
The price is coiling around a solid key level - 404.39
Bias - Bullish
Technical Indicators: Pivot Points Low anticipates a potential price reversal.
Super trend shows a clear buy, giving a perfect indicators' convergence.
Goal - 426.96
About Used Indicators:
The pivot point itself is simply the average of the high, low and closing prices from the previous trading day.
Disclosure: I am part of Trade Nation's Influencer program and receive a monthly fee for using their TradingView charts in my analysis.
———————————
WISH YOU ALL LUCK

US30: Growth & Bullish Continuation
The price of US30 will most likely increase soon enough, due to the demand beginning to exceed supply which we can see by looking at the chart of the pair.
Disclosure: I am part of Trade Nation's Influencer program and receive a monthly fee for using their TradingView charts in my analysis.
❤️ Please, support our work with like & comment! ❤️
