Nasdaq Pre-Market Long CIB Trade🔱 Here comes the CIB Trade 🔱
Price came down in 5 waves.
The CIB line gives us a heads-up if price breaks through it, and it did!
Now everyone and it's Grandma is long on the breakout.
"...let's scare them out, let's hit their Stop!"
Then we take off upon a test of the CIB-Line, which in essence is the same as a test fo a U-MLH or L-MLH after a break.
We have a nice target with a chance to hit of about 80% at the Centerline, and a fantastic tiny stop below the test at the CIB line.
Let's watch how this unfolds.
Long!!!!

USDJPY Is Bullish! Buy!
Take a look at our analysis for USDJPY.
Time Frame: 1D
Current Trend: Bullish
Sentiment: Oversold (based on 7-period RSI)
Forecast: Bullish
The market is approaching a key horizontal level 147.322.
Considering the today's price action, probabilities will be high to see a movement to 149.724.
P.S
Overbought describes a period of time where there has been a significant and consistent upward move in price over a period of time without much pullback.
Like and subscribe and comment my ideas if you enjoy them!

USDJPY Will Go Higher! Long!
Take a look at our analysis for USDJPY.
Time Frame: 8h
Current Trend: Bullish
Sentiment: Oversold (based on 7-period RSI)
Forecast: Bullish
The price is testing a key support 148.376.
Current market trend & oversold RSI makes me think that buyers will push the price. I will anticipate a bullish movement at least to 149.207 level.
P.S
We determine oversold/overbought condition with RSI indicator.
When it drops below 30 - the market is considered to be oversold.
When it bounces above 70 - the market is considered to be overbought.
Like and subscribe and comment my ideas if you enjoy them!

GBP/CHF BULLISH BIAS RIGHT NOW| LONG
GBP/CHF SIGNAL
Trade Direction: long
Entry Level: 1.067
Target Level: 1.075
Stop Loss: 1.062
RISK PROFILE
Risk level: medium
Suggested risk: 1%
Timeframe: 1D
Disclosure: I am part of Trade Nation's Influencer program and receive a monthly fee for using their TradingView charts in my analysis.
✅LIKE AND COMMENT MY IDEAS✅

Gold Pullback Toward 3,700 Within Ongoing UptrendHey Traders, in today's trading session we are monitoring XAUUSD (Gold) for a buying opportunity around the 3,700 zone. Gold is trading in an uptrend, with price currently correcting toward this key support/resistance level.
Structure: The broader bias remains bullish, but price is retracing after recent highs.
Key level in focus: 3,700 — a critical area where buyers may look to step in and resume the upward move.
Fundamentals: Softer USD sentiment and steady safe-haven demand continue to favor the bullish case for Gold on dips.
Trade safe,
Joe.

BTC 110K Low time frame can be the return for Bitcoin📊 Market update low time frame
If there is good news, then BTC should confirm in 4H max.
If btc is able to gain 110K on the low time frame, there is a good chance we can go with BTC to a new uptrend, which could also mean good news for most of the altcoins.
All eyes are on the 10K in the coming time frame for a confirmation.
BTC can make a downtrend move to get volume with a spike to a low time frame, as we know from BTC.
IF BTC moves lower, the low time frame can change to 109800
110K can be the reason for 113K, and a confirmed main trend means a positive BTC
We will follow it step by step.

AUDCAD What Next? BUY!
My dear friends,
My technical analysis for AUDCAD is below:
The market is trading on 0.9118 pivot level.
Bias - Bullish
Technical Indicators: Both Super Trend & Pivot HL indicate a highly probable Bullish continuation.
Target - 0.9138
Recommended Stop Loss - 0.9107
About Used Indicators:
A pivot point is a technical analysis indicator, or calculations, used to determine the overall trend of the market over different time frames.
Disclosure: I am part of Trade Nation's Influencer program and receive a monthly fee for using their TradingView charts in my analysis.
———————————
WISH YOU ALL LUCK

EURUSD: Expecting Bullish Movement! Here is Why:
The recent price action on the EURUSD pair was keeping me on the fence, however, my bias is slowly but surely changing into the bullish one and I think we will see the price go up.
Disclosure: I am part of Trade Nation's Influencer program and receive a monthly fee for using their TradingView charts in my analysis.
❤️ Please, support our work with like & comment! ❤️

GBPCAD: Long Signal with Entry/SL/TP
GBPCAD
- Classic bullish pattern
- Our team expects retracement
SUGGESTED TRADE:
Swing Trade
Buy GBPCAD
Entry - 1.8620
Stop - 1.8602
Take - 1.8662
Our Risk - 1%
Start protection of your profits from lower levels
Disclosure: I am part of Trade Nation's Influencer program and receive a monthly fee for using their TradingView charts in my analysis.
❤️ Please, support our work with like & comment! ❤️

XAGUSD SILVER📈 Silver (XAGUSD) – Long Setup (4H)
Technical View
Price has broken out of a rectangle consolidation on the 4H chart.
Breakout is supported by bullish momentum candles.
Market structure showing higher highs (HHs) and higher lows
Trading Plan
Entry: On successful breakout retest / bullish confirmation candle.
Targets:
🎯 TP1:
🎯 TP2:
🎯 TP3:
Risk Management Rule
Once TP1 is hit, immediately move SL to entry (break-even).
Partial profits can be booked at TP1; let the rest run toward TP2 and TP3.

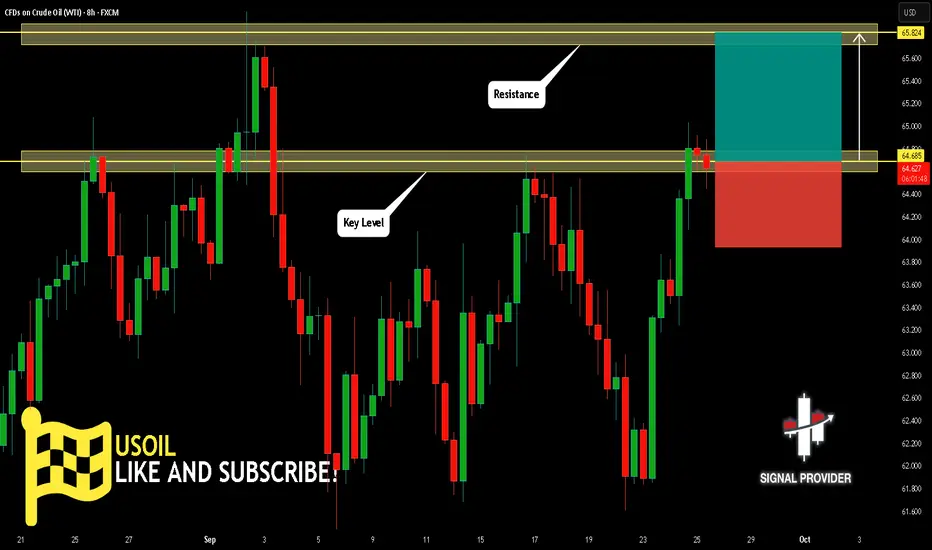
USOIL Is Bullish! Long!
Please, check our technical outlook for USOIL.
Time Frame: 8h
Current Trend: Bullish
Sentiment: Oversold (based on 7-period RSI)
Forecast: Bullish
The market is trading around a solid horizontal structure 64.685.
The above observations make me that the market will inevitably achieve 65.824 level.
P.S
The term oversold refers to a condition where an asset has traded lower in price and has the potential for a price bounce.
Overbought refers to market scenarios where the instrument is traded considerably higher than its fair value. Overvaluation is caused by market sentiments when there is positive news.
Like and subscribe and comment my ideas if you enjoy them!
EURUSD Is Very Bullish! Buy!
Here is our detailed technical review for EURUSD.
Time Frame: 3h
Current Trend: Bullish
Sentiment: Oversold (based on 7-period RSI)
Forecast: Bullish
The market is testing a major horizontal structure 1.173.
Taking into consideration the structure & trend analysis, I believe that the market will reach 1.179 level soon.
P.S
We determine oversold/overbought condition with RSI indicator.
When it drops below 30 - the market is considered to be oversold.
When it bounces above 70 - the market is considered to be overbought.
Like and subscribe and comment my ideas if you enjoy them!

AUDUSD Is Going Up! Long!
Take a look at our analysis for AUDUSD.
Time Frame: 9h
Current Trend: Bullish
Sentiment: Oversold (based on 7-period RSI)
Forecast: Bullish
The market is approaching a key horizontal level 0.658.
Considering the today's price action, probabilities will be high to see a movement to 0.668.
P.S
Overbought describes a period of time where there has been a significant and consistent upward move in price over a period of time without much pullback.
Like and subscribe and comment my ideas if you enjoy them!

AUD/CAD BULLS ARE GAINING STRENGTH|LONG
Hello, Friends!
AUD/CAD pair is trading in a local uptrend which know by looking at the previous 1W candle which is green. On the 4H timeframe the pair is going down. The pair is oversold because the price is close to the lower band of the BB indicator. So we are looking to buy the pair with the lower BB line acting as support. The next target is 0.914 area.
Disclosure: I am part of Trade Nation's Influencer program and receive a monthly fee for using their TradingView charts in my analysis.
✅LIKE AND COMMENT MY IDEAS✅

SOLUSDT Strong Rejection at Key Support – 230.00 Incoming!Hey everyone, Ken here!
SOLUSDT has been quite interesting lately. After a sharp decline from the channel’s top, the price broke through the support zone, often referred to as the neckline, and reached a key support area below. Here, we saw a strong rejection wick, which clearly indicates that buyers have stepped in and are ready to take control of the market.
With this setup, I predict that the 230.00 level will be a reasonable target in the short term. The strong rejection at this support zone suggests a high potential for a reversal.
Feel free to leave a comment if you agree with this prediction, or if you have a different perspective. Let’s discuss and share our ideas!

NZDCAD Set To Grow! BUY!
My dear followers,
This is my opinion on the NZDCAD next move:
The asset is approaching an important pivot point 0.8078
Bias - Bullish
Safe Stop Loss - 0.8072
Technical Indicators: Supper Trend generates a clear long signal while Pivot Point HL is currently determining the overall Bullish trend of the market.
Goal - 0.8088
About Used Indicators:
For more efficient signals, super-trend is used in combination with other indicators like Pivot Points.
Disclosure: I am part of Trade Nation's Influencer program and receive a monthly fee for using their TradingView charts in my analysis.
———————————
WISH YOU ALL LUCK

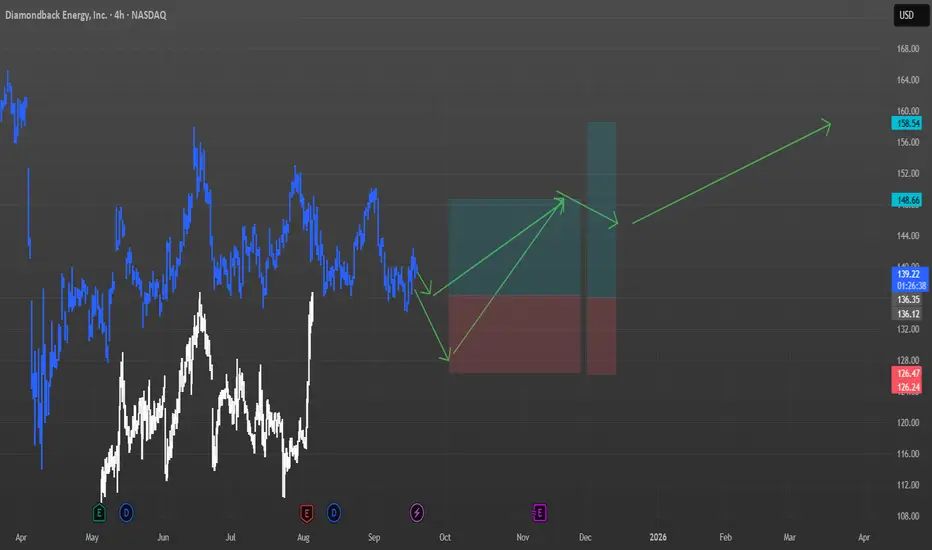
FAg / DIAMONDBACK ENERGY / Fractal and Seasonality / LongHave we reached this years bottom yet?
For me it is finding entry at any good price action and in case price droppes I have my reason to add more to the position when price should hit 128 as a low.
Seasonality tells us in PE+1 we are bullish until 26th of November for FANG.
Then rather bearish until 19th of December.
This is for educational purpose only. not a trade call or financial advice.....
Have fun, let's discuss. Comment or write to me in private chat.
Cheers!

EURCHF: Bullish Forecast & Outlook
The price of EURCHF will most likely increase soon enough, due to the demand beginning to exceed supply which we can see by looking at the chart of the pair.
Disclosure: I am part of Trade Nation's Influencer program and receive a monthly fee for using their TradingView charts in my analysis.
❤️ Please, support our work with like & comment! ❤️

GOLD: Bullish Continuation & Long Signal
GOLD
- Classic bullish setup
- Our team expects bullish continuation
SUGGESTED TRADE:
Swing Trade
Long GOLD
Entry Point - 3756.7
Stop Loss - 3751.5
Take Profit - 3768.4
Our Risk - 1%
Start protection of your profits from lower levels
Disclosure: I am part of Trade Nation's Influencer program and receive a monthly fee for using their TradingView charts in my analysis.
❤️ Please, support our work with like & comment! ❤️

EURUSD Will Explode! BUY!
My dear friends,
Please, find my technical outlook for EURUSD below:
The price is coiling around a solid key level - 1.1734
Bias - Bullish
Technical Indicators: Pivot Points High anticipates a potential price reversal.
Super trend shows a clear buy, giving a perfect indicators' convergence.
Goal - 1.1777
About Used Indicators:
The pivot point itself is simply the average of the high, low and closing prices from the previous trading day.
Disclosure: I am part of Trade Nation's Influencer program and receive a monthly fee for using their TradingView charts in my analysis.
———————————
WISH YOU ALL LUCK

ETH Analysis: Deeper Pullback in PlayETH is still trading within a broader uptrend channel, but recently, the price has started to pull back after a significant rally. After pushing up too far, the market is now taking a breather and recalibrating.
From a technical standpoint, this pullback is completely normal and healthy after such a strong move. Pullbacks like this are part of any bullish trend, providing the market a chance to reset. If the pullback continues, the next target could be the 3,600 support area, where multiple key factors converge: horizontal support, trendline support, and the 0.618 Fibonacci retracement level.
The 3,600 level is crucial. If ETH holds strong here and shows signs of a reversal, it could be a solid entry point for the next leg up. However, if the price breaks below this level, we may see deeper downside, and the current bullish structure could start to break down.
As always, confirm your setups before entering and make sure your risk management is solid. Stay alert for the next opportunities!

GBPCAD The Target Is UP! BUY!
My dear friends,
Please, find my technical outlook for GBPCAD below:
The instrument tests an important psychological level 1.8661
Bias - Bullish
Technical Indicators: Supper Trend gives a precise Bullish signal, while Pivot Point HL predicts price changes and potential reversals in the market.
Target - 1.8686
Recommended Stop Loss - 1.8649
About Used Indicators:
Super-trend indicator is more useful in trending markets where there are clear uptrends and downtrends in price.
Disclosure: I am part of Trade Nation's Influencer program and receive a monthly fee for using their TradingView charts in my analysis.
———————————
WISH YOU ALL LUCK
