GBPCHF Is Bullish! Long!
Take a look at our analysis for GBPCHF.
Time Frame: 3h
Current Trend: Bullish
Sentiment: Oversold (based on 7-period RSI)
Forecast: Bullish
The price is testing a key support 1.056.
Current market trend & oversold RSI makes me think that buyers will push the price. I will anticipate a bullish movement at least to 1.059 level.
P.S
We determine oversold/overbought condition with RSI indicator.
When it drops below 30 - the market is considered to be oversold.
When it bounces above 70 - the market is considered to be overbought.
Like and subscribe and comment my ideas if you enjoy them!
Long!!

Gold Nears Resistance — Buyers Target $4,130 BreakoutHello traders, here’s my current outlook on Gold (XAUUSD). The market structure shows that Gold has recently shifted from a sharp bearish phase into a short-term recovery pattern, finding solid demand near the $3,940–$3,950 Buyer Zone. After the last strong drop from the $4,130 Resistance Level, price stabilized within this accumulation area and began forming an ascending structure supported by a clear Support Line. Currently, Gold is trading inside a rising wedge pattern — a signal of a tightening market where buyers are gradually gaining ground. The Resistance Line near $4,050 represents a short-term barrier, and a confirmed breakout above this level could open the way for a move toward the $4,130 Resistance Zone (TP1), which aligns with the previous Seller Zone. From my perspective, as long as the price remains above the $3,940–$3,950 Support Zone, the bullish bias remains valid. A successful breakout above $4,050 would likely confirm the continuation of the current upward momentum, targeting $4,130. However, if the price fails to break above resistance and falls below the ascending support line, a short-term pullback toward the Buyer Zone could occur before any new bullish wave develops. In my opinion, the market structure currently favors buyers, with strong support underpinning the move. Therefore, I’m expecting a potential bullish continuation toward $4,130 as the next key target.

BITCOIN – LONG - 105K SWEEP BEFORE WE LEAPTraders,
In my latest analysis I said that Bitcoin will reach 117.000-117.500 before a bigger dump. Price didn't reach those levels yet, and dumped instantly instead.
However, the main thesis still stands: price is likely to reach that zone (117.000-117.500) before a larger reversal down. But before that, I expect a short squeeze beginning at $105.000.
Why I Expect a Squeeze
During the Asia session, new leveraged short exposure was built. Open Interest (OI) increased while Net Shorts rose, showing that traders were adding fresh short positions.
Around 107,000–107,500, both Spot CVD and Coin-Margined CVD are showing bullish divergence. Sellers are active, but price is holding, which indicates absorption.
Stablecoin-Margined CVD in the same range shows exhaustion, suggesting selling pressure is fading.
At New York open, OI continued to rise together with Net Longs, meaning aggressive longs are now fading into the short exposure created during Asia.
What This Means
Historically, the London and New York sessions tend to sweep Asia’s positioning. When Asia builds short exposure, the later sessions often push price higher to liquidate those shorts. This often results in a short squeeze, which aligns with what we may be seeing now.
Determining the Next Move Down
Before deciding if price extends lower first, we must identify the variables of probability (VOP) — the “magnets” that increase the likelihood of a lower sweep.
1. Weak Thursday Low
There is a weak low that has not been properly tested. In TPO (Time Price Opportunity) terms, a weak low forms when price finds temporary support without strong buying response. Such levels often get revisited.
2. Unswept Sunday 19 Oct Low
There is also an unswept Sunday low from 19 October. Sunday lows are often swept because weekend liquidity is thin and order books are shallow. When liquidity returns during the week, those inefficient areas tend to get filled.
Imbalances and Volume Gaps Below
Next we look for gaps, imbalances, or LVNs (Low Volume Nodes) — areas where trading activity was limited or one-sided. These zones often attract price because markets seek balance.
Many traders identify “fair value gaps” by looking at candles, but that only shows part of the picture. To locate the real inefficiency, we need to look inside the candles using order flow or a Fixed Range Volume Profile (FRVP) to find the exact levels of bid-ask imbalance.
Volume Profile and Fibonacci Confluence
Drawing the Fixed Range Volume Profile from the impulse move below the Sunday 19 Oct low shows a clear imbalance at 105,070.
Checking confluences:
The 0.786 Fibonacci retracement (low to high) aligns exactly with 105,070
The 0.886 retracement (higher low to high) also aligns exactly with 105,070
Fibonacci extensions (1.113 and 1.272) both target around 105,000
The 0.618 extension also lands near 105,000
Thesis Summary
Based on all data and confluence:
Price likely dips to sweep the weak 30 Oct low and the 19 Oct Sunday low
Target zone: LVN / imbalance near 105,000
Expect a liquidity grab that traps late shorts and shakes out weak longs
After that, expect a reversal toward 117,000–117,500, where the next major liquidity pool lies
Why a Lower Sweep Is Expected
The Asia session built significant short exposure
There is an inefficiency and low-volume magnet around 105k
Weak lows provide clear liquidity targets
Once those areas are cleared, market structure favors a strong reversal upward
In summary:
Bitcoin is likely to make one more sweep toward the 105,000 zone to clear liquidity before expanding upward into the 117,000–117,500 area, where a larger reversal setup is likely to form. Of course, price can always move up or down without perfectly respecting these levels — the market does not owe us precision. These levels simply represent the highest-probability areas based on current data and confluence.

AUDUSD My Opinion! BUY!
My dear followers,
I analysed this chart on AUDUSD and concluded the following:
The market is trading on 0.6526 pivot level.
Bias - Bullish
Technical Indicators: Both Super Trend & Pivot HL indicate a highly probable Bullish continuation.
Target - 0.6565
About Used Indicators:
A super-trend indicator is plotted on either above or below the closing price to signal a buy or sell. The indicator changes color, based on whether or not you should be buying. If the super-trend indicator moves below the closing price, the indicator turns green, and it signals an entry point or points to buy.
Disclosure: I am part of Trade Nation's Influencer program and receive a monthly fee for using their TradingView charts in my analysis.
———————————
WISH YOU ALL LUCK

AUDJPY Set To Grow! BUY!
My dear followers,
This is my opinion on the AUDJPY next move:
The asset is approaching an important pivot point 100.66
Bias - Bullish
Safe Stop Loss - 100.57
Technical Indicators: Supper Trend generates a clear long signal while Pivot Point HL is currently determining the overall Bullish trend of the market.
Goal - 100.83
About Used Indicators:
For more efficient signals, super-trend is used in combination with other indicators like Pivot Points.
Disclosure: I am part of Trade Nation's Influencer program and receive a monthly fee for using their TradingView charts in my analysis.
———————————
WISH YOU ALL LUCK

USOIL Is Very Bullish! Buy!
Please, check our technical outlook for USOIL.
Time Frame: 6h
Current Trend: Bullish
Sentiment: Oversold (based on 7-period RSI)
Forecast: Bullish
The market is trading around a solid horizontal structure 60.808.
The above observations make me that the market will inevitably achieve 62.277 level.
P.S
Overbought describes a period of time where there has been a significant and consistent upward move in price over a period of time without much pullback.
Like and subscribe and comment my ideas if you enjoy them!

GBPCAD Will Grow! Long!
Take a look at our analysis for GBPCAD.
Time Frame: 1D
Current Trend: Bullish
Sentiment: Oversold (based on 7-period RSI)
Forecast: Bullish
The market is approaching a key horizontal level 1.844.
Considering the today's price action, probabilities will be high to see a movement to 1.869.
P.S
The term oversold refers to a condition where an asset has traded lower in price and has the potential for a price bounce.
Overbought refers to market scenarios where the instrument is traded considerably higher than its fair value. Overvaluation is caused by market sentiments when there is positive news.
Like and subscribe and comment my ideas if you enjoy them!

CHFJPY: Expecting Bullish Movement! Here is Why:
The analysis of the CHFJPY chart clearly shows us that the pair is finally about to go up due to the rising pressure from the buyers.
❤️ Please, support our work with like & comment! ❤️

AUD/NZD BULLS ARE GAINING STRENGTH|LONG
Hello, Friends!
AUD/NZD pair is in the downtrend because previous week’s candle is red, while the price is evidently falling on the 1H timeframe. And after the retest of the support line below I believe we will see a move up towards the target above at 1.136 because the pair oversold due to its proximity to the lower BB band and a bullish correction is likely.
Disclosure: I am part of Trade Nation's Influencer program and receive a monthly fee for using their TradingView charts in my analysis.
✅LIKE AND COMMENT MY IDEAS✅

EUR/GBP SENDS CLEAR BULLISH SIGNALS|LONG
Hello, Friends!
We are going long on the EUR/GBP with the target of 0.869 level, because the pair is oversold and will soon hit the support line below. We deduced the oversold condition from the price being near to the lower BB band. However, we should use low risk here because the 1W TF is red and gives us a counter-signal.
Disclosure: I am part of Trade Nation's Influencer program and receive a monthly fee for using their TradingView charts in my analysis.
✅LIKE AND COMMENT MY IDEAS✅

EURUSD Will Explode! BUY!
My dear friends,
Please, find my technical outlook for EURUSD below:
The instrument tests an important psychological level 1.1515
Bias - Bullish
Technical Indicators: Supper Trend gives a precise Bullish signal, while Pivot Point HL predicts price changes and potential reversals in the market.
Target - 1.1538
Recommended Stop Loss - 1.1503
About Used Indicators:
Super-trend indicator is more useful in trending markets where there are clear uptrends and downtrends in price.
Disclosure: I am part of Trade Nation's Influencer program and receive a monthly fee for using their TradingView charts in my analysis.
———————————
WISH YOU ALL LUCK

XAUUSD Long: Demand Zone Holding, Eyes on $4,080Hello traders! Gold (XAUUSD) is currently showing a corrective phase within its broader bullish trend. After a strong rally from the $3,850 Demand Zone, price climbed steadily along the ascending Trend Line, forming higher highs and higher lows until reaching the $4,150–$4,180 Resistance Area. This zone acted as a key pivot point, where buyers lost momentum and sellers initiated a retracement.
Following this, the market broke below the Trend Line, signaling the start of a short-term correction. The correction found temporary support near the $3,950 Demand Zone, where buyers have recently stepped in again. This level coincides with a previous pivot and a key structural support area, suggesting a potential rebound setup. At the moment, price is consolidating between the $3,950 Demand Zone and the $4,080–$4,150 Resistance Area, indicating indecision before the next move.
From my perspective, Gold is likely to attempt a bullish correction toward the $4,080–$4,150 Resistance Zone, which aligns with both the previous Trend Line and recent pivot structure. A successful break and close above $4,150 would confirm a trend continuation toward higher levels. However, if the price fails to break above this resistance area and gets rejected, sellers could regain control, pushing the market back down toward $3,950 or even lower. For now, I’ll be watching for confirmation of a bullish reaction from the $3,950 Demand Zone to validate a short-term long setup targeting $4,080. Manage your risk!

BTCUSDT: Buyers Aim for Recovery Toward $115K ResistanceHello everyone, here is my breakdown of the current Bitcoin setup.
Market Analysis
Bitcoin (BTCUSDT) is showing a constructive bullish setup after rebounding from the 106,600–107,000 Support Zone. This area has consistently acted as a strong demand region, confirming buyers’ interest each time price tested the lower boundary of the Upward Channel. The market structure has remained bullish overall, characterized by a series of higher highs and higher lows since the correction phase in mid-October.After a recent fake breakout below the support line, buyers quickly regained control, pushing price back above the channel’s lower boundary. This rejection from support and recovery above 110,000 suggests renewed bullish momentum.
Currently, BTCUSDT is approaching the midline of the channel, while short-term resistance lies at 115,400 — a level that coincides with a previous fake breakout zone and horizontal supply area.
My Scenario & Strategy
As long as BTCUSDT holds above the 109,000–110,000 region, the bullish scenario remains valid. I expect the price to continue climbing toward the 113,000–115,400 Resistance Zone in the near term. A clean breakout above 115,400 could open the way for another bullish leg toward the upper boundary of the channel near 117,000–118,000.
However, a confirmed rejection from 115,400 could trigger a temporary pullback toward the support trendline before another potential push higher. In my view, Bitcoin remains in a healthy uptrend, and I prefer to look for long opportunities from dips above the support line, targeting 115,400 (TP1) and potentially 117,000 (TP2).
That's the setup I'm tracking. Thank you for your attention, and always manage your risk.

EURUSD: Bounce from Support Could Trigger Move Toward 1.1640Hello everyone, here is my breakdown of the current Euro setup.
Market Analysis
EURUSD has been trading in a corrective phase after breaking down from the Upward Channel that previously guided its bullish movement. The pair formed a Range near the 1.1760 Resistance Area, showing consolidation before sellers regained control. Multiple Breakouts confirmed shifts in market structure — first to the upside within the channel, and later to the downside, signaling the transition from bullish to neutral-bearish momentum.
Recently, price found strong demand within the 1.1550–1.1560 Support Zone, which aligns with the Triangle Support Line. This level has been tested multiple times, acting as a significant pivot point for potential bullish reactions. The Triangle Resistance Line above continues to limit upward movement, forming a contracting structure that reflects growing pressure from both sides.
My Scenario & Strategy
From my view, EURUSD is currently setting up for a possible bullish rebound from the support zone near 1.1560. If buyers defend this level, the price could rise toward the Triangle Resistance Line around 1.1630–1.1640. A confirmed breakout above this resistance could open the way toward the key 1.1760 Resistance Zone, signaling a shift in sentiment back to bullish.
However, if the pair fails to hold above the Triangle Support Line, a breakdown could trigger a deeper decline toward 1.1500. For now, I maintain a short-term bullish bias, looking for long opportunities near support with clear confirmation signals.
That's the setup I'm tracking. Thank you for your attention, and always manage your risk.

GOLD (XAU/USD): Bulls Eye $4,125 – Breakout Imminent?Gold dropped to a significant horizontal support level last week.
The price subsequently rebounded from this level, forming a rising triangle pattern on a 4-hour timeframe.
The neckline of this triangle is defined by an intraday horizontal resistance.
Its bullish violation (4H candle close above) can be a nice trigger to buy Gold with a confirmation.
Should this occur, a bullish continuation towards 4125 would be anticipated.
Conversely, a bearish movement and a break below the vertical support level could potentially lead to a further decline in price.

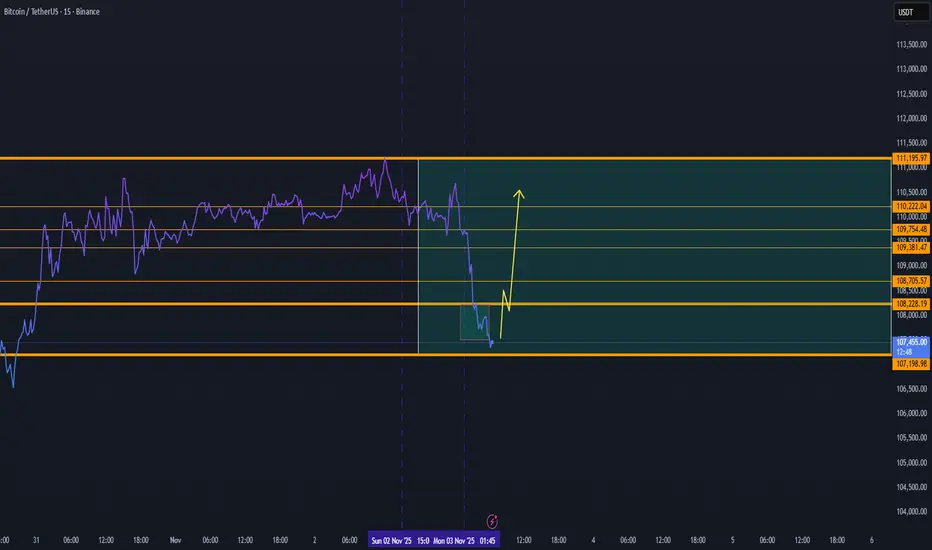
BTC Reversal Momentum — Targeting 110K+ Zone ( DAY VIEW)Bitcoin is showing early signs of a potential short-term reversal after consolidating near the 107K–108K support area. The chart structure indicates a possible recovery wave that could push BTC back toward the 110K+ resistance range in the coming sessions.
Here’s the current structure breakdown:
🟢 Support Zone: 107K remains the key pivot base — holding this area keeps the potential for an upside bounce intact.
📈 Reversal Projection: If momentum builds from the current range, BTC could retest resistance levels at 109.3K → 110.2K → 110.7K.
⚠️ Invalidation: A breakdown below 107K would delay this upward move and reintroduce downside pressure.
Outlook:
Bitcoin is currently stabilizing after a local dip, with buying volume gradually returning. The next impulsive move could drive price action toward 110K+, potentially marking the start of a new short-term uptrend if confirmed by higher lows.
🕒 Summary: As long as BTC maintains structure above 107K, a recovery toward 110K+ remains a strong daily scenario.
Depending on our study BTC can enter a new cycle to 143K in 2025
BTCUSD Rebound Setup: Buyers Target 114K Resistance ZoneHello traders, I want to share with you my opinion about Bitcoin (BTCUSD). Bitcoin continues to move within a well-defined descending channel, forming a consistent pattern of lower highs and lower lows. This confirms that the market remains under bearish control, with sellers actively defending each retest of the resistance line. The Resistance Level at 115,600 has acted as a major cap for bullish attempts, rejecting multiple upside moves over the past few weeks. Recently, BTC retested the Buyer Zone near 108,000–109,000, where strong demand emerged, preventing further downside. This level aligns with both the Support Line of the channel and the horizontal Support Level at 106,400, making it a critical zone for potential bullish reactions. At the current stage, the price is showing early signs of a corrective rebound from the Buyer Zone. I believe this recovery could push the price toward the Seller Zone and Resistance Line, with a short-term target (TP1) around 114,000. However, this move should be viewed as a correction within a broader bearish trend unless BTC manages to break and hold above the 115,600 resistance area. My scenario suggests that BTC could face selling pressure once it reaches the upper boundary of the channel, possibly leading to another bearish leg unless bulls confirm a breakout. Please share this idea with your friends and click Boost 🚀

EURUSD: Growth & Bullish Forecast
Looking at the chart of EURUSD right now we are seeing some interesting price action on the lower timeframes. Thus a local move up seems to be quite likely.
Disclosure: I am part of Trade Nation's Influencer program and receive a monthly fee for using their TradingView charts in my analysis.
❤️ Please, support our work with like & comment! ❤️

NZDUSD Will Go Higher! Buy!
Take a look at our analysis for NZDUSD.
Time Frame: 1h
Current Trend: Bullish
Sentiment: Oversold (based on 7-period RSI)
Forecast: Bullish
The price is testing a key support 0.572.
Current market trend & oversold RSI makes me think that buyers will push the price. I will anticipate a bullish movement at least to 0.575 level.
P.S
Please, note that an oversold/overbought condition can last for a long time, and therefore being oversold/overbought doesn't mean a price rally will come soon, or at all.
Like and subscribe and comment my ideas if you enjoy them!

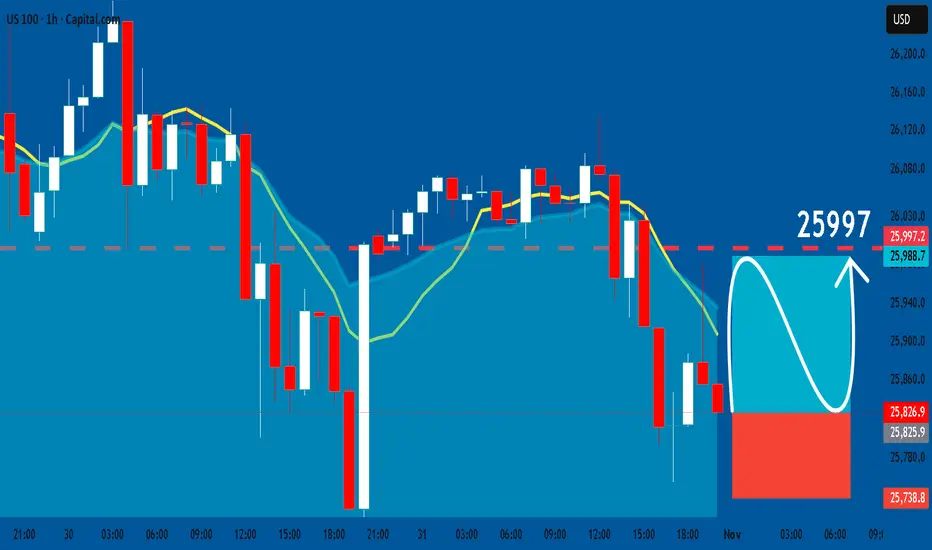
US100: Long Signal Explained
US100
- Classic bullish formation
- Our team expects pullback
SUGGESTED TRADE:
Swing Trade
Long US100
Entry - 25826
Sl - 25738
Tp - 25997
Our Risk - 1%
Start protection of your profits from lower levels
Disclosure: I am part of Trade Nation's Influencer program and receive a monthly fee for using their TradingView charts in my analysis.
❤️ Please, support our work with like & comment! ❤️
BTCUSD The Target Is UP! BUY!
My dear subscribers,
This is my opinion on the BTCUSD next move:
The instrument tests an important psychological level 10983
Bias -Bullish
Technical Indicators: Supper Trend gives a precise Bullish signal, while Pivot Point HL predicts price changes and potential reversals in the market.
Target - 11133
About Used Indicators:
On the subsequent day, trading above the pivot point is thought to indicate ongoing bullish sentiment, while trading below the pivot point indicates bearish sentiment.
Disclosure: I am part of Trade Nation's Influencer program and receive a monthly fee for using their TradingView charts in my analysis.
———————————
WISH YOU ALL LUCK

EURCAD Sellers In Panic! BUY!
My dear followers,
I analysed this chart on EURCAD and concluded the following:
The market is trading on 1.6164 pivot level.
Bias - Bullish
Technical Indicators: Both Super Trend & Pivot HL indicate a highly probable Bullish continuation.
Target - 1.6180
Safe Stop Loss - 1.6154
About Used Indicators:
A super-trend indicator is plotted on either above or below the closing price to signal a buy or sell. The indicator changes color, based on whether or not you should be buying. If the super-trend indicator moves below the closing price, the indicator turns green, and it signals an entry point or points to buy.
Disclosure: I am part of Trade Nation's Influencer program and receive a monthly fee for using their TradingView charts in my analysis.
———————————
WISH YOU ALL LUCK

EURUSD Massive Long! BUY!
My dear friends,
My technical analysis for EURUSD is below:
The market is trading on 1.1536 pivot level.
Bias - Bullish
Technical Indicators: Both Super Trend & Pivot HL indicate a highly probable Bullish continuation.
Target - 1.1577
About Used Indicators:
A pivot point is a technical analysis indicator, or calculations, used to determine the overall trend of the market over different time frames.
Disclosure: I am part of Trade Nation's Influencer program and receive a monthly fee for using their TradingView charts in my analysis.
———————————
WISH YOU ALL LUCK
