[AUD/CAD] Market Analysis: Macro + Structure [MaB]1. The Macro Context (The "Why") 🌍 Hi traders! Before looking at the candles, let's look at the money. My fundamental scoring table speaks clearly: there is a significant differential here that we cannot ignore for the upcoming sessions.
Key Factor Analysis:
🏦 Rate Expectations: The RBA maintains a neutral but relatively high rate at 3.6%, offering a carry advantage. Conversely, the BOC is showing a dovish tilt following their October cut, despite the current pause. Score AUD: +1 Score CAD: -1
🎈 Inflation: Australian inflation remains sticky at 3.4% (above target), while Canadian inflation has cooled to 2.22%, approaching the Bank of Canada's comfort zone. Score AUD: +1 Score CAD: 0
📈 Growth/GDP: Australia is showing resilient growth at 2.3%, outpacing the Canadian GDP of 1.6%. Score AUD: 0 Score CAD: 0
🏭 PMI Data: Both regions show expansionary signals; Australia's weighted PMI is at 51.8, while Canada's Ivey PMI saw a strong jump to 51.9. Score AUD: +1 Score CAD: +1
⚖️ Risk Sentiment: The current market regime is neutral for both cyclical currencies. Score AUD: 0 Score CAD: 0
🗞️ News Catalyst: No major disruptive news for either pair, keeping the focus on structural data. Score AUD: 0 Score CAD: 0
Currency Score Summary: Total Score AUD: +3 (Strong) | Total Score CAD: 0 (Neutral)
Synthesis: With a net differential of +3 in favor of the Aussie, we are looking exclusively for LONG setups. The fundamental divergence suggests that any dip in AUD/CAD should be viewed as a buying opportunity.
2. The Technical Setup (The "Where") 📉 Timeframe: 4H Pair: AUD/CAD
The SMC Market Structure +Zones indicator has confirmed the bullish bias on the 4H chart. Looking at the dashboard, the statistical edge is clear:
🚀 Continuation Rate (67.7%): We are well above the 60% threshold. This indicates a high-probability trending environment where following the established structure is mathematically superior to picking tops.
🔥 Streak (1): We are currently on the first impulse of this sequence, meaning the move is fresh and likely has significant room to run.
🔄 Retest (41.1%): The indicator shows that price retraces into the previous zone only 41.1% of the time. This suggests we should look for entries at the top of the demand zone to avoid being left behind.
💥 BOS/Ret Rate (61.3%): Once price reaches our zone, there is a 61.3% probability of a successful reaction resulting in a new Break of Structure (BOS).
🎯 Extension Rate (1.85x): The algorithm projects an extension of 1.85 times the current pullback leg, giving us a very clear and ambitious target for our Take Profit.
3. Execution Plan on Chart Moving to the chart, the indicator supports us in pinpointing liquidity to define entry and stop loss:
Entry and Stop Loss: We are placing a limit entry at the top of the Demand Zone (Blue Band) . The stop loss is tucked safely below the structural low of the zone. Take Profit: We leverage the asset's statistical analysis offered by the Extension Rate and place the target at 1.85x relative to the pullback leg.
Trade Parameters: Entry Price: 0.93589 Stop Loss: 0.93350 Take Profit: 0.94903
⚠️ Disclaimer: This analysis is based on a proprietary algorithm and is shared exclusively for educational and didactic purposes. It does not constitute financial advice or investment solicitation in any way. Trading involves significant risk.
Longsetup

Gold Is Pausing to Build Momentum Before the Next BreakoutXAUUSD is still firmly positioned within a very strong and well-defined uptrend, supported by both fundamental news and technical structure.
From a fundamental perspective, gold continues to benefit from strong safe-haven demand as geopolitical risks and policy uncertainties remain in the background. The U.S. dollar is relatively weaker due to expectations that the Fed will maintain a more dovish stance, while real yields have not risen enough to put meaningful pressure on gold. This creates a solid fundamental base, allowing gold to hold elevated levels without aggressive selling pressure.
On the H4 chart, the bullish structure is very clean. Price is moving within a rising channel, consistently forming higher highs and higher lows. The Ichimoku system is providing clear dynamic support, with price trading well above the cloud, and every pullback finding support around the Kumo or the ascending trendline — confirming that buyers remain in control.
At the moment, the 4,900 area is acting as a key short-term support. As long as price holds above this zone, I favor a scenario where gold continues short-term consolidation to absorb profit-taking, followed by a move higher toward the 5,070 area, with potential for further extension if safe-haven flows remain strong.
Overall, XAUUSD is following the textbook rhythm of a strong uptrend: a sharp advance, shallow pullbacks, consolidation, and continuation.

EURUSD Is Not Weak – Is the Uptrend Still Ahead?The U.S. dollar is relatively weakening as the market gradually returns to expectations of a more dovish Fed in the medium term, while the euro is supported by a risk-on environment and the view that Eurozone economic data is not as bad as previously feared. As a result, EURUSD has been able to hold elevated price levels without showing strong selling pressure, despite continuous news flow.
EURUSD has clearly formed a sequence of Higher Lows and Higher Highs, rebounding strongly from the lows and maintaining price action above the rising trendline. More importantly, the pair is receiving solid support from the Ichimoku system, with price trading above the cloud and each pullback finding support within the Kumo — a clear sign that buyers remain in control of the trend.
The 1.1730 area now serves as a key short-term support. As long as price holds above this zone, I favor a scenario where EURUSD continues a mild consolidation, followed by a move higher toward the 1.1790–1.1800 area, which represents the overhead supply zone and a logical target for the current bullish leg.

Rose - a short-term recovery🐂 LONG – ROSE
On the 15m timeframe, price is consolidating above a strong resistance, signaling accumulation and preparation for a potential breakout. This move is likely a short-term recovery phase within the broader structure. The prevailing downtrend remains the key filter—entry is planned only after a confirmed break above the descending trendline, reducing false-breakout risk.
Momentum and structure align with typical pre-breakout behavior: compression near resistance, reduced volatility, and stabilizing price action. This setup supports a controlled long once confirmation is in place.
🎯 TP: 0.01929
🛡️ SL: 0.01640
📊 RR: 1 : 3.38
Trade thesis: confirmed trend break + resistance hold → short-term recovery with favorable risk–reward.

ASTERUSDT — Descending Trendline Breakout | Long SetupPrice has successfully broken above the descending trendline and is now holding above a key horizontal support, which has flipped into support. This breakout confirms a bullish structure shift.
The marked zone acts as a valid entry area, while the setup remains invalid below 0.6051, which is the clear risk level. As long as price stays above this level, bullish continuation is expected.
The projected move shows a step-by-step bullish push, targeting the 0.6550 liquidity zone, where previous highs are located.
Bias: Bullish
Invalidation: Below 0.6051
Target: 0.6550

BTC/USDT Analysis. Local Long Scenario Remains Valid
Hello everyone! This is the CryptoRobotics trader-analyst team with our daily market update.
Yesterday, Bitcoin swept liquidity below local lows, tested the $88,600–$88,000 (sell-side absorption) zone, and posted a modest bounce.
At the moment, market activity has declined and buyers are not showing strong initiative. This keeps the probability of a repeated false breakdown of the recently formed low near $88,500 on the table. If this scenario plays out, we remain aligned with the previously outlined local long plan and continue to target a move toward the key resistance zone at $92,600–$93,500 (volume anomalies) over the coming days.
If there is no clear buyer reaction near the local low, opening long positions would be unjustified — in that case, downside pressure may extend toward the next support areas.
Buy Zones
$88,600–$88,000 (sell-side absorption)
$86,000–$84,800 (anomalous activity)
$84,000–$82,000 (strong volume anomalies)
Sell Zones
$91,000–$91,700 (untested seller volume)
$92,600–$93,500 (volume anomalies)
$96,000–$97,500 (selling pressure)
$101,000–$104,000 (accumulated volume)
This publication is not financial advice.

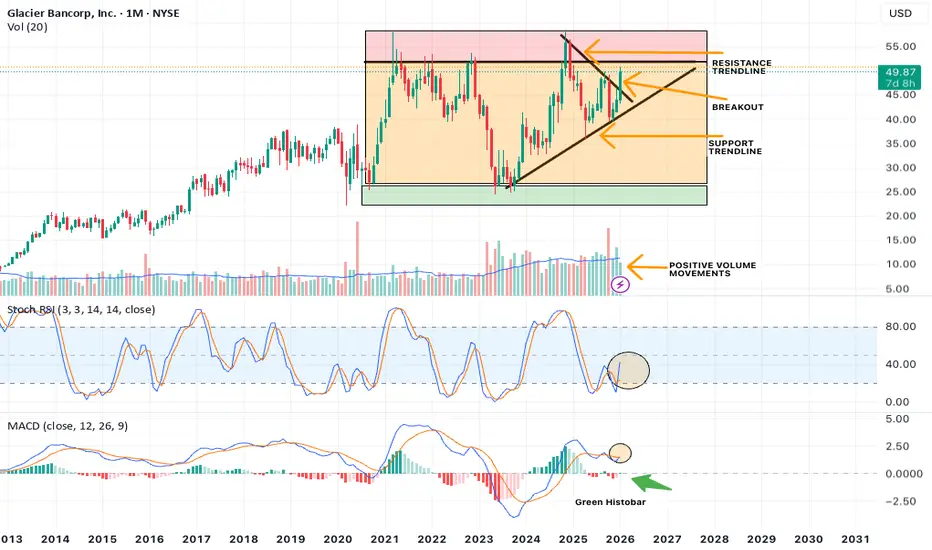
MACRO Bullish Case for GBCI on 1 MonthGlacier Bancorp (GBCI) has some Macro develops that have caught my eye on the 1 Month timeframe.
With the right lower timeframe signals, there may be a trade at some point.
Ill be looking at price action, chart patterns, indicators, candle configurations and more to continue my assessment on this.
NOTE: Being that this initial assessment is on 1 Month, keep in mind we still have 8 days for this month's candle close.
Also being that this is on 1 Month, price movements can showcase strong macro level trends, with potential long duration.
WHY this stock has caught my fancy?
Note price action, we are in a clear uptrend, maintaining the support trendline.
We are also currently breaking out of a Resistance trendline that was responsible for the declines from its top at roughly $58.00.
Though breakout seen, we are still in need of confirmation. Which we maybe able to gauge at in the 1 week.
The candle responsible for breakout is a massive Engulfing Bullish Candle.
We are also getting close to the Resistance Zone depicted by the red rectangle placed. WHich is an extreme Supply zone. It won't be easy to get past this so keep in mind potential push back.
Areas to consider Support test on the Resistance trendline and the Uptrend Support trendline.
Also we may be in a Ascending Triangle Pattern created by Support trendline + Horizontal Resistance.
Other Signs:
VOLUME: Positive Volume Uptrend, will need to see Volume Continue upward especially during breakout through resistance.
MOMENTUM Indicators:
If we maintain current trajectory of indicators at the close of this Months candle, Momentum will be on our side.
With Stoch RSI showcasing Bullish Cross above 20 lvl and MACD attempting to Cross ABOVE 0 lvl with Green histobar print.
All positive signs.
Such developments supports attention and observation on GBCI.
Look to more updates on this.
EURUSD: When the Market Is No Longer Willing to Pay Higher PriceFrom a fundamental perspective, recent headlines have failed to provide meaningful support for the euro. The temporary easing of U.S.–Europe tariff tensions has weakened the “risk-off” environment, removing the need for capital to seek refuge in EUR. In contrast, the U.S. dollar has benefited as market focus shifts back toward U.S. yields and Fed expectations, especially ahead of the upcoming FOMC meeting. This backdrop creates a fundamentally bearish bias for EURUSD.
On the technical side, the picture is quite clear. After a strong upside impulse, price was firmly rejected at the major resistance zone around 1.1740–1.1760 — precisely the area marked as “Strong Resistance”. At this level, buying pressure failed to sustain the rally, and the market began transitioning into a distribution phase.
At present, price is trading inside the Ichimoku cloud, signaling that bullish momentum has clearly weakened. The 1.1700 area is acting as short-term support, but it is a fragile level. Should this zone be broken, EURUSD is highly likely to slide toward the lower support region around 1.1610–1.1550.
Notably, any current upside move is more likely a technical rebound aimed at liquidity creation, rather than the start of a new bullish trend. As long as price remains below the 1.1740 resistance, every rally should be viewed as an opportunity for sellers, not a reason to chase long positions.

Continued growth - gold rises sharply⭐️GOLDEN INFORMATION:
Gold price (XAU/USD) extends the rally to around $4,950 during the early Asian session on Friday. The precious metal gains momentum as geopolitical risk and threats to the US Federal Reserve’s (Fed) independence boost the safe-haven demand.
The yellow metal is set to reach a fresh all-time high and is on track for a weekly gain of more than 7%. Traders flock to traditional safe-haven assets such as Gold after tensions in Venezuela, Iran and Greenland.
⭐️Personal comments NOVA:
Political tensions and tariffs have led to gold's breakthrough, approaching $5000. Strong buying pressure is expected.
⭐️SET UP GOLD PRICE:
🔥SELL GOLD zone: 5000 - 5002 SL 5007
TP1: $4980
TP2: $4965
TP3: $4950
🔥BUY GOLD zone: 4890 - 4888 SL 4883
TP1: $4902
TP2: $4920
TP3: $4935
⭐️Technical analysis:
Based on technical indicators EMA 34, EMA89 and support resistance areas to set up a reasonable BUY order.
⭐️NOTE:
Note: Nova wishes traders to manage their capital well
- take the number of lots that match your capital
- Takeprofit equal to 4-6% of capital account
- Stoplose equal to 2-3% of capital account

TURTLE - Price has broken above a key resistance🐂 LONG – TURTLE
On the 15m timeframe, price has broken above a key resistance, confirming a valid breakout. Strong buying pressure is aligned across 5m, 15m, and 1h, indicating broad participation and momentum continuation. The structure supports further upside, with positioning remaining technically clean.
🎯 TP: 0.06109
🛡️ SL: 0.05381
📊 RR: 1 : 3.68
A solid breakout long: resistance break + multi-timeframe buying → favorable continuation with controlled risk.

Selling pressure - gold corrects to 4713⭐️GOLDEN INFORMATION:
Gold (XAU/USD) is seen extending the previous day's modest pullback from the vicinity of the $4,900 mark, or a fresh all-time peak, and drifting lower through the Asian session on Thursday. This marks the first day of a negative move in the previous four and is sponsored by a combination of negative factors. US President Donald Trump pulled back from his threat to slap additional tariffs on eight European nations and ruled out seizing Greenland by force, triggering a fresh wave of the global risk-on trade and undermining the safe-haven precious metal.
⭐️Personal comments NOVA:
Gold prices correct downwards - accumulating liquidity around 4713 to continue the upward trend.
⭐️SET UP GOLD PRICE:
🔥SELL GOLD zone: 4852 - 4854 SL 4859
TP1: $4840
TP2: $4825
TP3: $4810
🔥BUY GOLD zone: 4714 - 4712 SL 4707
TP1: $4732
TP2: $4745
TP3: $4760
⭐️Technical analysis:
Based on technical indicators EMA 34, EMA89 and support resistance areas to set up a reasonable BUY order.
⭐️NOTE:
Note: Nova wishes traders to manage their capital well
- take the number of lots that match your capital
- Takeprofit equal to 4-6% of capital account
- Stoplose equal to 2-3% of capital account

BTCUSD at a Crossroad: Bounce or Trap?Bitcoin is entering a rather uncomfortable phase for buyers. After the previous bullish cycle, recent macro developments no longer support risk assets. Trade tensions, geopolitical uncertainty, and a renewed defensive mindset are pushing capital away from crypto and toward safer assets. In the absence of any strong catalyst to trigger fresh FOMO, BTCUSD is clearly facing short-term downside pressure.
On the chart, price action tells the story of capital flow quite clearly. Bitcoin continues to form lower highs, signaling a noticeable weakening in buying strength. Price has broken below the Ichimoku cloud, while the forward cloud is starting to slope downward — a classic technical sign that a bearish trend is taking shape. Current rebounds appear more like technical pullbacks than a genuine return of buyers.
The 92,800–93,300 zone is acting as a key resistance area, where the descending trendline converges with the Ichimoku cloud. If price rallies into this region but fails to hold, it would confirm the continuation of the bearish scenario. On the downside, 89,300 stands as the nearest support, but repeated tests have weakened it significantly. The next reasonable downside target lies around 87,650 — a liquidity magnet and a technically important low.

USDJPY Is Neither Weak Nor StrongHello traders, USDJPY is currently moving in a mild bullish to controlled sideways phase , clearly reflecting the tug-of-war between fundamentals and technicals . After a strong rally toward the 159.5–160 zone, price failed to extend higher and instead began to stall, signaling that the market has entered a waiting mode for fresh catalysts . The U.S. dollar lacks strong breakout momentum due to the absence of impactful economic data, while the Japanese yen has yet to recover meaningfully as the BoJ continues to maintain a cautious policy stance.
On the H4 timeframe, the sideways structure is clearly visible . Price is consolidating within a well-defined 157.7 – 158.9 range, where 158.9 acts as short-term resistance with consistent selling pressure, and 157.7 serves as a key support zone supported by the rising trendline and the lower edge of the Ichimoku cloud. The fact that price remains above the cloud indicates that the broader bullish structure is still intact, while the flat cloud and flat Tenkan–Kijun lines confirm an accumulation phase.
From a sentiment perspective , both buyers and sellers remain highly cautious . Buyers are not yet confident enough to push price higher due to intervention risks and a lack of supportive news , while sellers are also hesitant to press aggressively lower as the medium-term bullish trend remains valid . This balance of forces is keeping USDJPY locked in a narrow consolidation range.
In the current environment, USDJPY is not suitable for breakout trading . The more prudent approach is to observe and trade the sideways range, waiting patiently until the market clearly breaks and accepts above 158.9 or below 157.7.

bitcoin In the video, i talk about bitcoin being in the accumulation phase and how my daily bias is still bullish.
Remember we have Expansion-Accumulation-Manipulation-Distribution phase in a market structure and it is crucial that we understand what phase the market is currently on.
Our priority at the moment is to be able to spot the next phase which is manipulation. This usually occur with low volume as price continue to descend out from the accumulation cluster.
So have a look at the chart and trade responsibly.

PayPal Long Trading Fam,
Because I kept my stops fairly tight on my last entry into PYPL, I was stopped out. I was okay with that. However, since that time, I have received two more buy signals with my Pivot Zones indicator. I can't ignore these signals. I have re-entered at a price of $59.53 with a 1:4 rrr. Same target, but the stop is just below that last pivot low rn.
✌️Stew

Buy DellHey Trading Fam,
Pretty simple. My Pivot Zones indicator has given me a "BUY" signal here, and so, I am buying. The technicals do support the indication. You can see, we are very oversold into that orange 350 SMA. Additionally, high-volume trading days have been supporting price moves to the upside. These are very good signs that support another great "BUY" alert from my indicator. The indicator will be released for use once beta testing is completed by the end of February.
✌️Stew

A high-quality long setup🐂 LONG – MON
On the 15m timeframe, price has cleanly broken above the descending trendline, signaling a short-term trend reversal. Buying pressure is clearly confirmed across 5m, 15m, and 1h, showing strong multi-timeframe alignment. Market structure favors continuation, and the current positioning offers an excellent risk profile.
🎯 TP: 0.02296
🛡️ SL: 0.01772
📊 RR: 1 : 7.82
A high-quality long setup: trend break + multi-timeframe buy confirmation → strong upside potential with exceptional risk–reward.

Breaking the High — Doesn’t Always Mean a Real BreakoutIn trading, there’s a moment so familiar it’s almost… painful:
Price breaks the previous high, the candle closes beautifully, volume looks decent.
You hit Buy.
A few minutes later… your stop loss is gone, price reverses and moves exactly in the direction you anticipated — without you on board.
The problem isn’t that you were too slow.
The problem is a hard truth to accept:
Not every break of a high is a real breakout.
1. Breaking the high — what everyone sees
The previous high is where:
Retail traders wait for a breakout
Sell stop losses sit just above
Liquidity is clearly concentrated
The market knows this very well.
And when price approaches the high, its first job isn’t to go far,
but to check whether there’s enough liquidity to take.
2. When a “break” is just a liquidity grab
Many breaks of highs are actually doing just one thing:
Sweeping stop losses
Triggering FOMO Buy orders
Collecting enough liquidity
After that… price reverses.
What you see:
A very strong breakout candle
But no follow-through
Price fails to hold above the broken level
That’s not a random failure.
That’s a familiar market script.
3. A real breakout always has conditions
A reliable break of a high usually has at least one of the following:
A breakout after consolidation, not after a vertical push
Price retests the old high and holds
The break comes with clear market structure (a protected higher low)
Momentum is maintained, no immediate rejection
If there’s only one pretty candle — it’s not enough.
4. Traders don’t lose because they can’t analyze
Most traders lose on breakouts because they:
Focus on one candle and ignore the context
Enter out of fear of missing out (FOMO)
Believe that “if it breaks, it has to run”
While the market operates on a different logic:
Liquidity first — trend later.
5. The most important lesson
Next time you see price break a high, ask yourself:
Is it breaking to continue, or breaking to grab liquidity?
Is price being accepted at higher levels?

AUDUSD – A Tough Challenge for BuyersAUDUSD is moving into a zone where optimism is starting to become dangerous . After the recent rebound, the market shows no clear signs of fresh money stepping in , looking more like a brief “pause for breath” before another corrective move. As the broader macro backdrop continues to lean defensive, risk-sensitive currencies like the AUD are often the first to feel the pressure.
From a news perspective, even though the USD has shown occasional weakness, risk-off sentiment still dominates the market. Trade tensions and global uncertainty are pushing investors to limit exposure to the AUD, while the USD continues to hold its relative safe-haven role . As a result, AUDUSD lacks the momentum needed to sustain a strong short-term rally.
On the H4 chart, price is approaching the strong resistance zone at 0.6750–0.6760 and has started to slow down. Candlestick behavior suggests that buying pressure is no longer aggressive, while the Ichimoku cloud is acting as a natural price ceiling. Without a clear and decisive close above this zone, this move is more likely just a rebound for distribution.
The key scenario to watch is a rejection at resistance, followed by a pullback toward 0.6724, and potentially deeper to 0.6707. These are important support levels, and also areas where the market may attempt to rebalance if selling pressure continues to build.

The current buying pressure on gold is unstoppable.⭐️GOLDEN INFORMATION:
Gold price ( XAU/USD) climbs to near $4,775 during the early Asian trading hours on Wednesday. The precious metal extends the rally and is poised for another record high amid a time of political and economic uncertainty. The speech by US President Donald Trump at the World Economic Forum in Davos, Switzerland, will be in the spotlight later on Wednesday.
Traders continue to pile into safe-haven assets amid tensions between the US and Europe over Greenland. US President Donald Trump over the weekend threatened to impose tariffs on eight European nations that oppose his plans to take control of Greenland.
⭐️Personal comments NOVA:
Incredible growth, gold price reaches 4850. Strong buying pressure in the market. Expect 4900 soon.
⭐️SET UP GOLD PRICE:
🔥SELL GOLD zone: 4905 - 4907 SL 4912
TP1: $4885
TP2: $4870
TP3: $4865
🔥BUY GOLD zone: 4748 - 4746 SL 4741
TP1: $4760
TP2: $4780
TP3: $4803
⭐️Technical analysis:
Based on technical indicators EMA 34, EMA89 and support resistance areas to set up a reasonable BUY order.
⭐️NOTE:
Note: Nova wishes traders to manage their capital well
- take the number of lots that match your capital
- Takeprofit equal to 4-6% of capital account
- Stoplose equal to 2-3% of capital account

XAUUSD – The Bullish Trend Remains DominantHello traders, I observe that XAUUSD is currently in a phase where fundamental news and technical structure are fully aligned in favor of a bullish trend.
On the fundamental side , global risk-off sentiment has intensified after U.S. President Donald Trump proposed new tariffs on eight European countries related to the Greenland issue . This rise in geopolitical and financial uncertainty has driven strong capital flows into safe-haven assets , pushing gold to new record highs and reinforcing its key role in central banks’ reserve strategies.
On the chart, the bullish structure remains clearly intact, with higher lows forming consistently. Price continues to respect the ascending trendline and is well supported by the Ichimoku system. The 4,610 – 4,615 zone stands out as a critical near-term support; as long as price holds above this area, the bullish trend remains valid. The next upside target is projected around 4,730 – 4,735.
👉 In conclusion , as long as global uncertainty persists and safe-haven flows remain active, XAUUSD retains a strong foundation to continue higher, and higher price levels are likely to be tested sooner rather than later.

GBPJPY: Bulls in Full ControlHello traders,
GBPJPY is presenting a clearly bullish picture, where macroeconomic factors and technical structure are working in alignment rather than against each other.
From a fundamental perspective, the Japanese yen continues to face downside pressure following news of a potential early election in Japan and expectations of a more expansionary fiscal policy . This has weakened the yen’s short-term support, despite ongoing speculation about a future BoJ rate hike . Meanwhile, the British pound is trading cautiously ahead of key employment and inflation data, but the current macro backdrop does not pose a clear threat to GBP’s bullish trend.
Technically, GBPJPY remains in a stable uptrend . Price continues to form higher lows and is well supported by the rising trendline below. The 211.9–212.3 zone is acting as a key support area, where price has reacted positively and quickly reclaimed levels above the Ichimoku cloud. This confirms that buying pressure is still in control of the market structure. On the upside, 214.0–214.3 stands as near-term resistance, and a decisive break above this zone could open the door for further upside continuation.
From a price-action perspective, current pullbacks are technical retracements rather than reversals . Buyers remain patiently positioned around support levels, while selling pressure is not strong enough to invalidate the existing bullish structure.

EURUSD – Bullish Recovery Taking ShapeHello traders, I always prioritize scenarios where technical structure and fundamentals are aligned . And at this moment, EURUSD is presenting a fairly “clean” picture for the buy side.
On the fundamental side , political risks and tariff pressure from the U.S. are causing the USD to weaken slightly. As uncertainty increases, capital tends to move away from the USD in the short term, creating room for counterpart currencies like the EUR to recover. This is not a major shock, but it is strong enough to act as a foundational driver for a technical rebound.
On the chart, EURUSD is holding very well above the key support at 1.1615 — a confluence zone between the descending trendline and the Ichimoku equilibrium area. After the previous sharp decline, price reacted positively at this support, forming a higher low compared to the prior one. This signals that selling pressure is fading, while buyers are gradually stepping back in with control.
The most reasonable scenario at this stage is:
As long as price holds above 1.1615, EURUSD has a solid basis to continue higher.
The nearest upside target lies around 1.1660, where key technical resistance converges.
This is the kind of move that is “slow but steady” — not explosive, but sustainable, and very much in line with a market environment where the USD is weakening gradually rather than collapsing sharply.
