Gold price maintains upward trend to 3400⭐️GOLDEN INFORMATION:
Gold (XAU/USD) edged lower during the North American session, pressured by rising U.S. Treasury yields, profit-taking, and reports that President Donald Trump may announce a replacement for Fed Governor Adriana Kugler later this year. The precious metal is trading around $3,372, down 0.23%.
After a three-day rally, bullion struggled to gain further traction as investors locked in profits. This came despite Trump signing an executive order imposing a 25% tariff on India in response to its continued imports of Russian oil. The new duties—set to take effect 21 days after August 7—will raise tariffs on select Indian exports to as much as 50%.
⭐️Personal comments NOVA:
Gold prices continue to increase, heading towards 3400. The context of trade tensions heats up again, along with increasing expectations of interest rate cuts.
⭐️SET UP GOLD PRICE:
🔥SELL GOLD zone: 3429- 3431 SL 3436
TP1: $3418
TP2: $3408
TP3: $3392
🔥BUY GOLD zone: $3332-$3330 SL $3325
TP1: $3342
TP2: $3355
TP3: $3368
⭐️Technical analysis:
Based on technical indicators EMA 34, EMA89 and support resistance areas to set up a reasonable BUY order.
⭐️NOTE:
Note: Nova wishes traders to manage their capital well
- take the number of lots that match your capital
- Takeprofit equal to 4-6% of capital account
- Stoplose equal to 2-3% of capital account
Longsetup

BTCUSDT: The Fuse is Lit | Wedge breakout LoadingThis chart is screaming breakout.
BTC has been coiling inside this falling wedge for weeks and every dip into the demand zone near 110K–112K has been aggressively defended (check those green arrows). Now? Price is pressing hard against wedge resistance right at the top.
This is compression before expansion.
⚡What I'm Watching:
Bullish structure forming: higher lows ✔️
Price reclaiming key levels ✔️
Major breakout zone at 115,800–116,000 coming into play
Break and retest = rocket fuel to 122K and beyond
🎯 My Bullish Targets:
TP1: 122,000 (magnet level)
TP2: 128,328 (next HTF target)
🚨 Invalidation:
A clean break below 112K? I step aside. Until then bullish bias stays on.

OM / USDT : Breaking out from Trendline resistanceOMUSDT has broken above a descending trendline on the 4H timeframe after multiple rejections in recent weeks. This breakout could signal a shift in momentum from bearish to bullish.
If price holds above the breakout level around 0.262, the next potential target lies near 0.31, representing an estimated 19% upside from current levels.
Key points:
Timeframe: 4H
Setup: Descending trendline breakout
Breakout level: ~0.262
Target: ~0.31 (+19%)
Stop loss: Below breakout level to manage risk
As always, wait for confirmation and manage risk appropriately before entering a trade.

Gold Continues to Rise, Breaking ResistanceWeak US jobs data has increased expectations that the Fed will cut interest rates, weakening the USD and bond yields, making gold an attractive safe-haven asset. Gold has reached 3,371 USD, with US gold futures at 3,425 USD. Gold is currently facing resistance at 3,450 USD, and if broken, it could continue towards 3,500 USD.
The XAUUSD chart is moving within a clear uptrend channel with higher highs and higher lows. Gold has surpassed key support levels, including the Fair Value Gap (FVG), indicating strong buying momentum. The market is now testing the 3,450 USD resistance. If broken, the next target will be 3,500 USD.
Strategy:
Buy: If price breaks above 3,450 USD, aim for 3,500 USD.
Stop Loss: Place below 3,320 USD to manage risk.

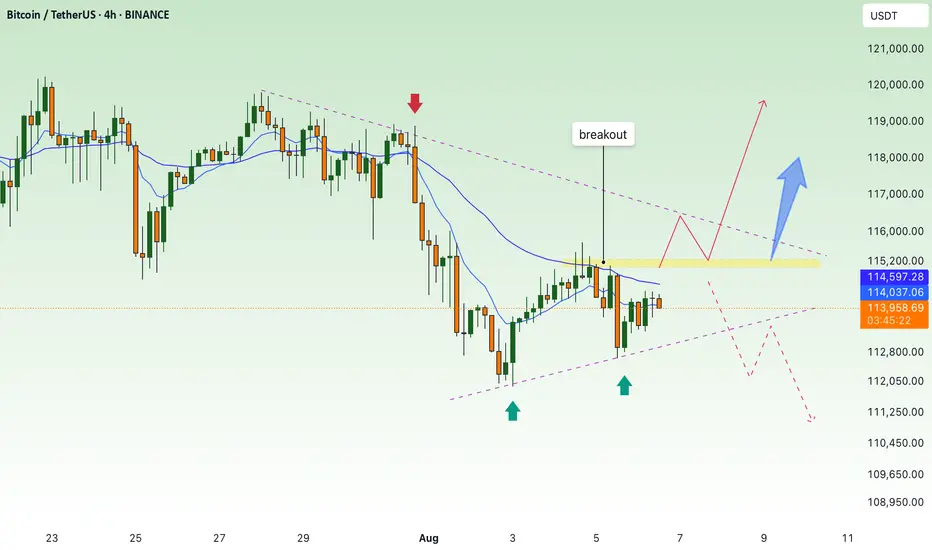
BTC continues to accumulate, waiting for breakout to go up💎 MID-WEEK BTC PLAN UPDATE (06/08)
Brief BTC Analysis – 4H Timeframe:
• Main Trend: Price is consolidating within a descending channel (green diagonal lines).
• Support: The 112,500–113,000 zone has been tested twice and bounced (green arrows).
• Resistance: The 114,800–115,200 zone (purple area) – this is the key level that will determine the next trend.
⸻
Two main scenarios:
🔺 Bullish Scenario (Preferred):
• Price breaks above the 115,200 resistance zone → confirms a breakout from the descending channel.
• Next targets: 116,500 → 119,000.
🔻 Bearish Scenario:
• Price gets rejected at around 115,000 and breaks below the 113,000 support → likely to revisit 110,000.
📌 Key Signals to Watch:
• A clear breakout above 115,200 with volume is a strong buy signal.
• If the price fails to break this zone, consider selling once there is a clear bearish reaction.
XAUUSD: Lining Up for a Long from Daily Support and FVG ZoneGold is setting up nicely for a possible long.
Price already swept the Previous Week Low ( PWL ) and followed it with a clear break of structure to the upside. That move flipped short-term momentum and opened the door for a bullish continuation.
Right now, price is retracing into a fair value gap (FVG) and imbalance zone sitting right above a daily support. That level isn’t just any zone, it’s a former daily resistance now acting as support, and it aligns perfectly with the 50% and 61.8% fib retracement . Solid confluence across the board.
If price taps into that zone and shows bullish intent: wick rejection, strong engulfing candle, or a shift on the lower timeframe , I’ll look to enter long. The main target will be the Previous Week High (PWH), where a nice chunk of liquidity is resting.
No need to rush. Let price come into the zone and do its thing.
-----------------------------------------------------------------------------------------------------------
Trade Idea
Looking to go long if we get confirmation in the imbalance zone
First target is the liquidity above the most recent high
Setup becomes invalid if price breaks below the FVG base

NG FUT long setupNG FUT long setup
Entry - 260.8
Stop loss - 260
Target - 267.4
Risk Reward - 1:11.3

Continue to return above 3400, gold price increases⭐️GOLDEN INFORMATION:
Gold (XAU/USD) slipped slightly during Wednesday’s Asian session, pulling back from a nearly two-week high near $3,390 reached the day before, effectively ending a four-day winning streak. The precious metal came under pressure as Asian equities advanced, tracking a solid rebound in U.S. equity futures—dampening demand for safe-haven assets.
Additionally, a mild uptick in the U.S. Dollar further weighed on gold. However, the downside appears limited, as broader market caution continues to support the metal’s underlying appeal.
⭐️Personal comments NOVA:
Maintain the upward momentum, the same scenario as the beginning of this week. Adjust down in Asian and European sessions and continue to increase in US session. Aim for 3400
⭐️SET UP GOLD PRICE:
🔥SELL GOLD zone: 3428- 3430 SL 3435
TP1: $3418
TP2: $3408
TP3: $3392
🔥BUY GOLD zone: $3331-$3329 SL $3324
TP1: $3340
TP2: $3352
TP3: $3365
⭐️Technical analysis:
Based on technical indicators EMA 34, EMA89 and support resistance areas to set up a reasonable BUY order.
⭐️NOTE:
Note: Nova wishes traders to manage their capital well
- take the number of lots that match your capital
- Takeprofit equal to 4-6% of capital account
- Stoplose equal to 2-3% of capital account

MAGIC / USDT : Bullish breakout alert
MAGIC/USDT has recently broken its descending trendline, signaling potential for a 35 - 50% upside move in the coming weeks. This breakout could lead to significant growth if the bullish momentum continues!
Key Point: A solid retest above the breakout zone will confirm the uptrend, targeting a potential rise of up to 0.25. Stay alert!

XAUUSD breaks out – bullish bias returnsGold has bounced from the bottom of the descending channel, initiating a clear upward move with a series of strong bullish candles. On the H2 chart, price has broken above the upper boundary of the medium-term downtrend channel and filled the nearest fair value gap, signaling a resurgence in buying pressure.
Current price action is approaching a previous resistance zone, aligned with recent swing highs. The chart suggests a potential consolidation before further upside, provided that the current bullish structure remains intact.
From a macro perspective, while the stronger-than-expected U.S. PMI data supports the USD in the short term, weak labor market figures and ongoing global geopolitical tensions continue to fuel demand for gold as a safe-haven asset. This environment is helping sustain XAUUSD’s current recovery structure.

BTC accumulates, slightly adjusts down💎 BTC PLAN UPDATE – START OF THE WEEK (04/08)
🔍 1. Current Technical Structure
Price Pattern: The chart shows BTC is forming a falling wedge pattern, with converging support and resistance lines.
False Break: There was a false break below the strong support zone around ~112,000, followed by a sharp rebound. This indicates buyers are actively defending this level, showing potential buying pressure.
Fibonacci Retracement: From the recent low to high, the 0.5 (115,559) and 0.618 (116,361) Fibonacci levels are acting as key resistance zones.
Key Price Levels:
• Strong support: 111,800 – 112,300
• Near resistance: 115,500 – 116,500
• Next resistance: downtrend line and previous high around 118,000 – 119,000
🔄 2. Possible Trend Scenarios
✅ Main scenario (bullish):
BTC made a false break below the wedge → rebounded toward Fibonacci resistance → potential:
• Continue rising to the 115,500 – 116,500 zone
• If it breaks and holds above this zone, BTC could break out of the wedge pattern and target 118,000 – 120,000
• A longer-term target could be the 1.618 Fibonacci Extension around ~123,159
❌ Alternative scenario (bearish):
If BTC fails to break above 116,000 and gets rejected:
• It may retest the 112,000 support zone again
• A breakdown below this support would bring back the downtrend
🔄 3. Bullish Supporting Factors:
• The false break signals a shakeout of weak sellers.
• A potential inverse head-and-shoulders pattern is forming, supporting a bullish reversal.
• Moving Averages (MA): Price is nearing the 200 MA (red) – a possible bullish crossover with shorter-term MAs may occur, signaling a buy.
🧭 Suggested Trading Strategy
• Safe buy zone: Around 113,500 – 114,000 if there’s a pullback.
• Take profit in stages: 116,500 – 118,000 – 120,000
• Stop-loss: Below 112,000 in case of a confirmed breakdown

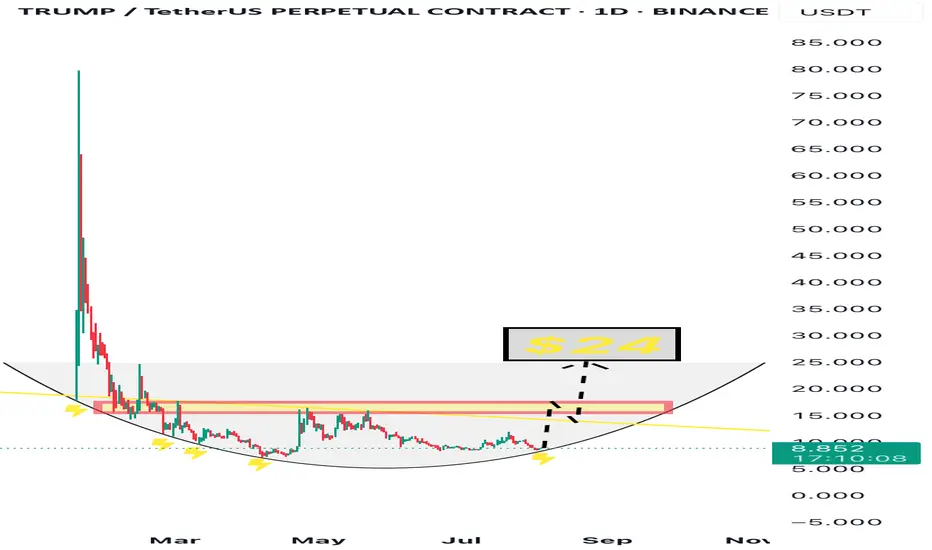
$TRUMP - Rounding Bottom + Strong Narrative We’re currently witnessing a classic rounding bottom formation on the $TRUMP chart.
The price has touched the base 4 separate times, each followed by a bounce — clearly indicating strong support and accumulation.
Now, once again, $TRUMP is testing this base, and structurally the chart suggests a potential breakout toward $24, the top of the cup.
But it’s not just a technical story — the fundamentals are stronger than ever:
• 🎲 A Trump-themed Monopoly game has been officially confirmed by Bill Zanker and the project’s team
• 💸 Justin Sun has publicly announced he will purchase $100 million worth of $TRUMP tokens
• 🛡 Eric Trump revealed that $TRUMP will be added to WLFI’s strategic reserves
This is no longer just speculation — it’s momentum backed by real players.
All eyes on the $24 breakout.
SOPH / USDT :Broke out from trendline resistance SOPH/USDT Breakout Watch
SOPH/USDT has just broken the trendline resistance and is showing strong bullish potential. With a successful retest, we could see a 13 - 15% rise soon!
Key Point: Keep an eye on the retest for confirmation. A solid hold will trigger a strong upward move. Be ready for the breakout!

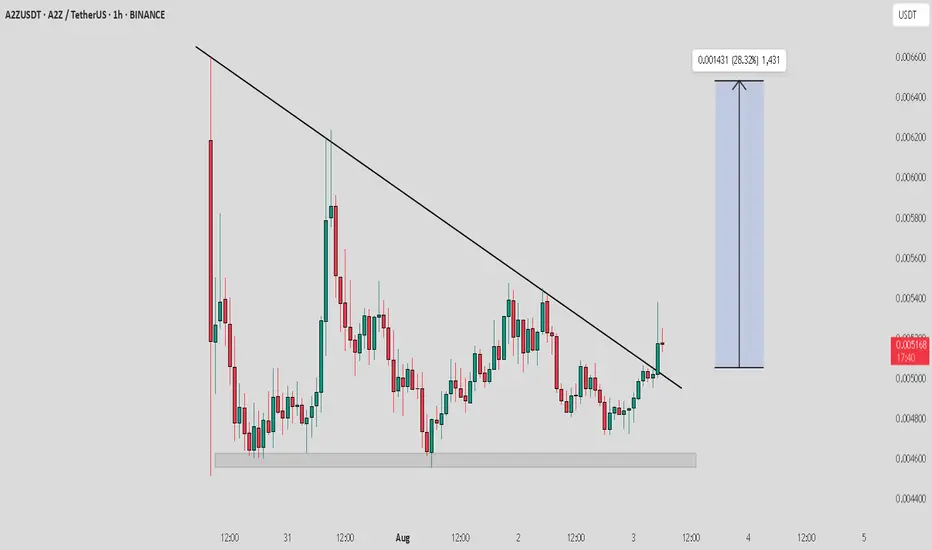
A2Z / USDT : Keep a close watch on retest proccessA2Z/USDT has broken out of a key trendline resistance and is now retesting the breakout zone.
This retest phase is critical — a successful hold here could trigger a sharp bullish move of 20-30% in the short term.
Volume confirmation and strong bullish candle on lower timeframes will add more confidence.
Keep it on your radar — next move could be quick.
NZDJPY Long Setup: Institutional Flow Signals Upside to 89.690🗓 Seasonal Outlook
- JPY Seasonal Weakness: Historical trends show July and August tend to be bearish months for the Japanese Yen, reinforcing weakness across JPY pairs.
- NZD Seasonal Strength: July typically supports bullish momentum for NZD, while August may present challenges. However, strength in NZD versus relative JPY softness suggests continued upside potential into early August.
💼 Institutional Positioning (COT Analysis)
- JPY: Commercial traders remain net short, suggesting expectations of further depreciation.
- NZD: Also shows commercial net shorts, yet the price structure aligns more with bullish continuation, hinting at speculative flow favoring NZD upside.
🧠 Technical Analysis
- Liquidity Dynamics:
- Price has cleared multiple buy-side liquidity levels near prior swing highs.
- Sell-side zones continue to hold, indicating strong bullish intent and failed bearish follow-through.
- Market Structure:
- Higher lows and sustained bullish reactions post-liquidity sweeps reinforce an upward trajectory.
- Current structure suggests accumulation and breakout patterns toward the proposed target.
🎯 Target Projection: 89.690

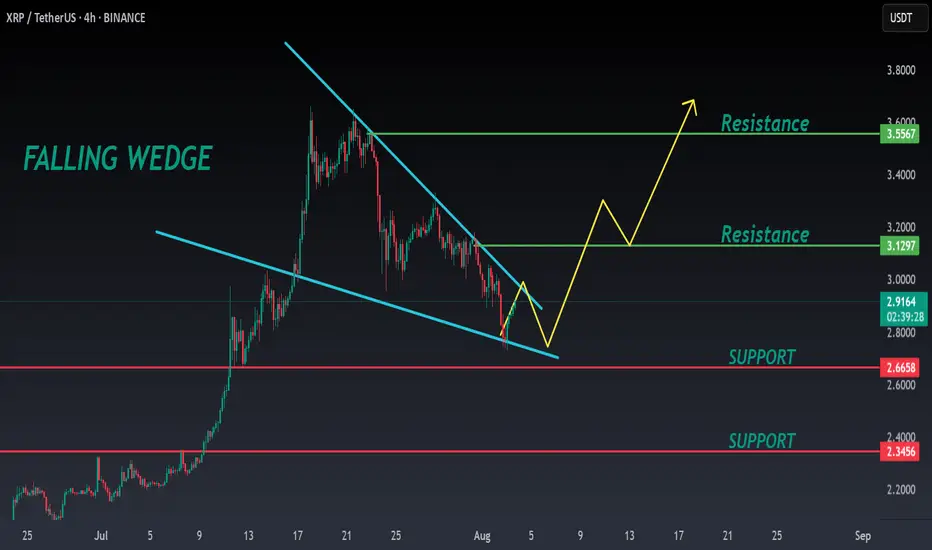
XRP ANALYSIS🔮 #XRP Analysis - Update 🚀🚀
💲 We can see that there is a formation of Falling Wedge Wedge Pattern in #XRP and we can see a bullish movement after a good breakout. Before that we would see a little retest and and then a bullish movement.
💸Current Price -- $2.9130
📈Target Price -- $3.1290
⁉️ What to do?
- We have marked crucial levels in the chart . We can trade according to the chart and make some profits. 🚀💸
#XRP #Cryptocurrency #Breakout #DYOR
SAHARA ANALYSIS🔮 #SAHARA Analysis 💰💰
📊 #SAHARA is making perfect and huge rounding bottom pattern in daily time frame, indicating a potential bullish move. If #SAHARA retests little bit and breakout the pattern with high volume then we will get a bullish move📈
🔖 Current Price: $0.1043
⏳ Target Price: $0.1062 and above
⁉️ What to do?
- We have marked crucial levels in the chart . We can trade according to the chart and make some profits. 🚀💸
#SAHARA #Cryptocurrency #Pump #DYOR


#PENGU #PENGUUSDT #PENGUINS #LONG #AMD #PO3 #Analysis #Eddy#PENGU #PENGUUSDT #PENGUINS #LONG #AMD #PO3 #Setup #Analysis #Eddy
PENGUUSDT.P Scalping Long Setup
This Setup & Analysis is based on a combination of different styles, including the volume style with the ict style. (( AMD SETUP )) "PO3"
Based on your strategy and style, get the necessary confirmations for this scalping setup to enter the trade.
Don't forget risk and capital management.
The entry point are indicated on the chart along with their amounts.
The responsibility for the transaction is yours and I have no responsibility for not observing your risk and capital management.
Note: The price can go much higher than the specified target and have a very good pump.
Be successful and profitable.

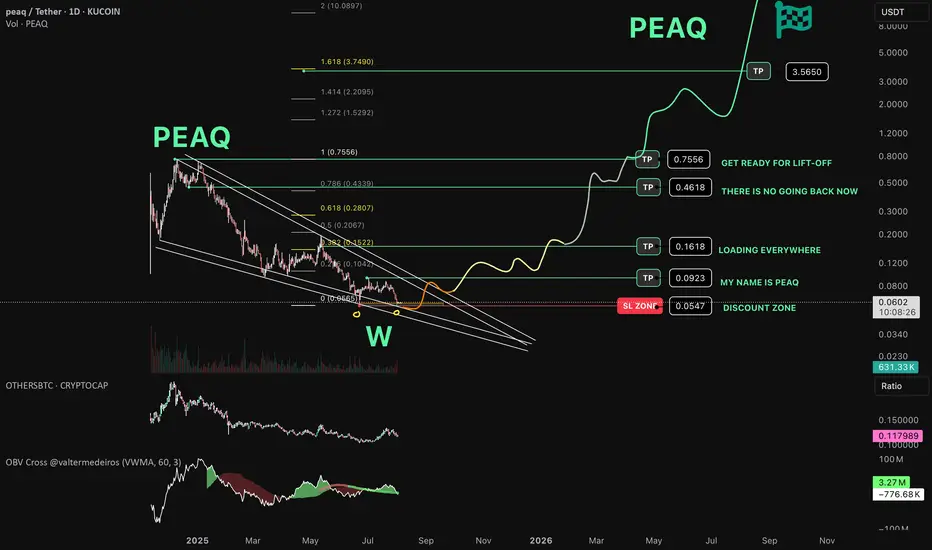
PEAQ Network about to make another pea(q) ? Bottom can be IN!
// ==================================
// ====THE===========================
// ========MACHINE=============^^====
// ===============NEEDS===TALK=======
// ====================TO============
// ==================================
Is this the time?
Chart Recap
🔍 Pattern:
Price formed a falling wedge pattern, which typically signals a potential bullish reversal.
A large W-shaped double bottom pattern is highlighted at the wedge's base, adding strength to the bullish thesis. Can this be the awaited bottom?
🟢 Accumulation & Support Zone :
"DISCOUNT ZONE" is marked near $0.0547, aligned with the wedge support.
Repeated touches at this level suggest strong buyer interest — also called "MY NAME IS PEAQ" and "LOADING EVERYWHERE"
🚀 Bullish Scenario & Targets:
If the wedge breakout plays out:
TP1: $0.0923 – early target near the local range high.
TP2: $0.1618 – aligns with the 0.382 Fib level.
Labeled as “LOADING EVERYWHERE”
TP3: $0.4618 – near the 0.618 retracement.
“THERE IS NO GOING BACK NOW”
TP4: $0.7556 – previous swing high.
“GET READY FOR LIFT-OFF”
TP5: $3.5650 – long-term Fib extension target (1.618).
Ultimate moonshot-level target.

Continued recovery, positive after NFP news✍️ NOVA hello everyone, Let's comment on gold price next week from 08/04/2025 - 08/8/2025
⭐️GOLDEN INFORMATION:
Gold prices surged over 1.5% on Friday, climbing toward $3,350, as a weaker-than-expected U.S. Nonfarm Payrolls (NFP) report signaled a faster-than-anticipated slowdown in the labor market. Heightened geopolitical tensions between the U.S. and Russia further boosted safe-haven demand for the precious metal.
Following the disappointing July jobs data, markets began pricing in a potential interest rate cut by the Federal Reserve. While the Unemployment Rate held relatively steady, signs of labor market softness supported recent comments from Fed officials Michelle Bowman and Christopher Waller, who advocated for a 25-basis-point rate cut at the July 29–30 meeting.
Additional data added to the cautious sentiment: the ISM’s July report confirmed that U.S. manufacturing activity remains in contraction territory, while consumer confidence took a hit, according to the University of Michigan’s latest survey.
⭐️Personal comments NOVA:
Gold prices continue to be positively affected after last week's NFP news, market expectations of an early rate cut are rising
🔥 Technically:
Based on the resistance and support areas of the gold price according to the H4 frame, NOVA identifies the important key areas as follows:
Resistance: $3384, $3434
Support: $3331, $3307, $3268
🔥 NOTE:
Note: Nova wishes traders to manage their capital well
- take the number of lots that match your capital
- Takeprofit equal to 4-6% of capital account
- Stoplose equal to 2-3% of capital account
- The winner is the one who sticks with the market the longest

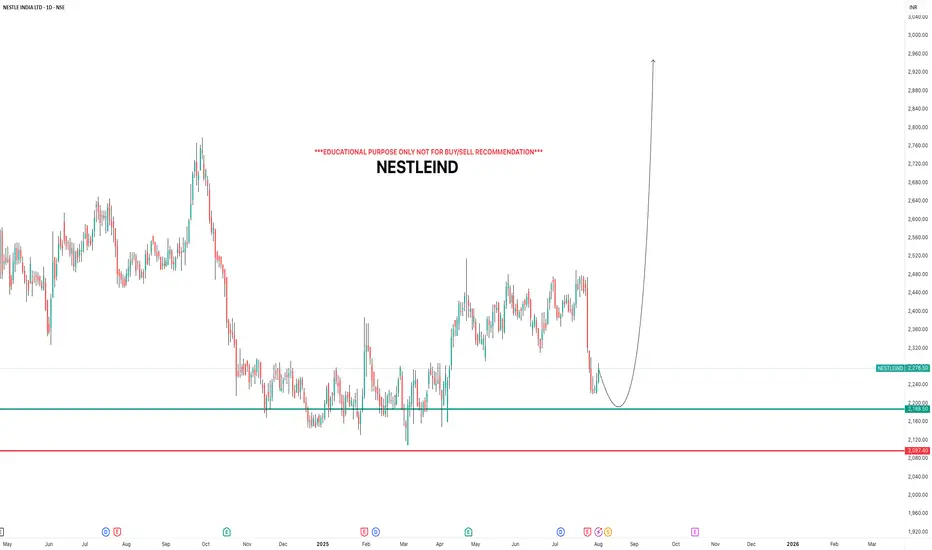
NESTLEINDIAi Observed these Levels based on Price Action and Demand & Supply which is my own Concept "PENDAM CONCEPTS"... Please don't take any trades based on this chart/post... Because this chart is for educational purpose only not for Buy or Sell Recommendation... Thank Q