M3 (2413) — Wave 4 Completion and Long-Term StructureM3 (2413) — A Decade-Long Correction May Have Ended | The Architecture of a Potential Supercycle Wave 5
This study examines M3 (TSE:2413) through a deep-time structural lens, highlighting what may be the most technically significant inflection point in the stock’s modern history. By contextualizing the price evolution since 2005 within an Elliott Wave framework, this analysis aims to illuminate the broader architecture that could guide the next multi-year phase.
🔹 Why This Moment Matters
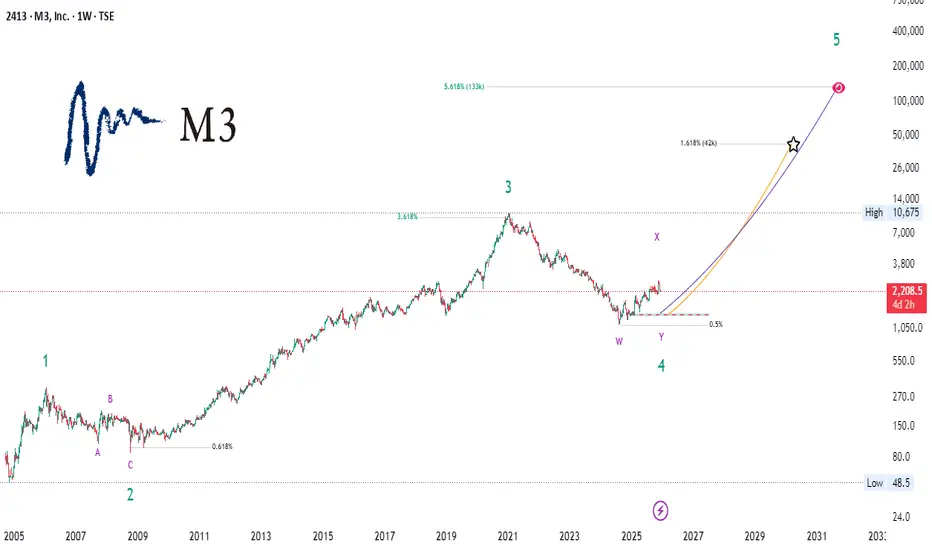
For nearly a decade, M3 has been navigating an extended W–X–Y corrective structure following its major Wave 3 peak. This was no ordinary pause—it was one of the longest and most complex retracements ever recorded in this symbol.
Despite its depth, the correction respected the higher-timeframe trend impeccably:
Termination at the 0.5–0.618 Fibonacci cluster
Structure consistent with a completed higher-degree Wave 4
Price stabilization occurring precisely where long-term cycles often reset
Such convergence across timeframes is rare and often meaningful.
🔹 A Framework for What Comes Next
If Wave 4 has indeed completed, M3 may be entering the foundational phase of Supercycle Wave 5 , historically the most structurally powerful leg in an established growth trend.
This chart outlines two macro trajectories:
Primary Path (Institutional Scenario)
A measured, sustainable advance toward the 1.618 Fibonacci extension , aligning with classical Wave 5 proportion and long-term market symmetry.
Extended Path (Innovation Cycle Scenario)
A more ambitious arc projecting into the 3.618–5.618 zone , reflecting behavior seen in past secular expansion phases—particularly in companies whose growth reaccelerates after prolonged consolidation.
Both paths are illustrated with curvature rather than straight-line projections to better represent the non-linear acceleration patterns commonly observed in late-cycle impulsive structures.
🔹 What the Chart Shows
The completed W–X–Y pattern marking the Wave 4 trough
A multi-year prior impulse (Wave 3) whose Fibonacci relationships remain intact
Historical highs and structural inflection zones for orientation
Two potential long-term trajectories, color-coded for clarity
A convergence of geometry, momentum stabilization, and structural completion—all aligning at the current price region
This confluence forms a compelling technical environment rarely seen on high-timeframe charts.
🔹 Strategic Perspective
This analysis does not make deterministic predictions.
Instead, it provides a macro-structural framework for institutions, portfolio strategists, and long-horizon investors seeking to understand where M3 may be positioned within its secular growth cycle.
Episodes of prolonged corrective unwinding often precede decisive shifts in trend character. If this framework proves correct, M3 may be transitioning from one of its largest consolidations into one of its most expansionary cycles.
🔹 Final Note
This chart is for educational and analytical purposes only.
It does not constitute financial advice.
If you found this useful, feel free to comment with your interpretation of the Wave 4 structure.
Longtermanalysis
TCS – Momentum Shifting Upwards?1. Key Zones
Demand Zone: ₹2,850 – ₹3,000
Supply Zone: ₹3,600 – ₹3,720
2. Structure
Price has bounced strongly from the major weekly demand zone.
The descending trendline is broken, indicating a potential shift in momentum.
Price is now retesting the breakout zone for support.
3. Possible Move
If buyers hold above the ₹3,000–₹3,100 region:
→ Upside targets: ₹3,450 → ₹3,600 → ₹3,720
If price loses the ₹2,850–₹3,000 demand zone, weakness can resume.
4. Summary
TCS is showing early signs of a trend reversal after breaking the falling trendline.
Holding above the retest zone may lead to a push toward the upper supply area.
⚠️ Disclaimer
This analysis is for educational purposes only and not financial advice. Always do your own research and manage risk.

E2E Networks : Future Multi-Bagger in Data Center IndustryE2E Networks is currently moving inside a large symmetrical triangle on the weekly chart, indicating a phase of long-term consolidation before a potential major move.
🔹 Support Trendline : The lower trendline has been respected multiple times since mid-2023
🔹 Resistance Line : Price is repeatedly getting rejected from the upper descending trendline
🔹 Key Buying Zone : Around ₹2,280 – ₹2,300, which aligns with the long-term support trendline
🔹 Volume : Noticeable spikes during pullbacks, showing active participation on dips
As long as the price holds the ascending support line, this zone can offer a favorable risk–reward setup for long-term investors. A breakout above the upper trendline may trigger the next strong uptrend.
📌 Not financial advice. Do your own analysis before investing.

Cybertech - long term investment idea - latest update Cybertech - long term investment idea - latest update. More details on the chart.

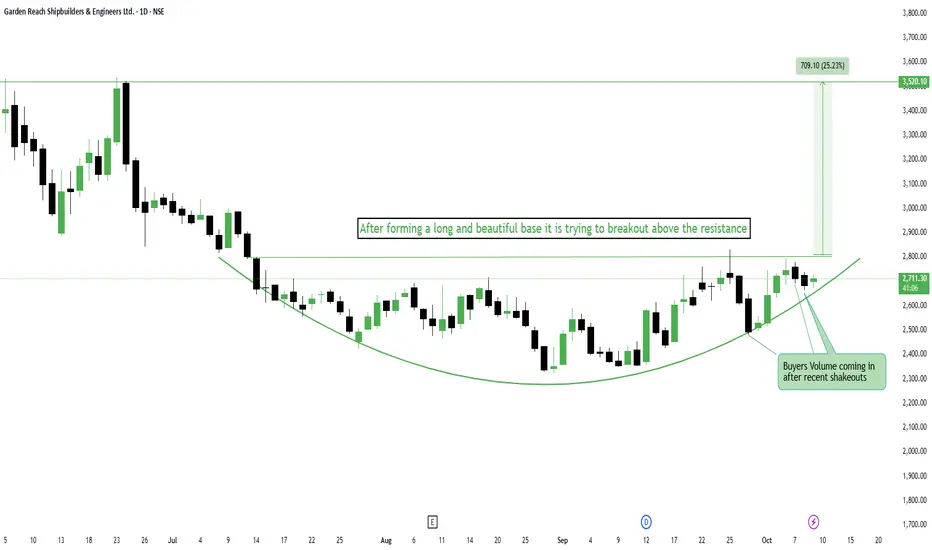
GRSE - Base Formation Turning into Breakout SetupGarden Reach Shipbuilders & Engineers Ltd – Base Formation Turning into Breakout Setup
NSE:GRSE
📈Pattern & Setup:
GRSE has been quietly forming a classic rounding base pattern over the past few months, absorbing every shakeout phase (as marked on the chart). Each dip found buyers stepping in, creating a smooth U-shaped recovery — a strong sign of accumulation.
Now, the stock is attempting to break out of its neckline resistance near 2750 after multiple retests. This zone has acted as a wall for months, but the recent surge in buying volume right after the last shakeout hints that strong hands are taking control.
If price sustains above this neckline, the breakout can easily trigger a sharp rally toward 3500+ in the medium term.
📝 Trade Plan:
Entry: Above 2760–2780 for confirmation of breakout.
🚩Stop-Loss: 2600 (below trendline and last shakeout low).
🎯Targets:
Target 1 → 3100 (initial move).
Target 2 → 3520 (pattern completion, ~25% potential).
💡Pyramiding Strategy:
1. Enter first lot on breakout above 2780.
2. Add more once the stock sustains above 2850 with volume confirmation.
3. Trail stop-loss to 2670 after price crosses 2950.
🧠Logic Behind Selecting this Trade:
The combination of shakeouts, rising demand volume, and a well-rounded base indicates that the stock is in late-stage accumulation. Breakouts from such long bases tend to deliver strong, sustainable upside moves.
This is a textbook case of "volume follow-through after consolidation", which often marks the beginning of a fresh uptrend.
Keep Learning. Keep Earning.
Let’s grow together 📚🎯
🔴Disclaimer:
This analysis is for educational purposes only. Not a buy/sell recommendation. Please consult your financial advisor before taking trades.
October 05, Forex Outlook: Key Moves to Watch This Week!Welcome back, traders!
In today’s video, we’ll be conducting a Forex Weekly Outlook, analyzing multiple currency pairs from a top-down perspective—starting from the higher timeframes and working our way down to the lower timeframes.
Our focus will be on identifying high-probability price action scenarios using clear market structure, institutional order flow, and key confirmation levels. This detailed breakdown is designed to give you a strategic edge and help you navigate this week’s trading opportunities with confidence.
📊 What to Expect in This Video:
1. Higher timeframe trend analysis
2. Key zones of interest and potential setups
3. High-precision confirmations on lower timeframes
4. Institutional insight into where price is likely to go next
Stay tuned, take notes, and be sure to like, comment, and subscribe so you don’t miss future trading insights!
Have a great week ahead, God bless you!
The Architect 🏛️📉

Gold price increase - towards 3825⭐️GOLDEN INFORMATION:
Gold (XAU/USD) hovers near $3,800 in Monday’s Asian session, supported by in-line US inflation data that reinforced expectations of further Fed rate cuts this year. Geopolitical uncertainty also underpins safe-haven demand, though upcoming remarks from several Fed officials could sway the Dollar and limit gains for bullion.
⭐️Personal comments NOVA:
continue to rise - above 3790 and hit 3825 resistance today
⭐️SET UP GOLD PRICE:
🔥SELL GOLD zone: 3825- 3827 SL 3832
TP1: $3817
TP2: $3808
TP3: $3792
🔥BUY GOLD zone: $3759-$3757 SL $3752
TP1: $3770
TP2: $3780
TP3: $3790
⭐️Technical analysis:
Based on technical indicators EMA 34, EMA89 and support resistance areas to set up a reasonable BUY order.
⭐️NOTE:
Note: Nova wishes traders to manage their capital well
- take the number of lots that match your capital
- Takeprofit equal to 4-6% of capital account
- Stoplose equal to 2-3% of capital account

Deepak Nitrite - Long-term supportPrice action: Trading ~45% below all-time high → indicates long-term weakness, but also potential value zone if support holds.
Support levels:
Same zone was tested in July 2022, Feb 2023, and again in Feb 2025.
Multiple tests of the same support increase its significance—but repeated retests without strong bounces can weaken it.
RSI (Monthly): Around 40 → in the “watch zone.” This shows potential for reversal if buyers step in.
200 MA: Trading below the 200-day moving average → structurally bearish trend in the medium-to-long term.
🔎 Interpretation
Bullish case:
If this support holds again, a bounce could lead to a relief rally (short to medium term).
RSI at 40 suggests downside is limited compared to when RSI was much higher.
Bearish case:
Multiple retests of the same support often precede a breakdown.
Trading below 200 MA means the broader trend is still down.
If it decisively breaks this support zone, the next leg lower could be sharp.
⚖️ Strategy Thoughts (not financial advice)
Aggressive traders: Can consider accumulating near support with strict stop-loss just below it.
Conservative traders: Wait for confirmation → either a strong bounce with volume from support, or a reclaim of the 200 MA.
Investors: Might prefer to see consolidation and stability before entering, since RSI is not yet oversold.
✅ Key levels to watch:
Support zone: The level tested in Jul ‘22 / Feb ‘23 / Feb ‘25 (critical to hold).
Resistance: 200 MA (any move above with volume = trend reversal signal).

USDJPY: Bearish Momentum Builds After H4 Structure Shift!Greetings Traders,
In today’s analysis of USDJPY, we observe that the prevailing institutional order flow remains bearish, positioning us to focus on high-probability selling opportunities aligned with downside liquidity objectives.
Key Observations on H4:
Weekly Bearish Order Block Reaction: Price recently reacted to a weekly bearish order block, causing an H4 market structure shift (MSS) to the downside. This confirms that the H4 order flow is now in alignment with the higher timeframe bearish bias, with the weekly order block acting as a strong institutional resistance zone.
Liquidity Dynamics: Recent price action saw sell-side liquidity swept (external range liquidity), followed by a pullback into an H4 fair value gap (FVG), representing internal range liquidity. This reinforces the expectation that the H4 FVG may hold as a firm resistance zone.
Trading Plan:
Entry Strategy: Seek confirmation-based entries on the lower timeframes (M15 and below) within the H4 FVG to refine risk and validate the bearish continuation.
Target Objective: Focus on discount-side liquidity pools, consistent with institutional objectives to rebalance price and capture liquidity resting below.
The main liquidity draw is towards the weekly liquidity pool- which is our long term draw on liquidity.
Remain patient, allow the market to confirm your bias, and execute with disciplined risk management.
Kind regards,
The Architect 🏛️📉

Technical & Historical Key TakeawaysThis chart analyzes the historical price cycles of Gold (XAU/USD) over the past decades, focusing on the alternation between long bull runs and prolonged bear markets.
You highlighted clear phases:
1970 - 1980: 10-year Bull Run
Massive price rally, followed by a sharp correction.
1980 - 2001: 20-year Bear Market
Prolonged sideways and downward movement.
2001 - 2011: 10-year Bull Run
Strong upward trend, reaching new all-time highs.
2011 - 2016: 5-year Bear Market
Significant correction but shorter in duration.
2016 - 2025: 10-year Bull Run
Another strong bullish phase, possibly ending in May 2025.
🔮 Scenarios projected:
Scenario 1 (Blue path):
A shorter bear market (5 years) similar to 2011-2016 correction, then continuation of the long-term uptrend.
Scenario 2 (Yellow path):
Gold enters a long-term 20-year bear market, similar to what happened post-1980.
You are asking if Gold is now entering a short bear phase (Scenario 1) or will fall into a multi-decade bear market (Scenario 2).
Cyclicality of Gold:
Gold has shown repetitive cycles of 10-year bull runs followed by either short (5-year) or long (20-year) bear markets.
These cycles seem to reflect macroeconomic shifts (inflation, interest rates, global crises).
Current Cycle (2016 - 2025):
If we respect the pattern, May 2025 might mark the end of the current bull cycle, opening the door to a corrective phase.
Scenario 1 favors a soft correction:
Based on the last cycle (2011-2016), a 5-year bear market might occur.
This would keep the long-term bullish trend alive, especially if macroeconomic conditions stay inflationary or geopolitical risks remain high.
Scenario 2 warns of a harsh bear market:
If history repeats the 1980-2001 phase, gold could enter a multi-decade bear market, driven by reduced inflation fears, strong dollar cycles, or financial system stability.
Key Indicators to watch:
Real interest rates.
USD strength vs global currencies.
Demand from central banks and emerging markets.
Geopolitical tensions and inflation expectations.

XRP Breakout Watch — Are You Positioned for the Move?#XRP is still respecting the 150-day falling wedge structure.
Price is pushing toward the upper resistance with rising momentum.
If the breakout confirms, a strong move could be ahead.
Watching closely for confirmation.
Retweet if you're ready.
#Altseason2025

$ALT Breaks 136-Day Resistance — Big Rally Loading?#ALT has officially broken above the 136-day-long resistance.
Price is now consolidating above the breakout zone, showing strength.
If momentum continues, a major rally could be ahead.
Watching closely for confirmation of the next move.
NASDAQ:ALT BINANCE:ALTUSDT

Why Invest in CONMED Corp (CNMD)?Why Invest in CONMED Corp (CNMD)?
Strong Earnings Growth – CONMED has experienced a remarkable increase in earnings, with EPS surging by 104% year-over-year and net income rising by 105% YoY. This indicates strong financial performance and profitability momentum.
Attractive Valuation – The stock is currently trading at a P/E ratio of 13.79, which is significantly lower than its historical averages. This suggests that CNMD may be undervalued relative to its past performance and industry peers.
Consistent Revenue Growth – The company reported revenue of $1.31 billion for the last year, marking a 5% increase compared to the previous period. This steady growth highlights CNMD’s ability to expand its market presence.
Improving Margins and Efficiency – CONMED has seen an increase in operating income (+66% YoY), operating margin (+58% YoY), and return on assets (+104% YoY), demonstrating better cost management and operational efficiency.
Dividend and Low Payout Ratio – The company pays a dividend of $0.80 per share, yielding approximately 1.35%, with a conservative payout ratio of 18.6%. This allows room for future dividend increases while maintaining financial flexibility.
Healthcare Sector Stability – As a medical technology company specializing in surgical devices, CONMED operates in a defensive sector that tends to be resilient during economic downturns. This provides investors with a level of stability.
Solid Balance Sheet and Liquidity – The company has a current ratio of 2.3, indicating strong short-term liquidity. Additionally, its quick ratio of 0.94 suggests it can cover its immediate liabilities effectively.
Final Thoughts:
CONMED presents a compelling investment case due to its strong earnings growth, attractive valuation, improving profitability, and stable position in the healthcare sector. However, potential investors should always consider market conditions and individual risk tolerance before making investment decisions.

Reasons to Invest in CVS Health (CVS)Reasons to Invest in CVS Health (CVS)
Strong Market Position
CVS Health is a leading healthcare company with a diversified business model, including retail pharmacies, insurance, and healthcare services. Its extensive network provides a competitive advantage.
Attractive Valuation
CVS is currently trading at a P/E ratio of approximately 12.23, which is lower than its historical average of 17.55. This suggests the stock may be undervalued compared to its long-term performance【41】.
Consistent Free Cash Flow (FCF)
The company generates significant free cash flow, which allows it to invest in growth, reduce debt, and return capital to shareholders.
Dividend and Shareholder Returns
CVS has a stable dividend policy with a payout ratio that allows for sustainable growth while reinvesting in the business【40】.
Resilient Business Model
The healthcare industry is defensive, meaning CVS can perform well even in economic downturns. The company benefits from consistent demand for prescriptions and healthcare services.
Future Growth Potential
CVS is expanding its healthcare services through acquisitions and technology-driven solutions. Investments in Medicare, pharmacy benefits, and digital health are expected to drive long-term growth.
Would you like a deeper fundamental comparison between CVS and its competitors?

Bitcoin's 2025 Price Action Mirrors 2017 - Is History Repeating?Bitcoin Halving & The Trump Factor: A Historical Parallel
Bitcoin's price action in 2025 is eerily reminiscent of the post-halving rally of 2017. In both cases, BTC saw a prolonged accumulation phase before a massive markup period. What's even more intriguing is how macro-political events align: Trump was elected in November 2016 , just before BTC went parabolic in 2017, and once again, he's elected in November 2024 , right before Bitcoin enters its explosive post-halving markup phase. Could this be more than just coincidence?
Accumulation Phase Ends – The Markup Begins
From November 9, 2024 , to February 28, 2025 , Bitcoin was in a 107-day accumulation phase . This mirrors previous post-halving cycles, where BTC consolidates in the Green HPR band before entering the next stage. Now, it appears we are entering the Markup Phase, where I expect Bitcoin to rally towards $120K+ in the coming months.
Applying the 2017 Cycle to 2025
The 2017 bull run followed a 59:156:360-day cycle (Accumulation → Markup → Distribution). Using the same ratio and expanding it for 2025, I’ve projected a 107:280:646-day cycle , where:
✅ 107 days Accumulation (Completed!)
📈 280 days Markup (Just Beginning!)
📉 646 days Distribution & Declining (Post-Top Phase)
This fractal projection aligns well with historical price action, reinforcing the likelihood of Bitcoin repeating this structure.
BitBo’s Rainbow Regression Chart Confirms the Setup
Looking at BitBo’s Bitcoin Rainbow Halving Price Regression Chart , BTC briefly dipped into the blue band , just like in 2017’s first wave. However, in both cases, Bitcoin quickly recovered within days and launched into its Markup phase , which is exactly what we’re seeing now!
🔹 Key Takeaway: Bitcoin is following its historic halving cycle patterns, and if history continues to rhyme, the next 280 days could be a wild ride to six-figure BTC prices! 🚀
Don't forget,
Patience is Paramount

NVIDIA The Next long Too Take I cover NVIDIA Range and where I perceive us to gravitate too from the current level . Watch This Before You Buy Nvidia

NZDUSD - LongTerm + MidTerm forecast, Technical AnalysisMonthly TimeFrame:
Weekly TimeFrame:
LongTerm forecast (Monthly Timeframe):
Price is in a Downtrend, But 0.5470 is a Major support.
Considering that this support line has not been broken since 2009, there is a high probability that the price will be rejected and a long-term upward trend will be formed.
But this process will also take years.
MidTerm forecast (Daily Timeframe):
0.57992 is a major resistance, while this level is not broken, the Midterm wave will be downtrend.
We would set buy orders based on Daily-Trading-Opportunities and expect to reach MidTerm targets.
Beginning of entry zone (0.5540)
Ending of entry zone (0.5470)
Take Profits:
0.5664
0.5750
0.5799
0.5863
0.5916
0.6036
0.6118
0.6259
0.6368
__________________________________________________________________
❤️ If you find this helpful and want more FREE forecasts in TradingView,
. . . . . Please show your support back,
. . . . . . . . Hit the 👍 BOOST button,
. . . . . . . . . . . Drop some feedback below in the comment!
🙏 Your Support is appreciated!
Let us know how you see this opportunity and forecast.
Have a successful week,
ForecastCity Support Team

CAD/CHF - Analysis and Forecast for 2025Are you ready to explore one of the most intriguing currency pairs in the forex market? 🌍 In this video, I dive deep into CAD/CHF to uncover the trends, key levels, and potential opportunities that 2025 holds for traders like you! 🕵️♂️💡
🚀 What to Expect:
✅ A detailed analysis of the Canadian Dollar 🇨🇦 vs. Swiss Franc 🇨🇭.
✅ Key drivers shaping the forex market this year, including oil prices 🛢️, monetary policy 📊, and global economic dynamics 🌐.
✅ Entry points, targets 🎯, and risk management tips for smarter trading.
💼 Whether you're a seasoned trader or just starting your journey, this video provides actionable insights to help you make informed decisions. 📊📈
👀 Why CAD/CHF?
The CAD/CHF pair is not just another forex pair—it’s a battleground of two strong economies with unique influences. From Canada’s oil-driven strength 🛢️ to Switzerland’s reputation for stability 🏦, this pair offers volatility and opportunity for those who know how to trade it.
💡 Don't Miss Out!
Watch till the end to see why I entered a buy position and how I plan to capitalize on the upcoming trends. 🎯💰
🌟 Hit the Like Button 👍, Subscribe 🔔, and Join the Discussion in the Comments!
Let’s decode the future of CAD/CHF together! 💬👨💻

CHINA50 // breaking the countertrendAfter a nice wave formed a long trend on the monthly timeframe, the daily and the weekly has come back to print a countertrend.
Now, after 61.8 correction, the daily crossed above the impulse base with waves, so the daily is back (in the minor phase of) the long trend, in sync with the monthly, just breaking the countertrend.
The expansion phase starts above the highest daily breakdown.
———
Stay Patient, Stay Disciplined! 🏄🏼♂️
Your comments, questions, and support are greatly appreciated! 👊🏼
Please check out my video ideas for more explanation.

Long-term Cup & Handle PatternA long-term cup & handle pattern has formed in Nintendo (I have been buying during the "handle" formation). It's not a perfect setup as the top of the "handle" is higher than the high near the end of 2007, although that's in the chart adjusted for dividends. It looks a lot more clear on the chart that's not adjusted for dividends (I will post an update with that). Additionally, the "cup" formation is pretty deep, which likely limits upside from here. Therefore, I think a 50% rise is possible if it can decisively break out above $16 on a monthly closing basis. (This would be a price target in the mid-$20 range; more may be possible, and would be welcomed, but at some point I would have a stop loss in mind and hopefully it would continue to run for a while. I will update this idea if/when that happens.)

Gold Long Term Analysis Dec 1stWe saw another week of volatile movements for Gold. This time, the movement appeared to be influenced by news of Trump's pick for Treasury Secretary and the Ceasefire announced between Israel and Hezbollah. This resulted in a sudden drop in the Gold price at the start of the week before we saw some significant economic news released towards the end of the week.
The announcement of the ceasefire resulted in some some risk-on movement of money as the market viewed this as an easing of tension in at least one geopolitical hotspot. Some sabre rattling from Russia, mean that this was short lived. Whilst the reaction to Trump's nomination of Scott Bessant for Treasury Secretary seemed a little confused given his more muted comments about the use of tariffs and stated desire to reduce the budget deficit. Both of these, on the face of it, would help to ease inflation and make the Fed's job of lowering rates much easier and should have been a support for the Gold price. Towards the end of the week it appears that the market had better parsed the implications of this pick.
On the economic front we had inflation, GDP and labour market numbers broadly come in at expectations along with the FOMC minutes talk of a potential slowing in rate cuts. The probability of a December rate cut increased slightly as yields and the US dollar both dropped.
It is possible that the the observed volatility in Gold prices continues in the short-term leading up to the Fed's interest rate decision in December and the economic implications of Trump's policy statements and cabinet picks continue to be debated.
Looking at the current trend, we have seen periods of sideways movements following an upwards movement in the price and it is likely that we are entering another phase leading up to the innaguration of the president elect. It has been pointed out the the last seven years have seen a rally in Gold prices, but it is unclear whether the conditions are present for an eight. If the Fed chooses to hold off on a rate cut in December, then there's a good chance we won't. I will look at the likely price movement leading into next week in another post.

Gold Long Term Analysis Nov 25The gold price saw a strong rebound last week with the price rising nearly 6%. This saw the gold price respect the upwards trend that has been established over the last year. Uncertainty in the Russia Ukraine conflict provided the main demand for gold last week in the absence of any major economic news as investors looked for a risk hedge.
This movement in gold prices ran counter to increases in the USDX and US treasury yields. The higher yields reflect expectations of better economic conditions leading to a pause (or slowdown) in the pace of monetary policy easing by the Fed and the expected impact of Trump trade policy. With the FOMC minutes, personal consumption and GDP figures coming out later this week we may see some subdued price movement prior to the release of these numbers.
Gold closed last week around a key resistance level that lines up with the 23% fib retracement. We may see gold linger around these levels given recent comments from the Fed reserve over the last week. However a pull back may occur as profits are taken off last week's stellar rise. Hey levels of support are seen around 2693 and 2670.

Bitcoin Fibo and Time- A bit messy graph.
- Some peoples will get it and some not.
- in matter of time and fibo analysis.
- More will BTC take time to go up.
- More BTC price will go higher.
- in simple words, if u compare the 2015 bullrun and 2018 :
- 2015 was 1055 days ( around..)
- 2018 was 820 Days ( excluding the bouble top)
- Nothing much to deduct from that, but 2 scenarios are still possible :
- 100 000$ is not enough (161.8 FIbo), i still persist on that one, so not a scenario imo.
- 150k$ (261.8 Fibo) possible if BTC goes fast. ( same as 2018).
- 200k$ (361.8 fibo ) or 250k$ (423.6 Fibo ) are both possible if BTC goes slow. (same as 2015 )
- i still believe that " more Bitcoin will take time to go up, more the price will go higher "
- Don't forget this is only TA, not FA, not Economic or World Situation.
- Feel free to share with me your view.
Happy Tr4Ding !
