SP500 at end of growth? huge collapse to come? Long term vision When I fit the chart in the Fibonacci sequence, I conclude that it exactly fits in the sequence as how I show it here and as how my experience has learned me that charts behave concerning the Fibonacci sequence.
- The price went up from '0' to 700 points between 1980 and 1996 = Fibonacci 0% to 78,6%
- Than the price went further to 1200 points between 1996 and 2012 = Fibonacci 78,6% to 61,8%
- The growth continues further to 1600 points between 2012 and 2013 = Fibonacci 61,8% to 50%
- The growth continues further to 1900 points between 2013 and 2014 = Fibonacci 50% to 38,2%
- The growth continues further to 2300 points between 2014 and 2017 = Fibonacci 38,2% to 23,6%
- And the price broke 23,6% so it will continue rising till the sequence has ended!! and that is 3000 points!
> What will happen when 3000 points is reached? There are two options:
1: The price keeps on rising. Than potential = 4800 points !
2: The price collabs and retraces. Than potential = to fall back to 2300 / 1900 / 1600 / 1200 / 700
TARGET 1 NOW: 3000 points and take profit. So, short- term is LONG!
THAN WAIT
THAN MAKE A NEW PLAN: LONG OR SHORT for the long- term
Thank you for following and Succes with trading !
Richard from Rich.Exclusive.Trading
Longtermtrading

EOS/BTC in to climb over 150% in the next few months?!?!I've had a very exciting find today... EOS is looking to be a very good long investment over the next few months. If and only if it can hold lower support level then we should be in for a bull market. To further show a trend reversal, Bollinger Bands have been contricting, indicating future volatility. I would start looking at future resistance levels such as 100 or 200 MA for confirmation of this reversal. However, I'm quite confident that this pattern will continue and allow EOS make new highs relative to BTC. I'm excited for what the future holds on EOS!


EURUSD possible fallCurrently price is respecting the 1.1600 zone, however by the next month it is expected to reach to the marked zone of 1450. Keep selling EURUSD.

USDCAD Short daily/weekly trendThis is a perfect opportunity for long trade set ups for short. 4hr candles now starting to support a downward trend to meet "Year 2018 (5) trend line". This is great for long term week traders.

CrudeOil Bullish Structure ConfirmationHere we go again! Crude oil's super mega uptrend looks to continue! Last time we saw a trend like this was 2009, and it's a long time coming after the major declines in 2014.
Quick summary why I'm bullish in the next weeks:
1. Overall bullish trend
2. Consolidate and form a higher low
3. Failed breakout lower, breakout higher
My next target is 75.50, and if we really move then 80 and 90 are still possible. The announcement of OPEC's higher production limits this Friday potentially puts a limit on the overall trend. Higher production with relatively constant demand (I mean we didn't just start needing 600k/day barrels more oil overnight) should weaken price. Will need to see this in the charts before I give it much weight.
So what do you think? Am I crazy to be so bullish? We've already moved so far...will it keep going? Share with me your charts, ideas, and comments! Love to hear other traders opinions!
Peace, love, and sweet bamboo,
tbp
Note: All ideas expressed here are presented solely for learning and educational purposes only. Any gains or losses assumed by trading ideas presented by The Bad Panda are done so at your own risk.


EURJPY Compelling Breakdown ContinuesLast week saw JPY continue to advance adding further weight to the breakdown seen the week before
Price is currently just above resistance turned support at 124.094 and below here we have sloping trendline support the June 17 low (the two intersect, 20th Aug).
Traders not already short EUR / JPY could wait for the aforementioned levels to clear before taking a nice risk/reward entry targeting the next key support level at 114.851 using the overhead support turned resistance as a sensible basis for stop placement
Those already in the trade can use these milestones to add further positions and trail stops

Potential Buy Opportunity on EURCAD & GBPCADwatch the video with full attention and follow the rules. This video can be a very educative as well, because I showed how to take an action on trading by confluenceing several reasons.


USDJPY - Weekly Chart AnalysisPrice Action: Bullish
Pattern: Asymmetrical triangle + break of all EMA’s
Long-Term Momentum: Bullish
Short-Term: Bearish
Bias: Long
Action: After price tests trend resistance it will most likely bounce. Hopefully it will find support where daily resistance is now. Enter a longer term position here.
Comments: Would like to see bullish momentum continue for next couple of days then correct. I think that this will be healthy for many U.S. pairs as they all have very similar price structures.
AUDUSD - Weekly Chart AnalysisPrice is nearing a major area of support. Over the next several days I suspect that weekly support (.737) will be reached. Ideally, I would like to see price continue to move down through this level but there is a high chance that there will be a slight bounce back to the upside before further continuation to the downside. There was not enough long-term bullish momentum to confirm bias from short to long as all EMA’s did not cross. Price only traded above them for some time then reversed. Historically, price has had choppy trading in this area, but if we can confirm long-term bullish movement for the dollar, I don't think that will happen again.

VENBTC 6h chart expecting more to come from VechainAnother of my long term cryptos, VEN has been rising in value and market cap very steady and sometimes really bullish.
I'm expecting them to reach minimum All-time-high somewhere around mid May end of May well before the expected Mainnet launch in end of June.
The recent increase in value and market cap has to do with the recent announcement from the VeChain team confirming that public testing of the Mainnet is on and so far all good. If just testing gives this response, what will launch of the real thing do?
Why VEN is a long term bag for me? Well, business to business ecosystem more precisely read below:
"VeChain is the world’s leading blockchain platform offering Blockchain-as-a-Service to enterprises for products and information By leveraging on blockchain technology, VeChain strives to build a trust-free and distributed business ecosystem, which is self-circulating and scalable. Through effective collaborations, enterprises can enjoy the benefits of transparency and value flows at high-speed rates VeChain has evolved with multiple technical iterations and have amassed significant industrial experience in rolling out real-world applications since 2015."
- www.vechain.com
1. Big ascending triangle from a pretty long point of view
2. Expecting a downtrend to 0,236
3. Assuming a big support near the 0,236 fib
4. Trying to combine big range triangle with short range Fibonacci retracement since I usually work in 6 or 4 hour chart. I want to get a long term and short term point of view in this chart.


EUR/USD ( idea #5 )Long-Term players be adviced that EUR/USD will hit 1.2798
The Analysis was done by 3:33 am.
Place your Bets.
#LONGTERM


Could be a good option for last 40th days.In my opinion could be a very good option for last 40th days.
The market cap is brand new, the volume increase throwing is a good thing.
Portuguese:
Na minha opinião, poderia ser uma ótima opção nos últimos 40 dias.
O limite de mercado é novo, o lançamento de aumento de volume é bom.

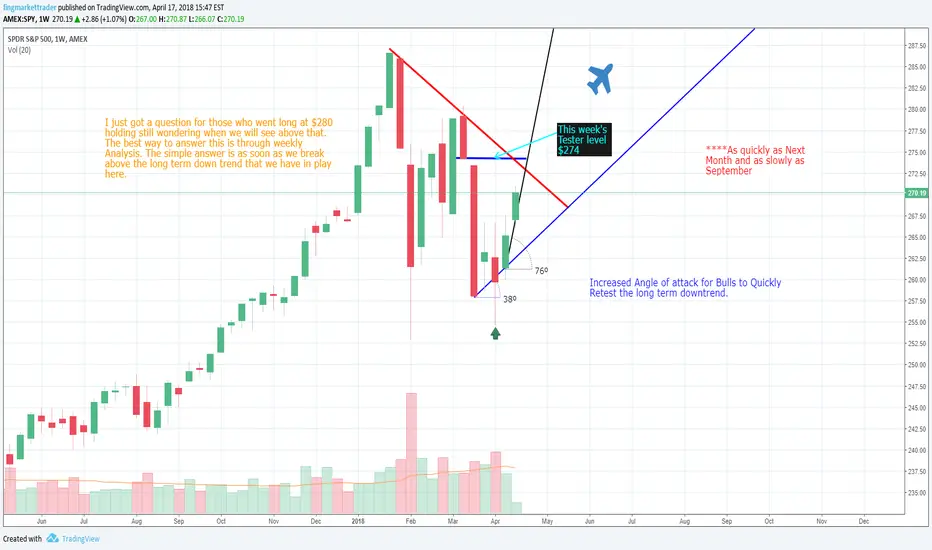
SPY Chart 2018 Weekly Outlook I put this chart together to help our Longer term investors who are wondering when the heck we are going to get back to All time highs. the Path of Least resistance would be to recapture ATH's between Mid May-September.
eBoost (EBST) Goes to Moon !! Want to Know Why ???BITTREX:EBSTBTC is a coin, which is almost more than 10x low from the all time high.
In Past the prices jump from this Long Accumulation Zones.
Touches 19685 Satoshi in the month Jan 2018,
then this coin dump very badly. Now it is almost in the zones in which the price jumps from here..
It has retraced almost 100% & Holding at Strong Support..
So we can except minimum 3x-5x in Long Term..
*****If You Like My Ideas,then hit the like button & Follow me for Latest Updates..******
Wishing You Success,
Happy Trading.
***This information is not a recommendation to buy or sell. It is to be used for educational purposes only.***
" Be Happy, Be Disciplined & Keep Smiling "

USDJPY- Long Term Clear UptrendFor all the swing traders out there who tend to keep their trades for a long period of time, keep a note that the previous resistance is now acting like a support as we can see that the support was broken on September 2014 and then the price retested it several times From May to November 2016. But failed to break the new found support. On the long term perspective this is a clear uptrend on the Monthly Time Frame.
Happy Trading... :)
