Us/Usdt.pBINANCE:USUSDT.P
** BMV:US / USDT (Perpetual)**
🔴 **Key Resistance** at **0.00779** and **0.00963**
🟢 **Immediate Support Zone** between **0.00713 – 0.00702**
🆘 **Major Support** at **0.00681**
📉 Price is **consolidating near lows after a strong sell-off**, showing short-term indecision.
🎯 A **confirmed breakout above 0.00779** could open the path toward **0.00963 → 0.01043**
⚠️ If **0.00702 fails**, price may slide toward **0.00681** quickly.
⚡ **Quick Take:**
* Bearish structure still intact 🐻
* Consolidation at demand zone ⏸️
* Direction depends on **support hold or breakdown 🔓**
* Wait for **volume confirmation 📊** before entering
**Disclaimer:** *For educational purposes only 📚 — not financial advice 💡. Always do your own research and manage risk ⚠️.*
Lovetrading

Bullish Analysis GOLD-15M (SMC)🔍 Current trade status
✔️ TP1 hit (4,336)
✔️ TP2 hit (4,348)
✔️ Partial profits secured
✔️ Stop Loss moved to BE (Break Even)
At this stage, the trade is fully protected.
Risk has been removed, and now we let the market do the work while targeting the final objective at 4,365, where buy-side liquidity remains.
The current pullback is normal and healthy after mitigating two targets.
As long as there is no clear bearish CHoCH, the bullish bias remains valid.
GOOD JOB TRADERS 🦾😉☝🏻

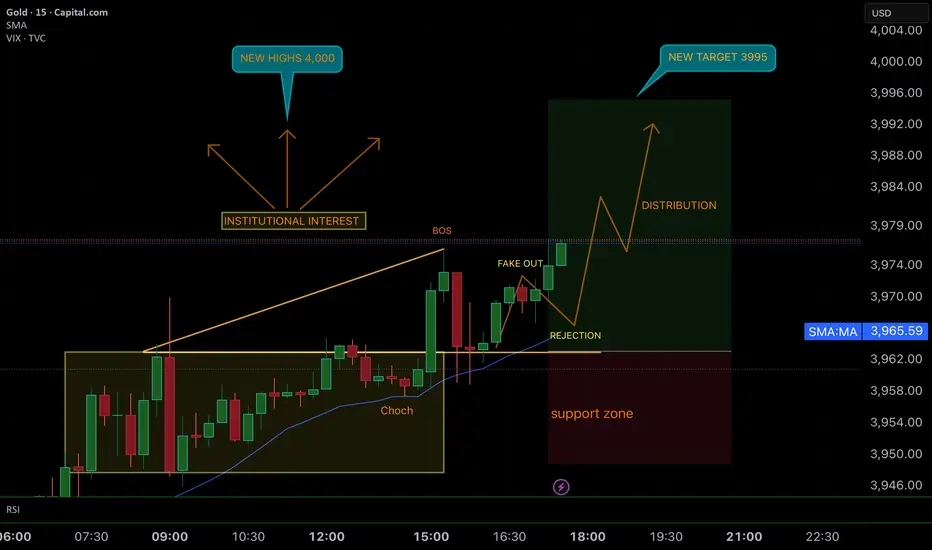
SMART MONEY CONCEPT (SMC)📊 Bullish Analysis on XAU/USD
Context
• The market is showing clear institutional interest after the Change of Character (ChoCh) on the 15M timeframe.
• A Break of Structure (BOS) confirms bullish intent.
• Price created a fake out and is now reacting with a possible rejection from the support zone, signaling continuation to the upside.
Projection
• First target: around 3,995, where we could see partial distribution.
• Second target: potential move toward 4,000 (new historical highs) if buying pressure continues.
• The trade will be monitored during the rejection phase and adjusted if further manipulation or extended accumulation occurs.
Risk Management
• Stop Loss: below the highlighted support zone.
• Risk/Reward Ratio: approximately 1:3, offering an attractive setup with solid risk-to-reward conditions.
📝 Conclusion
This setup reflects strong bullish momentum with clear structure toward new highs. The plan is to secure profits near 3,995 and, if continuation remains intact, extend to the 4,000 mark.
GOOD LUCK TRADERS… ;)
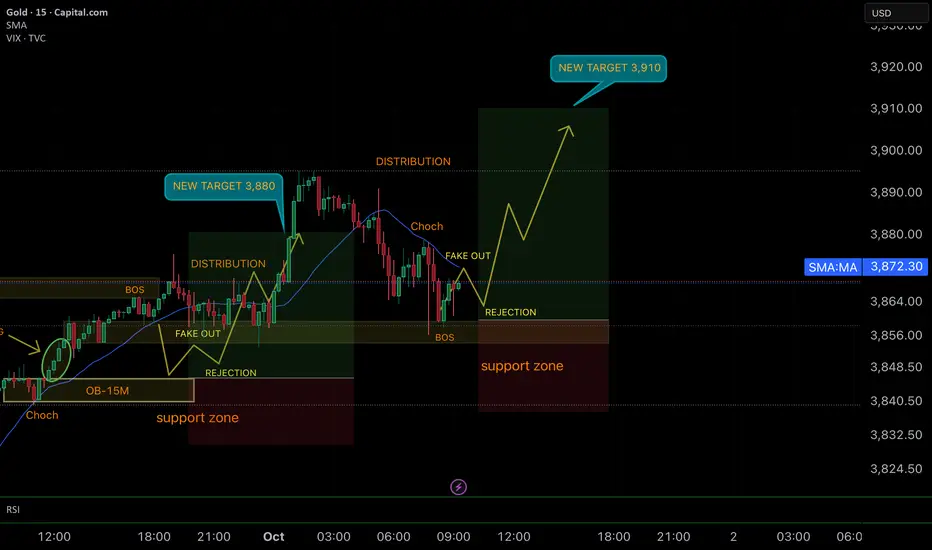
SMART MONEY CONCEPT (SMC)Bullish Analysis – GOLD 15M
✅ Context: After reaching the 3,880 target, price retraced into a distribution phase and created a ChoCh, sweeping liquidity. Now it is defending the support zone with a BOS, confirming bullish intention.
✅ Structure & Validation:
• Potential fake out at support before rejection.
• Clear confluence for a new bullish continuation.
• New target set at 3,910, following the institutional flow logic.
🔑 Conclusion: Market respected key zones and remains aligned with bullish momentum. The plan shows patience, discipline, and a well-structured projection.
GOOD LUCK TRADERS…. ;)
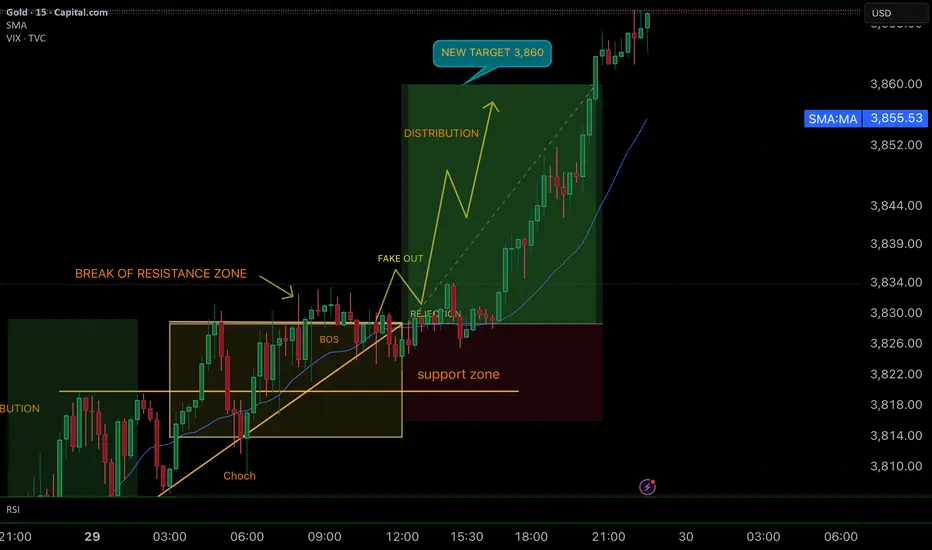
SMART MONEY CONCEPT (SMC)📊 GOLD 15M – Perfect Trade Execution
🔑 What Happened
1. ChoCh + BOS → Confirmed the change of character and break of structure.
2. Break of Resistance Zone → Price broke above the key resistance area with strong bullish pressure.
3. Fake Out + Rejection → Liquidity grab (fake out) followed by rejection validated the entry.
4. Bullish Impulse → Price launched directly toward the 3,860 target, surpassing the projection.
🎯 Result
• Entry: At the rejection after the fake out.
• TP (Take Profit): 3,860 → hit with strength 🚀.
• Momentum: Strong bullish continuation creating new Higher Highs (HH).
GOOD JOB TRADERS….. ;)
📌 SMC Lesson
Patience is key — waiting for confirmation at the rejection after manipulation (fake out) separates a forced trade from a clean institutional setup.
SMART MONEY CONCEPT (SMC)📊 SMC Breakdown – Perfect Bullish Execution on GOLD
🔎 Trade Recap
1. Distribution & Fake Out:
Price distributed at the 15M OB and created a fake out to trap sellers and sweep liquidity.
2. BOS + ChoCh:
After the liquidity grab, the Break of Structure (BOS) confirmed bullish intent, supported by the Change of Character (ChoCh) at the support zone.
3. Rejection & Entry:
Price reacted exactly at the support/rejection zone, providing a clean entry opportunity with minimal risk.
4. Bullish Continuation:
Following the reaction, price pushed upward aggressively, respecting structure and heading straight into the target zone.
🎯 Result
• Entry: At rejection (support + BOS confirmation).
• TP: Target 3,664 ✅
• R:R: About 2:1, clean and efficient trade.
📌 Key Lesson
Patience pays off — by waiting for the fake out, BOS confirmation, and rejection, we secured a high-probability entry and captured liquidity right into the target zone.

Lovesac Bulls Loading: Strike $22.50 Call Opportunity
💖 **LOVE Earnings Alert | 2025-09-10** 💖
**Directional Bias:** Moderate Bullish (65% Confidence) ✅
**Why This Trade?**
* Historical beat rate: 88% over last 8 quarters 📊
* Recent accumulation & positive call OI bias
* Price above 20 & 50 DMA; strong pre-earnings drift
* Weak fundamentals (negative FCF & operating margin) reduce conviction → **moderate bias**
**💡 Trade Recommendation:**
* **Instrument:** LOVE weekly call
* **Strike:** \$22.50 💰
* **Expiry:** 2025-09-19
* **Entry Price (Ask):** \$1.35
* **Direction:** LONG ✅
* **Entry Timing:** Pre-earnings close
* **Position Size:** 1 contract (scale to 1–2% account risk)
**🎯 Targets & Stops:**
* **Profit Target:** \$4.05 (+200%)
* **Partial Profit:** \$2.70 (+100%)
* **Stop Loss:** \$0.675 (-50%)
* **Exit Timing:** Within 2 hours post-earnings or next open
**📈 Key Levels:**
* Support: \$19.00–19.20
* Resistance: \$20.70 intraday / \$21.62 (200-DMA)
**⚡ Key Risks:**
* Weak operating fundamentals → “beat but sell-off” trap
* Low liquidity / micro-cap spreads → slippage
* IV crush / theta decay post-print → exit quickly
* High beta → amplified downside if market turns
**💎 Trade Strategy:**
* Asymmetric risk/reward: limited downside = premium paid, unlimited upside if earnings beat & gap occurs
* Single-leg naked call; tight stops to manage volatility & IV
**📊 JSON Trade Snapshot:**
```json
{
"instrument": "LOVE",
"direction": "call",
"strike": 22.50,
"expiry": "2025-09-19",
"confidence": 0.65,
"profit_target": 4.05,
"stop_loss": 0.675,
"size": 1,
"entry_price": 1.35,
"entry_timing": "pre_earnings_close",
"earnings_date": "2025-09-11",
"earnings_time": "AMC",
"expected_move": 12.0,
"iv_rank": 0.70,
"signal_publish_time": "2025-09-10 15:49:59 UTC-04:00"
}
```
💥 **TL;DR:** Moderate bullish thesis for LOVE earnings. Buy \$22.50 call pre-print, exit fast post-announcement. Tight stops, small size, asymmetric upside — risk defined, potential huge reward.

Launchcoin / UsdtBITGET:LAUNCHCOINUSDT
📊 **Technical Analysis – LAUNCHCOIN/USDT (1H, Bitget):**
* 💰 **Current Price:** \$0.10578
* 🟥 **Major Support Zone:** \$0.09000 – \$0.09800 (gray box)
* 🟩 **Resistance Levels:**
* \$0.11037 → short-term resistance
* \$0.14429 → major breakout target
* \$0.19350 → extended resistance zone
---
### 🔍 **Chart Insights:**
1. **Falling Wedge Formation**
A visible falling wedge (marked by dashed trendlines) typically signals a **potential bullish reversal**. Price is currently near the lower end of the pattern.
2. **Projected Scenarios (Red Arrows):**
* 🔁 **Scenario A:** Retest of the **support zone (\$0.090–\$0.098)** before a possible bounce.
* 🚀 **Scenario B:** Immediate breakout from \$0.110 → rally toward \$0.144 if bulls step in strongly.
3. **Key Confirmation Levels:**
* Holding above \$0.098 = Bullish interest.
* Break and close above \$0.110 = Momentum shift.
* Below \$0.090 = Breakdown risk increases.
---
📌 **Conclusion:**
Market is in a **make-or-break zone**. Structure favors a rebound if buyers protect the demand area, but confirmation via volume or a bullish candle close is crucial.
---
⚠️ **Disclaimer:**
*This analysis is for educational and informational purposes only. It is **not financial advice**. Always conduct your own research and use proper risk management before making any trading decisions.*
LLong

Aurasol/ UsdtWEEX:AURASOLUSDT
AURASOL/USDT is currently trading at **0.10472**, showing a modest gain of **0.44%** on the weekly chart. The price is hovering near a key **resistance level at 0.10501**, which has previously acted as a barrier. If buyers manage to push the price above this level with strong volume, the next major target would be **0.16473**, a significant resistance zone. However, failure to break above **0.10501** could lead to a retest of the immediate **support at 0.10403**, followed by the psychological **0.10000** level. A drop below **0.10000** would signal weakness, potentially driving the price down to the stronger **support at 0.09000**.
The market’s direction will largely depend on whether the price can sustain above the **critical red line support (0.10000)**. Traders should watch for confirmation—either a breakout above **0.10501** with increasing volume or a breakdown below **0.10000**—before taking positions.
As always, proper risk management is essential, and this analysis should be supplemented with your own research.
Disclaimer : Not Financial Advice

BTC/USDTBINANCE:BTCUSDT
CRYPTOCAP:BTC is respecting my levels perfectly 📈 88K target hit ✅
We’ve just tapped into a major resistance zone—so a short-term pullback could be on the table 📉⚠️
#Altcoins might see a bit of cooling off too, but if BTC manages a clean retest around the 85K–85.5K range, that’d be a bullish confirmation 📍
"Disclaimer : Not Financial Advice"

Ice/UsdtOKX:ICEUSDT
**Ice Coin Overview**
- **Market Cap**: $39.5M 📊
This represents the total market value of all Ice Coin in circulation. It’s a key indicator of the asset's size in the crypto market.
- **24h Volume**: $10M 💵
This is the total trading volume in the last 24 hours. A higher volume usually indicates increased interest and activity in the coin, which could lead to price changes.
- **Fully Diluted Valuation (FDV)**: $126.32M 💎
FDV represents the total value of the coin if all tokens were in circulation. It gives a sense of the potential market value based on the total supply.
- **Total Supply**: 2.115B (2.115 billion coins)
This is the maximum number of Ice Coin that will ever exist. The current circulating supply may be smaller, but this is the cap for the coin's supply.
- **Current Price**: $0.005967 💰
This is the current trading price of the Ice Coin in the market. At this price, the coin is relatively low, and small price changes could have a larger percentage impact.
---
### **Resistance and Support Levels Explained**
- **Resistance**: $0.00600 📈
Resistance levels are price points where selling pressure is strong enough to halt the price from going higher. For Ice Coin, **$0.00600** is the immediate resistance level. If the price breaks and holds above this point, it could indicate continued bullish momentum (price moving up).
- **Next Resistance Levels**:
- **$0.0069534** 🚀
- **$0.00700** 🚀
These are the next levels where price could face resistance after breaking the $0.00600 mark. If the price successfully reaches and holds these levels, it indicates strong upward momentum. Traders will likely be watching these points to see if Ice Coin can break through and continue growing.
---
- **Support**: $0.05643 ⚖️ & $0.05500 ⚖️
Support levels are price points where buying pressure is expected to be strong enough to prevent the price from falling lower. If Ice Coin doesn't manage to break through the $0.00600 resistance, it could fall back to these support levels. If the price holds at these points, it may bounce back upward.
- **Next Support Levels**:
- **$0.00500** ⚖️
- **$0.00400** ⚖️
These are critical support levels where the price could find a strong buying interest if it falls below $0.05643. If the price drops below these support levels, it may indicate a bearish trend, and the price could continue to fall.
---
### **What This Means for Traders**
- **Increased Volume**: If trading volume increases, it could signal that more people are interested in buying or selling Ice Coin, which could push the price either upward (bullish) or downward (bearish), depending on how the buying and selling balance out. The volume is a key indicator to watch.
- **Breaking Resistance**: If the price breaks the $0.00600 resistance and holds above it, this would be seen as a bullish signal, meaning the price could keep rising. The next target would be $0.0069534 or $0.00700.
- **Falling Below Support**: If the price can’t hold the support levels at $0.05643 or $0.05500, the next downside targets are at $0.00500 and $0.00400. This would be seen as a bearish trend, and traders would be cautious about the price dropping sharply.
---
**⚠️ Important Note**:
This is **not financial advice**. Cryptocurrency is highly volatile, and prices can change quickly. Always do your own research (DYOR) and consider consulting with a financial advisor before making any trading decisions. 🚫
---
ILong

Fartcoin/UsdtBITGET:FARTCOINUSDT
🚨 **Fartcoin Price Update**:
Currently, **Fartcoin** is holding support at **0.4000** and **0.4764**. These levels are crucial for the price to stay above in order to maintain its momentum. 📉
⏳ **Wait for Retest**:
If you're interested in trading, it might be wise to wait for a **retest** of these support levels. If the price holds at these levels and doesn’t fall through, it could be a good entry point. 📊
🔮 **Future Resistance Levels**:
Once Fartcoin tests and confirms support, we can look out for **resistance levels** to be posted later, similar to how **Degen Coin** behaves. 🚀 These resistance levels will be important to monitor as the price moves upward. 📈
⚠️ **Not Financial Advice**:
Remember, this is not financial advice, just sharing insights. Always do your own research before making any decisions. 💡

Thank You for all your Support and Love! Wow, 1K new friends and 100 ideas posted! I am truly grateful for your incredible support and engagement. This journey has been amazing because of each one of you. Thank you from the bottom of my heart for being part of this wonderful community! 🙏💡❤️
Looking forward to sharing many more ideas together! 🚀

GOOGL we had a breakout, but we didn’t get the strength neededGOOGL: Yes, we had a breakout, but we didn’t get the strength we needed.
We got confirmation that Google exited the yellow channel, which I call "no man's land," but when Google broke out of this channel to the upside, it did so with a candle that wasn’t to my liking.
Double TOP!
After the price tried to go up the first time after the breakout, it made one more attempt to go higher but failed. The price returned to the stagnant channel we had analyzed last week.
The earnings report is approaching. I believe the last two candles give me a lot of hope that Google’s upward run is starting here. However, I would like to confirm on Monday or Tuesday with 1 or 2 bullish candles to confirm that my prediction will indeed take effect.
Even though I'm still bullish on GOOGLE ! Remember, we are very close to the earnings report, which could push Google to glory!
Thank you for supporting my analysis.
Best regards,

Dogs / Usdt BINANCE:DOGSUSDT
Here's a summary of the key price levels and potential movements for the asset "Dogs" based on your information:
### Current Price and Analysis:
- **Current Price:** $0.0014390
- **Support Zone:** $0.001344
- **Resistance Level:** $0.0015543
- **Next Support Level (if breached):** $0.0011434
### Key Points:
1. **Support Zone Analysis:**
- **Current Price vs. Support:** The price has bounced from the $0.001344 support level. If the price holds above this support, it suggests that buying interest is strong and the price could potentially rise.
2. **Resistance Level:**
- **Next Resistance:** $0.0015543. If the price moves up from the support level and reaches this resistance, it might face selling pressure. Watch this level for potential signs of reversal or continuation.
3. **If Support Fails:**
- **Next Support Level:** $0.0011434. If the price falls below the current support level of $0.001344, the next significant support to watch is at $0.0011434. This level could provide another chance for the price to stabilize or reverse direction.
### Summary:
- **If the price holds above $0.001344:** Look for potential upward movement towards the resistance level at $0.0015543.
- **If the price falls below $0.001344:** Monitor the next support level at $0.0011434 for possible stabilization or further declines.
Disclaimer : I am not Financial Adviser

Pre-analysis 1/18/2023some interesting information to be absorbed with CHF,
every day we do these reviews I feel like I am gaining more ground to achieve my ultimate goal.
Trading professionally. Still lots of work to be done but we are getting there.
Risk Disclaimer. Trading foreign exchange on margin carries a high level of risk, and is not suitable for all investors. Past performance is not indicative of future results. The high degree of leverage is dangerous and can work against you as well as for you. Before deciding to invest in foreign exchange or any market you should carefully consider your investment goals, level of experience, and risk tolerance.

XAU/USDBeen in my first trade since Thursday, but the second entry Tp got hit and now we wait on the first entry. If you look price kept tapping into my OB indicating price didn't want to go down anymore. Price also broke out of my grey area zone with a strong push and retested off of my Fib level.

Doge coin ,,,, technical analysis 📈📉It grows to the size of a flag pole....
54% ....🤗
Please buy with your own analysis, I do not accept responsibility

How's About XAUUSD??? where the price will go??let's see on Monday. if the price continues go up the price will be fly but if the price rejected will go down to make a right shoulder.
but i think the price will go down until 1677.
that's my opinion :)
be wise dan luck trade.

ANALYSIS ON EURUSDEURUSD has created a rising channel in a bearish trend. My analysis is, it will continue buying till the resistance level, making its third touch, then may continue its bearish momentum.

Us30 reviews It looks like we going long & breaked the pattern we waiting for proper confirmation for the break out pulled to our first zone now we waiting for confirmation

XU switch clutch Sunday projection was wrong but being confident to change me bias quickly awarded some great outcomes.
I love keeping it simple and trading with an edge.
XU SUNDAY AND MONDAY BANGERS!

XAUSD Sunday markup Price violated weekly and monthly lows but was unable to clearly close below those important lows. Helping me to establish a clear hypothesis of where price could possibly be going next.
There is data that shows price wanting to move in a bullish direction, ending the month of august with a bullish outcome.
there a couple of possibilities to look for during Sunday open, keep your eyes peeled.....Sundays are my favorite trading days haha.
