LPTUSDT About to Break Out or Break Down? Yello Paradisers! Have you been watching LPT sink deeper into the descending channel and wondering if it’s finally time for a reversal or if another trap is about to wipe out impatient traders again? This setup is shaping up to be one of those textbook opportunities where discipline will separate winners from losers.
💎#LPTUSDT has been moving inside a clear descending channel, with price action consistently printing lower lows and respecting both resistance and support lines. However, it has now reached a major inflection point. The asset is sitting right on a strong support zone, a level that has previously attracted demand and triggered significant reactions in the past. What makes this setup even more intriguing is the convergence of technical signals that could be indicating a short-term bullish reversal.
💎On the momentum side, the MACD is flashing a bullish crossover, and we’re also spotting a bullish divergence between the price and momentum. This is often one of the earliest signs of trend exhaustion in a downtrend. These signals become even more meaningful when combined with the current price position within the descending channel structure. If the support holds, and the divergence plays out, we could see a strong rally first into the minor resistance area near $3.00 and potentially into the major resistance zone above $3.10.
💎However, the invalidation level is clearly defined at $2.782. If the price is accepted below this level, the setup is no longer valid, and the idea must be abandoned immediately.
The market is full of noise, and fake breakouts are designed to punish the emotional and reward the disciplined. Be the latter. Stay sharp, Paradisers.
MyCryptoParadise
iFeel the success🌴
LPTUSD

#LPT/USDT It can go up from this zone#LPT
The price is moving in a descending channel on the 1-hour timeframe. It has reached the lower boundary and is heading towards breaking above it, with a retest of the upper boundary expected.
We have a downtrend on the RSI indicator, which has reached near the lower boundary, and an upward rebound is expected.
There is a key support zone in green at 2.85. The price has bounced from this zone multiple times and is expected to bounce again.
We have a trend towards stability above the 100-period moving average, as we are moving close to it, which supports the upward movement.
Entry price: 2.90
First target: 2.99
Second target: 3.077
Third target: 3.18
Stop loss: Below the support zone in green.
Don't forget a simple thing: capital management.
For inquiries, please leave a comment.
Thank you.

#LPT/USDT Forming Falling Wedge#LPT
The price is moving in a descending channel on the 1-hour timeframe. It has reached the lower boundary and is heading towards breaking above it, with a retest of the upper boundary expected.
We have a downtrend on the RSI indicator, which has reached near the lower boundary, and an upward rebound is expected.
There is a key support zone in green at 2.83. The price has bounced from this zone multiple times and is expected to bounce again.
We have a trend towards consolidation above the 100-period moving average, as we are moving close to it, which supports the upward movement.
Entry price: 2.88
First target: 2.92
Second target: 2.97
Third target: 3.05
Don't forget a simple principle: money management.
Place your stop-loss below the support zone in green.
For any questions, please leave a comment.
Thank you.

#LPT/USDT Forming Falling Wedge#LPT
The price is moving in a descending channel on the 1-hour timeframe. It has reached the lower boundary and is heading towards breaking above it, with a retest of the upper boundary expected.
We have a downtrend on the RSI indicator, which has reached near the lower boundary, and an upward rebound is expected.
There is a key support zone in green at 3.40. The price has bounced from this zone multiple times and is expected to bounce again.
We have a trend towards consolidation above the 100-period moving average, as we are moving close to it, which supports the upward movement.
Entry price: 3.47
First target: 3.50
Second target: 3.57
Third target: 3.64
Don't forget a simple principle: money management.
Place your stop-loss below the green support zone.
For any questions, please leave a comment.
Thank you.

$LPT/USDT (Swing)TRADE – $LPT/USDT (Swing)
Type: LONG
Mode: Spot / Futures (Low Leverage)
Entry Zone: 3.40 – 3.70
This zone aligns with the weekly demand area where price has historically reacted and selling pressure is clearly slowing.
Targets:
TP1: 6.00
TP2: 9.20
TP3: 14.80
TP4: 25.50
Stop Loss: 2.65
This level sits below the weekly demand and invalidates the long-term support if broken.
On the 1-week chart, LPT/USDT is in a clear long-term bearish structure that started after the strong rally and distribution phase near the previous highs. Since that peak, price has consistently formed lower highs and lower lows, showing that sellers have remained in control for an extended period. The descending trendline drawn from the top has been respected multiple times, confirming that every major bounce has been sold into rather than accepted as a trend change. As price moved lower, momentum gradually weakened, and the recent decline has brought LPT back into a very important historical support zone around the 3.4–3.6 area. This zone acted as a base in the past and is now being retested after a full cycle of downside movement. On the weekly candles, the bodies are becoming smaller and the wicks are more visible near this level, which shows that selling pressure is no longer as aggressive as before and buyers are starting to absorb supply at this price. Even so, the overall market structure is still bearish because there is no higher high or higher low formed yet, and price is still trading well below the long-term descending resistance. At the same time, the downside momentum appears to be slowing, suggesting that the market may be entering a consolidation or accumulation phase rather than continuing a sharp drop. In summary, LPT is sitting at a major long-term support after a prolonged downtrend, selling strength is weakening, but the weekly trend remains negative until price can break the long-term descending trendline and show a clear structural shift.

LPT Roadmap (3D)From the point where we placed the red arrow on the chart, the LPT correction has started, and it seems to be forming a time-consuming ABC pattern, currently in the early stages of wave C.
It is expected that the price will soon move downward to complete wave C.
The best and lowest-risk investment and buying zone is the green area.
The main targets are marked on the chart.
For risk management, please don't forget stop loss and capital management
When we reach the first target, save some profit and then change the stop to entry
Comment if you have any questions
Thank You

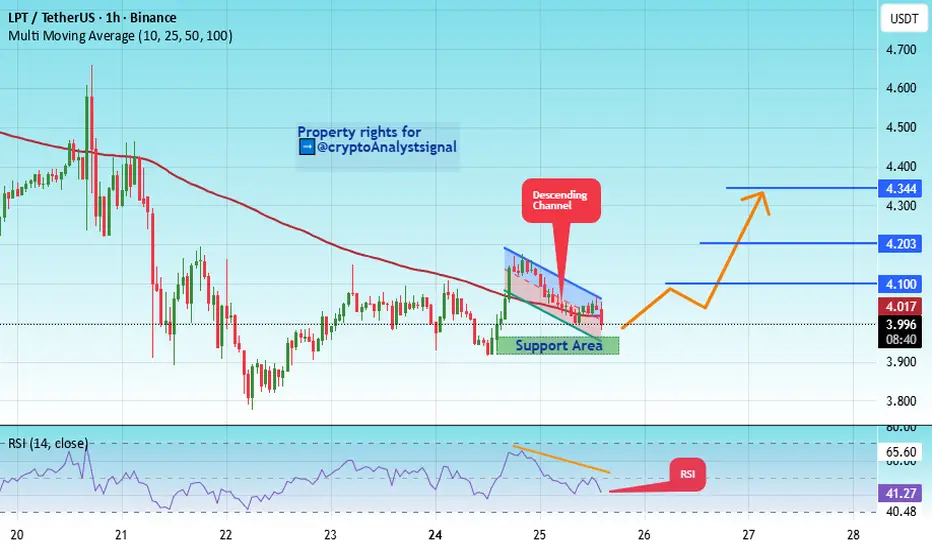
#LPT/USDT Forming Falling Wedge#LPT
The price is moving within an ascending channel on the 1-hour timeframe and is adhering to it well. It is poised to break out strongly and retest the channel.
We have a downtrend line on the RSI indicator that is about to break and retest, which supports the upward move.
There is a key support zone in green at the price of 3.94, representing a strong support point.
We have a trend of consolidation above the 100-period moving average.
Entry price: 3.99
First target: 4.10
Second target: 4.20
Third target: 4.34
Don't forget a simple money management rule:
Place your stop-loss order below the support zone in green.
Once the first target is reached, save some money and then change your stop-loss order to an entry order.
For any questions, please leave a comment.
Thank you.
#LPT/USDT Forming Falling Wedge
#LPT
The price is moving within an ascending channel on the 1-hour timeframe and is adhering to it well. It is poised to break out strongly and retest the channel.
We have a downtrend line on the RSI indicator that is about to break and retest, which supports the upward move.
There is a key support zone in green at the 5.00 price level, representing a strong support point.
We have a trend of consolidation above the 100-period moving average.
Entry price: 5.13
First target: 5.25
Second target: 5.36
Third target: 5.52
Don't forget a simple money management rule:
Place your stop-loss order below the green support zone.
Once you reach the first target, save some money and then change your stop-loss order to an entry order.
For any questions, please leave a comment.
Thank you.

#LPT/USDT It can go up from this zone#LPT
The price is moving within a descending channel on the 1-hour frame and is expected to break and continue upward.
We have a trend to stabilize above the 100 moving average once again.
We have a downtrend on the RSI indicator that supports the upward break.
We have a support area at the lower boundary of the channel at 5.77, acting as strong support from which the price can rebound.
We have a major support area in green that pushed the price higher at 5.40.
Entry price: 6.20
First target: 6.45
Second target: 6.78
Third target: 7.145
To manage risk, don't forget stop loss and capital management.

#LPT/USDT#LPT
The price is moving within a descending channel on the 1-hour frame and is expected to break and continue upward.
We have a trend to stabilize above the 100 moving average once again.
We have a downtrend on the RSI indicator that supports the upward break.
We have a support area at the lower boundary of the channel at 5.77, acting as strong support from which the price can rebound.
We have a major support area in green that pushed the price higher at 5.40.
Entry price: 6.20
First target: 6.45
Second target: 6.78
Third target: 7.145
To manage risk, don't forget stop loss and capital management.
When you reach the first target, save some profits and then change the stop order to an entry order.
For inquiries, please comment.
Thank you.

LPT reversed a 3-month bleed — and I caught the reset candle.This isn’t noise. This is reversal.
LPT just completed a 96-bar, -86% bleed. But price didn’t just stop randomly — it formed a rounded base and exploded straight into a 1D breaker block, clearing internal structure and printing a clean power candle.
Now? Price is retracing.
We’re back into the 1D OB at 8.31 — aligning perfectly with the 0.618 fib retracement of the entire move. This is where price pauses, not reverses. And if Smart Money is still in control, this is where the next leg builds.
Targets are layered:
9.29 (0.5) is the first inefficiency reclaim.
10.28 (0.382) is the emotional level that marks continuation.
13.01 is the liquidity pocket — and the full draw.
This isn’t about whether price “goes up.” It’s about how price delivers.
Execution structure:
🟩 Entry: 8.31–6.91 (discount into 1D OB)
🎯 Target 1: 9.29
🎯 Target 2: 10.28
🎯 Final: 13.01
❌ Invalidation: sustained close below 6.12 (break of intent)
Everyone sees the candle.
Few understand the reclaim behind it.

Livepeer LPT price analysis⁉️ Are you saying that a correction has begun in the cryptocurrency market?
MM #LPT coin disagree with you, and as a result, there has been a +175% increase today.
If the price of OKX:LPTUSDT can be kept above $11.70-12 (similar to a year ago), then the growth can safely continue.
So what do you think is happening now? :
👍 - Capital has started flowing into altcoins, and it will only get more interesting from here on out.
Or
👎- An involuntary news pumping that will soon “crash”?
_____________________
Did you like our analysis? Leave a comment, like, and follow to get more

LPT Buy/Long Setup (4H)With the strong bullish momentum and upward movement, a swap zone has formed on the chart.
The price is gradually pulling back to this level. We can look for a buy/long position around the green zone.
A daily candle close below the invalidation level will invalidate this analysis.
For risk management, please don't forget stop loss and capital management
Comment if you have any questions
Thank You

LPTUSDT 1D Analysis LPT ~ 1D Analysis
#LPT On the verge of a breakout. Buy after successfully breaking this resistance line with a short-term target of at least 10%+ from here.

LPTUSDT 1WLPT ~ 1W Analysis
#LPT Buy when re -testing this support, with a short -term target of at least 20%+.
Reason, This is the lowest support for now.

LPT has a buying opportunity !From the point where we placed the green arrow on the chart, it seems that LPT has entered a diametric pattern.
Wave D appears to have been a triangle that has completed.
If a pullback occurs towards the green zone, it would be a buying opportunity.
A daily candle closing below the invalidation level would invalidate this analysis.
For risk management, please don't forget stop loss and capital management
Comment if you have any questions
Thank You

LPTUSDT Analysis: A Unique Pump Among AltcoinsLPT has been one of the few altcoins to pump from a meaningful level recently, setting it apart from others in the market.
I find it logical to consider buys below the red line , as this aligns with the key demand regions I have identified. Using advanced tools like heatmap , cumulative volume delta (CVD) , and volume footprint , I pinpoint highly accurate zones where buyers are likely to dominate.
Key Points:
Unique Performer: LPT stands out as the only altcoin with a meaningful pump recently.
Red Line Zone: Below this line, buy entries are worth considering.
Techniques Used: Heatmap, CVD, and volume footprint to identify demand regions.
If you'd like to learn how I use these techniques to determine accurate demand regions, just DM me!
If you think this analysis helps you, please don't forget to boost and comment on this. These motivate me to share more insights with you!
I keep my charts clean and simple because I believe clarity leads to better decisions.
My approach is built on years of experience and a solid track record. I don’t claim to know it all, but I’m confident in my ability to spot high-probability setups.
If you would like to learn how to use the heatmap, cumulative volume delta and volume footprint techniques that I use below to determine very accurate demand regions, you can send me a private message. You can find me as XU99Official in every platform.
My Previous Analysis
🐶 DOGEUSDT.P: Next Move
🎨 RENDERUSDT.P: Opportunity of the Month
💎 ETHUSDT.P: Where to Retrace
🟢 BNBUSDT.P: Potential Surge
📊 BTC Dominance: Reaction Zone
🌊 WAVESUSDT.P: Demand Zone Potential
🟣 UNIUSDT.P: Long-Term Trade
🔵 XRPUSDT.P: Entry Zones
🔗 LINKUSDT.P: Follow The River
📈 BTCUSDT.P: Two Key Demand Zones
🟩 POLUSDT: Bullish Momentum
🌟 PENDLEUSDT.P: Where Opportunity Meets Precision
🔥 BTCUSDT.P: Liquidation of Highly Leveraged Longs
🌊 SOLUSDT.P: SOL's Dip - Your Opportunity
🐸 1000PEPEUSDT.P: Prime Bounce Zone Unlocked
🚀 ETHUSDT.P: Set to Explode - Don't Miss This Game Changer
🤖 IQUSDT: Smart Plan
⚡️ PONDUSDT: A Trade Not Taken Is Better Than a Losing One
💼 STMXUSDT: 2 Buying Areas
🐢 TURBOUSDT: Buy Zones and Buyer Presence
🌍 ICPUSDT.P: Massive Upside Potential | Check the Trade Update For Seeing Results
🟠 IDEXUSDT: Spot Buy Area | %26 Profit if You Trade with MSB
📌 USUALUSDT: Buyers Are Active + %70 Profit in Total
I stopped adding to the list because it's kinda tiring to add 5-10 charts in every move but you can check my profile and see that it goes on..

LPTUSDT 1WLPT Update ~ 1W
#LPT Retesting this support line,. if you still have Conviction on the coin,. Buy in increments from here, with a minimum target of 20%+

LPTUSDT 1WLPT ~ 1W
#LPT Do you still have Conviction on this coin? If yes,. This support block would be a good buy spot for now. buy in stages, Target 20%+

LPTUSDTLPT ~ 1W
#LPT This support block for now continues to keep the price from falling any further. Maybe a small purchase here is quite interesting.

LPT long termLPT looks very good if previous lows hold. Keep in mind that FUD can break down any support right now. But as we know from the history, this is just the game. Be ready, stay focused. If you need help, let me know.
MANAGE YOUR RISK AND USE STOPLOSS IN EVERY TRADE
NOT A FINANCIAL ADVICE

LPTUSDT Inverse Head and Shoulder Pattern!LPTUSDT technical analysis update
LPT's price is breaking the inverse head and shoulders neckline resistance and is trading above both the 100 and 200 EMA on the daily chart. A gradual bullish move can be expected in the coming days.
Resistance 1: $17.35
Resistance 2: $20.00
Resistance 3: $26.00
Support: $12.50
Regards
Hexa

LPT Looks BullishFrom where we placed the red arrow on the chart, it seems that the LPT correction has started.
The correction looks like a triangle that is over.
By maintaining the green range, it can move towards the targets.
The targets are marked on the chart.
Closing a daily candle below the invalidation level will violate the analysis.
For risk management, please don't forget stop loss and capital management
When we reach the first target, save some profit and then change the stop to entry
Comment if you have any questions
Thank You
