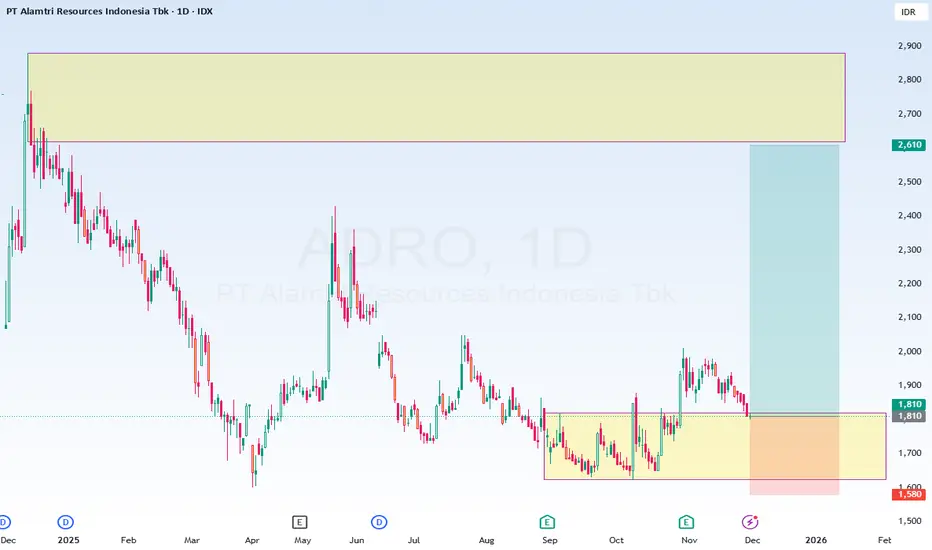
ADRO Trade Setup – Bullish BiasADRO is showing early bullish signs, including a structural break (CoC) on the Daily Timeframe, a retracement into supply, and support from a daily base zone. The planned entry at 1810 offers a favorable risk–reward profile, with stops safely below structure and targets aligned just under the next supply zone.
Technical Context
1. Change of Character (CoC) → On the daily timeframe, price broke the previous high at 1880, signaling a potential shift in market structure toward bullish momentum.
2. Retracement to Supply Zone → Price has pulled back into the September monthly supply zone, offering a possible area of reaction.
3. Previous Base Zone (Daily) → Current price action is also sitting on a daily base zone, reinforcing confluence for a potential bullish continuation.
Trade Plan
Entry 1810
Stop Loss 1580
Target 2600
Risk (pts) 230
Reward (pts) 790
R:R Ratio 3.4x
LQ45
LQ45: POTENTIAL BRIGHT BULLISH OUTLOOK FOR INDONESIA STOCKSHello Enthusiast Indonesia Stock Investor/Trader. Here's free outlook for potential Index Movement. Please give us thumbs up, follow, and comment your opinion on the outlook to support the channel. Let's GROW TOGETHER to become matured trader :)
LQ45 is an Indonesia Stock Market Index which consists of 45 liquid traded stocks. LQ45 could be use as an indicator for forecasting potential Indonesia stock outlook.
LQ45 has broken out of the bullish flag. Afterwards, LQ45 retested the structure and broke out of the near resistance. The MACD indicator already crossed above the zero level area, it signify the potential bullish bias on the index.
The roadmap will invalid after exceeding the support/target area.
DISCLAIMER:
THIS IS NOT A RECOMMENDATION TO BUY OR SELL THE INDEX.

BBNITechnical Analysis is the forecasting of future financial price movements based on an examination of past price movements. Like weather forecasting, technical analysis does not result in absolute predictions about the future.

Will SIDO continue the previous rejection? Or ...😕When viewed as a whole with a daily time frame, the candle of this stock has many wicks. Starting from the dragonfly doji, gravestone doji, long-legged doji, and so on. Many candles you will find here. From now on, this means that a lot of the market uncertainty arises, and you must weigh your risk-return ratio carefully, or you will just be wasting money on commission fees equivalent almost to 1 tick of the share price. Now, the choice is yours. What will happen next, we just have to wait for the confirmation signal, right?

BBCA is ranging, what will happen next?😲What do you think will happen on July 29th and beyond? Considering that it's almost the season for the release of the second quarter financial statements.

Bullish is back.. TLKM target price 4300Harga sudah break Trendline, berpeluang dulu untuk pullback ke area 3050 karena karena ada gap juga, kemudian rally sampai target price pertama di 4300an

Roadmaping MNCNBisa masuk bertahap, karena ada peluang koreksi dulu ke area 920 ( Unfilled Order), selanjutnya berpeluang besar rally sampai area 1400, semoga bermanfaat..

TLKM Normal Price versus Current PriceTLKM is one of Composite dominant contributor which the Stock price is still bearish now days. So let's see how the normal price of this stock index by simple view. Normal price actually is EPS x PER (IDR 4020). And this stock index has a normal price higher than current price (IDR 2650). So if you buy this stock now you get a discount. Happy trading!
IDX:TLKM
