LRC - USDT possible to reach the target of $4.2 - 4.8Loopring is still possible to reach the target of $4.2 - 4.8.
Cluster support is at the level of $2.4 - $2. The risk level is below $2.
Take profit in stages 3 -3.2 - 3.4 - 3.7 - 4 - 4.2 - 4.3 - 4.6 -4.8.
Good luck.
LRC

Zig Zag, Zig Zag....Zig Zag? Its got the look of a double Zig Zag, not perfect but dece. Now a 2xZZ could turn into a 3xZZ but those are said to be rare, so we shall see. Breaking 2.89 would make a 3xZZ even more unlikely so that area alarmed. Some nice grindage on the channel too!

Two. Four. Six.Now that channel on 1 hr was denied we could possibly go downward more to test 2.3 ma again. If interest wains we see 1.80 or less within the next week is starting to make a lot of sense. It would then get very hectic to get out if looping/gme was delayed. We would see 1 pretty quickly.
This could get ugly fast unless someone or something happens in the next day or two.

LRC - SOL similarities? I'm aware of the GME news but I'm not a Stocktwits and Reddit hopium inhaler. With that being said, I do believe the chart looks similar to Solana when it broke out of the 40's and into the 60's before rocketing to $200. I wish I was smart enough to overlay the charts but I'm not. I do think LRC can make a 10x jump when people start figuring out how this is going to change L2. I hope I'm right because I passed on CRO for this.

LRC longRetest of break out of ascending wedge.
Expecting a good move the length of the flag upwards.

LRC no showing any lifeNo signs of life right now LRC looks to be heading back to bottom again. Possible to be 180 or lower.

🔥 Loopring Bull-Flag: Volatility SoonAfter the massive run-up earlier this month, LRC is currently seeing some consolidation coming its way.
During this period of consolidation, a bull-flag pattern has developed on the chart. Since this flag pattern has formed during a strong bullish move, it's more likely for the price to break out on the bullish side than on the bearish side.
In case of a bullish break out, I'm looking at the $2.75 - $2.90 range for potential exit targets. In case we break above that in the coming days, we might even go for a new all-time high in the near future.
Happy trading!

1.50-1.80 or 3Make or break right now and anything can happen.
My bet is on upward but many indicators show indecision.

LRC - 4h Higher Low AttemptLRC is attempting to set a consecutive 4h HL as a potential, right shoulder, has begun to appear.

LRC- Descending triangle - Bearish movement incomingI see pretty bearish movement likely to happen in the coming couple weeks in loopring pairing USDT. We got lower highs and the support which looks like susceptible of being broken through.

LRC - Descending Triangle Pattern - BEARISHLoopring is drawing a bearish pattern with lower highs and a bearish momentum. I'm expecting it to have free fall kind of descendance in price over this 1-2 weeks.

LRC to lower to get more accumulationLRC looks to be in a mini downtrend movement in its downside range to accumulate more to further likely to breakout to the upside and complete the bullish flag


LRCLRCUSDT - Channel Breakout
LRCUSDT(2h chart) Currently trading at 2.76
Buy level : 2.8
Target 1: 3.26
Target 2 : 3.75
Target 3 : 4.2
Target 4 : 5
Max Leverage 3x
Stop loss : 2.12
Always keep Stop loss
@Crypto By Masoud

LRCUSDT - Channel Breakout!!LRCUSDT - Channel Breakout!!
LRCUSDT(2h chart) Technical analysis
LRCUSDT(2h chart) Currently trading at $2.76
Buy level : Above $2.8
Stop loss: Below $2.12
TP1: $3.26
TP2: $3.75
TP3: $4.2
TP4: $5
Max Leverage 3x
Always keep Stop loss
Follow Our Tradingview Account for More Technical Analysis Updates, | Like, Share and Comment Your thoughts.

NOV 21stNot financial advise, just a recognized trend that i had noticed based on the peak before the massive uptrend.

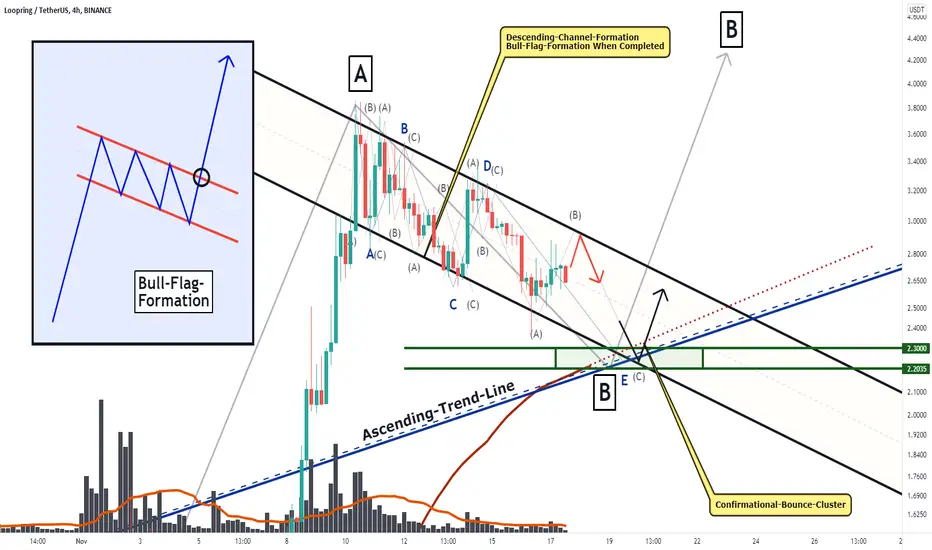
LOOPRING, Massive BULL-FLAG Forming, How It Completes!Hello Cryptocurrency Community,
Welcome to this altcoin-trading-analysis about LRC (Loopring), we are looking at the 4-hour timeframe perspective. As when looking at my chart we can watch there how Loopring is forming a very interesting structure here as it previously increased with bullish volatility and shot to the upside increasing with volume and spread. Now as Loopring firstly pulled back it moved on to initiate this main formation in the structure which can be considered as a descending-channel-formation. Within this descending-channel-formation Loopring has a coherent wave-count with the waves A to D almost already completed. Now as Loopring moved on with the wave-count we can see the wave E is forming now within this whole structure and already begun to develop the wave A and B in the local structure of this major wave E. Once the wave-B has been completed which will happen when Loopring finalizes this local bear-flag Loopring will move on further with the wave-E and complete the whole wave-count within the confirmational-bounce-support marked in my chart where several supports coming together. When Loopring manages to bounce within the support and move on bullishly to finally close above the upper-boundary this will complete the whole descending-channel as a bull-flag and it will be the origin for further continuations to the upside for Loopring, in this case, there are some great potentials given, it will be an interesting development ahead.
In this manner, thank you for watching the analysis, it will be great when you support it with a like, follow and comment for more upcoming market analysis, all the best!
"Great fortune is when opportunity meets preparation."
Information provided is only educational and should not be used to take action in the markets.
LRC USDThis is the current sentiment at this particular time in time/space. The Momentum held up during the down turn.

$LRC beautiful bullish flag detected on chartI am seeing a wonderful bullish flag on 4 hourly in USDT pair.
The resistance breakout scenario would mean another bull run for LRC until 5-5.50 zone.


LRC USD This is the current sentiment in this curent time space. Everything looks Healthy. The Reversal is Relevant

LRCCritical up/down moment for LRC right now. Given the hype and releases happening this would be a great spot right now to long.
Current candle looks great as well.
Check out the ma's in multiple timeframes to coincide with the cloud, vix, and stochastic.
K.i.s.s

LRC - Falling Wedge Confirmed After a period of consolidation the pattern confirmed with a back-test of the upper bound for a 22% gainer. Price found Golden Pocket resistance with multiple rejection of the Pattern Fixed Range Volume Profile.
