#LRC/USDT Ready to go up#LRC
The price is moving in a descending channel on the 1-hour timeframe. It has reached the lower boundary and is heading towards breaking above it, with a retest of the upper boundary expected.
We have a downtrend on the RSI indicator, which has reached near the lower boundary, and an upward rebound is expected.
There is a key support zone in green at 0.0514. The price has bounced from this level multiple times and is expected to bounce again.
We have a trend towards stability above the 100-period moving average, as we are moving close to it, which supports the upward movement.
Entry price: 0.0517
First target: 0.0536
Second target: 0.0546
Third target: 0.0561
Stop loss: Below the support zone in green.
Don't forget a simple thing: capital management.
For inquiries, please leave a comment.
Thank you.
LRCBTC

LRC Buy/Long Signal (4H)We have a liquidity pool on the chart that, if swept, could allow the price to rebound strongly upwards. There are two lows, with buyer stop-losses placed just below them.
We have two entry points, which can be entered using a DCA (Dollar-Cost Averaging) approach.
Targets are marked on the chart.
If you would like us to analyze a coin or altcoin for you, first like this post, then comment the name of your altcoin below.

LRCUSDT Forming Falling WedgeLRCUSDT is forming a clear falling wedge pattern, a classic bullish reversal signal that often indicates an upcoming breakout. The price has been consolidating within a narrowing range, suggesting that selling pressure is weakening while buyers are beginning to regain control. With consistent volume confirming accumulation at lower levels, the setup hints at a potential bullish breakout soon. The projected move could lead to an impressive gain of around 90% to 100% once the price breaks above the wedge resistance.
This falling wedge pattern is typically seen at the end of downtrends or corrective phases, and it represents a potential shift in market sentiment from bearish to bullish. Traders closely watching LRCUSDT are noting the strengthening momentum as it nears a breakout zone. The good trading volume adds confidence to this pattern, showing that market participants are positioning early in anticipation of a reversal.
Investors’ growing interest in LRCUSDT reflects rising confidence in the project’s long-term fundamentals and current technical strength. If the breakout confirms with sustained volume, this could mark the start of a fresh bullish leg. Traders might find this a valuable setup for medium-term gains, especially as the wedge pattern completes and buying momentum accelerates.
✅ Show your support by hitting the like button and
✅ Leaving a comment below! (What is your opinion about this Coin?)
Your feedback and engagement keep me inspired to share more insightful market analysis with you!

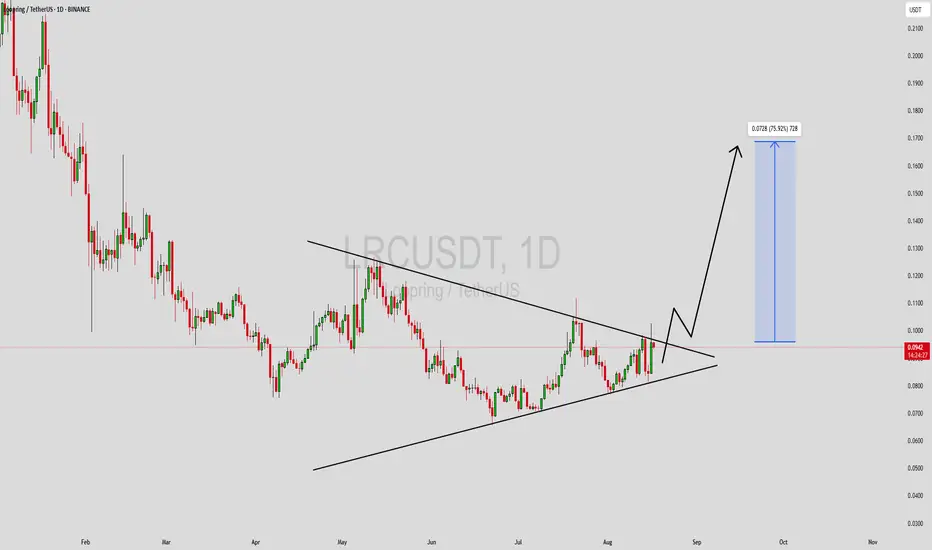
LRCUSDT Forming Bullish PennantLRCUSDT is forming a bullish pennant pattern, which is one of the most reliable continuation setups in technical analysis. After a strong upward move, the price has entered into a consolidation phase, creating a pennant structure that often signals the possibility of another breakout to the upside. The consolidation indicates that buyers are holding their positions while sellers are unable to push the price significantly lower, showing strength in the trend.
The trading volume behind LRCUSDT remains healthy, supporting the potential for a strong breakout once the pennant resolves. With investors actively taking interest in this project, the market sentiment is leaning bullish. If the breakout occurs as expected, price projections suggest possible gains of 60% to 70%+, making this an attractive setup for traders looking for high-reward opportunities.
The strong structure of this pattern, combined with growing participation from traders and investors, positions LRCUSDT as a pair to watch closely in the coming sessions. A sustained move above the pennant resistance could trigger momentum-driven buying, leading to a sharp rally and establishing new short-term highs.
✅ Show your support by hitting the like button and
✅ Leaving a comment below! (What is You opinion about this Coin)
Your feedback and engagement keep me inspired to share more insightful market analysis with you!
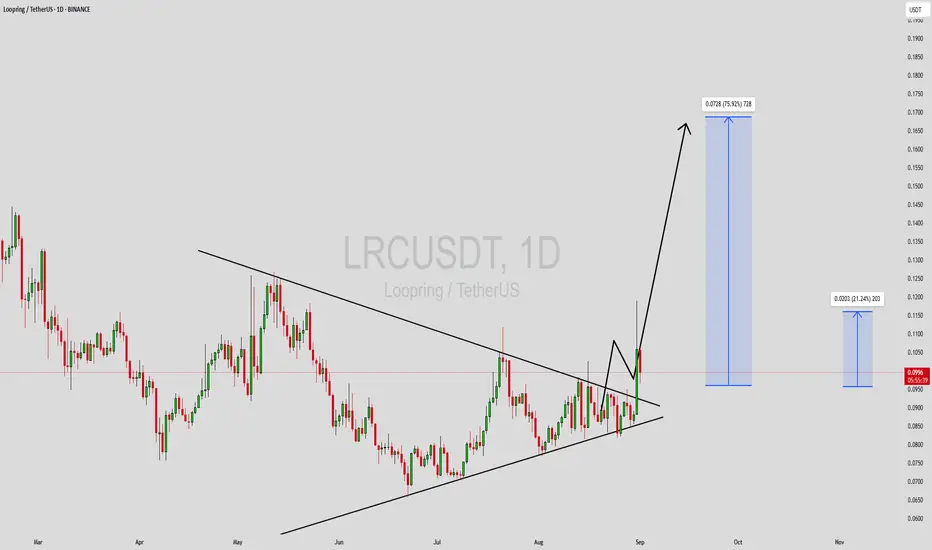
LRCUSDT Forming Symmetrical TriangleLRCUSDT is currently trading within a well-defined symmetrical triangle pattern, indicating a phase of consolidation after a prolonged downtrend. This type of chart formation is often seen as a neutral setup that can break in either direction—but when combined with rising volume and improving market sentiment, the likelihood of a bullish breakout increases. Based on technical analysis, a breakout above the upper trendline resistance could trigger a strong rally, projecting a potential gain of 60% to 70%+ in the near term.
Volume has been gradually increasing, which supports the bullish case. This growing interest from market participants shows that traders and investors are beginning to accumulate positions ahead of a possible breakout. If LRCUSDT clears the key resistance zone with a strong daily close, it could attract even more buyers and build strong upward momentum.
The overall sentiment around LRCUSDT is improving, with more eyes turning toward the project. It’s not only the chart setup that’s catching attention, but also the fundamentals and network activity that continue to support the long-term outlook. With the broader market showing early signs of recovery, LRCUSDT could be well-positioned to outperform many other altcoins if it follows through on this pattern.
✅ Show your support by hitting the like button and
✅ Leaving a comment below! (What is You opinion about this Coin)
Your feedback and engagement keep me inspired to share more insightful market analysis with you!
LRC is Setting Up BIG!Loopring (LRC) is presenting an excellent opportunity with a confluence of technical factors aligning at the old high demand zone. This area holds significant importance as it combines the strength of a multi-tap demand zone with a Fibonacci retracement level, enhancing its reliability for a potential bounce.
Why the Old High Demand Zone is Key
3-Tap Test:
The price has tapped into this demand zone multiple times, signaling its strength as a support level. Each tap reinforces the zone, indicating buyer interest and the likelihood of a reversal from this level.
Historical Significance:
This zone corresponds to a previous high where LRC established strong momentum. Retesting old highs as support is a common bullish continuation pattern, suggesting this area is crucial for price stability.
Fibonacci Confluence:
The demand zone aligns perfectly with a key Fibonacci retracement level (e.g., 0.618 or 0.786). Fibonacci levels are widely respected in the market, making this zone even more attractive for an entry.
Why This Setup Stands Out
High-Probability Reversal: The confluence of factors increases the likelihood of a strong bounce, making it an ideal point to join the trend.
Low Risk, High Reward: Entering near this zone offers a tighter stop-loss and greater upside potential if the price rebounds.
Market Structure Support: The demand zone holds significance in maintaining the bullish structure of LRC.
How to Approach This Trade
Spot Buy at the Demand Zone: Place buy orders within the old high demand zone, ensuring you're positioned at this critical level.
Watch for Confirmation: Look for bullish price action, such as candlestick patterns (e.g., hammer or engulfing candles) or increasing volume near the zone.
Set a Stop-Loss: Place a stop-loss slightly below the demand zone to protect against invalidation.
Hold for a Fibonacci Extension: If the price bounces, aim for higher Fibonacci extension levels as potential targets.
I keep my charts clean and simple because I believe clarity leads to better decisions. Trading doesn’t have to be overly complicated, and I enjoy sharing setups that have worked well for me.
My approach is built on years of experience and a solid track record. I don’t claim to know it all, but I’m confident in my ability to spot high-probability setups. It’s all about learning and growing together as traders, and I’m here to share what I see.
The markets can confirm what the charts whisper if we’re paying attention. I hope these levels help you as much as they’ve helped me in the past. Let’s see how this plays out!
Tip of The Iceberg
🐶 DOGEUSDT.P: Next Move
🎨 RENDERUSDT.P: Opportunity of the Month
💎 ETHUSDT.P: Where to Retrace
🟢 BNBUSDT.P: Potential Surge
📊 BTC Dominance: Reaction Zone
🌊 WAVESUSDT.P: Demand Zone Potential
🟣 UNIUSDT.P: Long-Term Trade
🔵 XRPUSDT.P: Entry Zones
🔗 LINKUSDT.P: Follow The River
📈 BTCUSDT.P: Two Key Demand Zones
🟩 POLUSDT: Bullish Momentum

#LRC/USDT Ready to go up#LRC
The price is moving in a descending channel on a 1-day frame and sticking to it well
We have a bounce from the lower limit of the descending channel, this support is at 0.2112
We have a downtrend on the RSI indicator that is about to be broken, which supports the rise
We have a trend to stabilize above the moving average 100
Entry price 0.2150
First target 0.2258
Second target 0.2331
Third target 0.2427

LRC looks bullishThe LRC appears to have completed a correction that was ABC and wave C was a terminal.
We are looking for buy/long positions on the green range
The target is the red box on the chart.
Closing a daily candle below the invalidation level will violate this analysis
For risk management, please don't forget stop loss and capital management
Comment if you have any questions
Thank You

LRC buy/long setup (4H)From where we placed the green arrow on the chart, we have a bullish pattern on the chart.
This pattern is diametric or triangular. In both scenarios, the price can move from the green range to the red box.
The targets are marked on the chart.
Closing a daily candle below the invalidation level will violate the analysis.
For risk management, please don't forget stop loss and capital management
When we reach the first target, save some profit and then change the stop to entry
Comment if you have any questions
Thank You

LRC LOOKS BULLISHThis analysis is an update of the analysis that you can see at the bottom of this page, in the related analysis section
LRC Diametric seems to be complete. By maintaining the green range, it can move towards the targets.
Closing a candle below the invalidation level will violate the analysis
For risk management, please don't forget stop loss and capital management
When we reach the first target, save some profit and then change the stop to entry
Comment if you have any questions
Thank You

#LRCUSDT LONG#LRC
Finally, we reached the upper limit of the downward channel
Since May 2023
At the same time, we are close to breaking the EMA 100
We have a large reversal pattern and the price looks set to break it
The price is expected to trade in an upward wave with price corrections
Current price 0.3310.
The first target is 0.4805.
The second target is 0.6294.

LRCUSD 1W LONG📈Hi all. Loopring is a protocol for building decentralized exchanges. It is an open protocol that allows developers to incorporate exchange functionality into decentralized applications (dApps). Loopring operates on the Ethereum and Qtum blockchains, and also plans to expand to NEO. It provides higher liquidity and improved pricing by matching orders in the form of order rings and combines off-chain order splitting with on-chain settlement. Loopring also offers high-performance non-custodial products such as the Loopring Wallet and Loopring L2 Web App.
Timeframe 1 week. LRCUSD is in a descending channel and has approached important support. Fractal repetition of growth is possible. There is a high probability of further decline to the 0.1719 zone. Therefore, the safest entry would be at a breakout/retest of the channel. It is also possible to spot with additional gains and trade in the channel itself. Marked goals and levels on the chart.

LRC ANALYSIS (1D)We have a large diametric for LRC, which now seems to be only the G wave, the final wave of this diametric.
The least risky and the best place to buy is the green range.
The target is marked on the chart.
For risk management, please don't forget stop loss and capital management
Comment if you have any questions
Thank You

UPDATE LRC / LRCUSDTUPDATE IDEA^
Good Luck >>
• Warning •
Any deal I share does not mean that I am forcing you to enter into it, you enter in with your full risk, because I'll not gain any profits with you in the end.
The risk management of the position must comply with the stop loss.
(I am not sharing financial or investment advice, you should do your own research for your money.)

LRC Loopring Coin Price Prediction🔥 Price on the 4H chart might come at these support area and we might get a potential bounce🔥
Potential bounce areas for Buying 0.2717 and 0.2421
👉 Follow me for more real time opportunities.
Share your Thoughts if you have any?

LRC Loopring - Quiet before the STORM ?Hi Traders, Investors and Speculators 📈📉
Ev here. Been trading crypto since 2017 and later got into stocks. I have 3 board exams on financial markets and studied economics from a top tier university for a year. Daytime job - Math Teacher. 👩🏫
Loopring / LRCUSDT has been trading under its 50 day moving average for a few weeks now (this is the weekly chart). This means that the chart is heavily oversold from the MA perspective and a correction is due.
This is bullish, because a correction back towards the 50d MA is expected , even if we get rejected there it will still be an easy, low risk high reward setup that could provide +140%. Keep an eye out on this altcoin and the price action along the moving averages !
Have a great weekend, the charts will be here on Monday 🥂
_______________________
📢Follow us here on TradingView for daily updates and trade ideas on crypto , stocks and commodities 💎Hit like & Follow 👍
We thank you for your support !
CryptoCheck

Loopring token (LRC) forming bullish Cypher for the next pumpHi friends, hope you are well and welcome to the new trade setup of Loopring token (LRC) with US Dollar pair.
Previously we caught more almost 47% pump of LRC as below:
Now on a 2-hour time frame, LRC has formed a bullish Cypher move for the next price reversal.
Note: Above idea is for educational purpose only. It is advised to diversify and strictly follow the stop loss, and don't get stuck with trade.

LRC LOOKS BULLISH (12H)Hi, dear traders. how are you ? Today we have a viewpoint to BUY/LONG the LRC symbol.
For risk management, please don't forget stop loss and capital management
When we reach the first target, save some profit and then change the stop to entry
Comment if you have any questions
Thank You

LRC ANALYSIS (4H)Hi, dear traders. how are you ? Today we have a viewpoint to BUY/LONG the LRC symbol.
For risk management, please don't forget stop loss and capital management
When we reach the first target, save some profit and then change the stop to entry
Comment if you have any questions
Thank You

Loopring token (LRC) forming bullish Cypher for upto 71.50% pumpHi dear friends, hope you are well and welcome to the new trade setup of Loopring token (LRC) with Bitcoin pair.
Recently we caught almost 50% pump of LRC as below:
Now on a daily time frame, POEPLE with LRC pair has formed a bullish Cypher move for next price reversal.
Note: Above idea is for educational purpose only. It is advised to diversify and strictly follow the stop loss, and don't get stuck with trade

LRC LONG SETUP (HOT PROFIT)Hi, dear traders. how are you ? Today we have a viewpoint to BUY/LONG the lrc symbol.
For risk management, please don't forget stop loss and capital management
When we reach the first target, save some profit and then change the stop to entry
Comment if you have any questions
Thank You

LRCUSDT: LONG SETUPLRC is currently moving in a bullish channel,
It tested its down trend line.
I am expecting a huge bullish move toward my target which is a measure move of second leg
Its BTC pair is also at strongest support level.
There might be some up and down,
But lets see
