LTCUSDT 1,290% profits potential 5X leverage —LONG tradeLitecoin looks very tricky right now but also good, tricky and good. The action has been happening within a long long-term ascending channel. The previous bear market bottom came up June 2022. No new lows after this date.
The last major peak happened December 2024 and the most recent low, the market flush, October 2025. Last week we have a higher low.
Why should we expect a reversal here, now? Because the lower low last week has less volume compared to the market flush. This signal alone reveals the bearish trend being over. Actually, the current bearish move is already over-extended.
Advanced traders took advantage of the fact that many people have strong expectations for Litecoin in the coming years. Thus the over-extended correction. Yes, the market will turn but when? Experienced traders take advantage of this doubt to profit from over leveraged and impatient traders. Focus on the long-term.
This chart doesn't reveal much but we go based on marketwide action. We are going up next.
Needless to say, Ethereum is now trading back above $3,000 and Bitcoin is about to hit $90,000. The retrace is over; the resumption of the bullish period, the relief rally for Bitcoin, the bull run for the altcoins.
Full trade-numbers below:
_____
LONG LTCUSDT
Leverage: 5X
Potential: 1290%
Allocation: 5%
Entry zone: $65 - $72
Targets:
1) $84
2) $96
3) $116
4) $129
5) $145
6) $173
7) $197
8) $228
9) $251
Stop: Close monthly below $63
_____
Thank you for reading.
Namaste.
LTC

Crypto SILVER - LTCIn the world of traditional finance, Gold (XAU) and Silver (XAG) provide the ultimate blueprint for what we are seeing in the crypto markets today.
While Bitcoin (Digital Gold) has been busy smashing all-time highs and capturing the world's attention, Litecoin (Digital Silver) has been quietly ignored, stuck in a massive range for years.
If this feels familiar, it’s because we’ve seen this movie before in the metals market.
On the charts, we are witnessing a rare technical phenomenon: a high-conviction accumulation phase exceeding 1,300 days.
The 1,300+ Day Accumulation : We are currently mid-way through 2026, and LTC has been building a base for over 1,300 days.
The "Forgotten" Asset : For nearly 8 years, LTC has largely moved sideways against the macro trend. It has been called "boring" and "forgotten" by the retail crowd—the exact sentiment usually found at a generational bottom.
Network Integrity : Despite the price stagnation, LTC recently hit record-high network activity and has maintained 100% uptime for over 14 years. Institutional accumulation is happening in the dark while the public looks away.
Drop in comments bellow - Are You holding Litecoin?

LTC/USDT 30M Short-Term📊 1) Market Structure (Price Action)
The market is consolidating/accumulating between ~67.2 and ~70.1.
Previously, there was a strong decline, then range trading with false breakouts.
Currently, the price has rebounded from the ~66 low and is making a higher low → short-term bullish.
👉 This looks like a retest of the range bottom → a push to the middle of the range.
🧱 2) Key Levels (Your lines are well marked)
🔴 Support Levels
67.20 – the most important local support (range low).
64.89 – a strong swing low (if 67 breaks → decline here).
63.14 – the bulls' last defense.
🟢 Resistance
69.37 – mid-range, local S/R flip.
70.11 – key range high.
71.60 – strong HTF resistance (if it breaks 70 → target).
📈 3) Trend (moving average)
The green MA (probably the 200 EMA/SMA) has been acting as dynamic resistance previously, and now the price is starting to hold above it → bullish short-term.
Structure:
low → higher low → test resistance = breakout potential.
⚡ 4) RSI + Stoch RSI
RSI (lower panel)
RSI ~55–60 → bullish momentum (above 50).
No overbought → room for further upward movement.
Stoch RSI (middle panel)
Oscillates, but not to an extreme → no dump signal.
If it crosses upwards >80 → a scalp short signal (at 30m).
🧠 5) Scenarios (most important)
🟢 BULLISH SCENARIO
Condition:
Close of the 30m candle above 69.40
Targets:
70.11
71.60
73+ (if a breakout range on HTF)
👉 This will be a consolidation breakout → an impulsive move.
🔴 BEARISH SCENARIO
Condition:
Rejection of 69.4 + return to below 67.9
Targets:
67.20
64.89
63.14
👉 This will be a classic range fake breakout → dump to the lower zone.
🧨 6) What do I see as smart money?
A liquidity grab above 69.5–70 is very likely, followed by a dump.
Market makers like to:
break resistance
collect longs
dump to range low
💰 7) Trading setup (pro)
📌 LONG scalp
Entry: 69.4 breakout retest
SL: 68.8
TP1: 70.1
TP2: 71.6
📌 SHORT swing (better R:R)
Entry: 70–71 rejection
SL: 71.8
TP1: 67.2
TP2: 64.9

LTCUSDT - Hunting for liquidity before the fallBINANCE:LTCUSDT is consolidating below 70.0 before a possible continuation of the decline. The global trend is downward, liquidity is low...
After a sharp decline, the coin entered a consolidation phase, during which a cascade of support is observed, which may falsely indicate the presence of a buyer. The goal of such a maneuver may be to capture liquidity at 69.70 before falling to 65.0
Within the context of a downtrend and low liquidity, MM may form a retest of the 69.3-69.7 zone (liquidity area) to continue consolidation and further decline to 67-65.
Resistance levels: 69.30, 69.70
Support levels: 67.0, 65.3
A retest of the resistance and liquidity zone and the absence of bullish momentum may form a false breakout of the upper boundary of consolidation, which in turn may provoke a continuation of the decline towards both local targets and the global bottom...
Best regards, R. Linda!

And Yes the whales are buyingThis market volatility over the last few weeks might be an attempt to shake out the weak holders.
If price moves out of the smaller micro range (as illustrated) and pushes back in and breaks structure bullish, this would be a buy signal for me.
**The trade only happens if these conditions are met.
Keep your eye on the market and respond when it shows.
Happy Trading.

LTC global trend. Ascending channel. Triangle. January 2026Logarithm. 1-month time frame. Linear chart without market noise. Designed for visual understanding of long-term trend direction.

Litecoin’s Late-Stage Coil: The Phase Designed to Shake You OutIt often looks like a breakdown is coming near the end of a long coil because liquidity is thin and stops are obvious. Markets frequently probe below support to harvest liquidity and shake out late bulls. The difference between a fake breakdown and a real one is acceptance. Sweeps reclaim quickly. True breakdowns hold below and fail retests.
And that is exactly why the current moment feels so uncomfortable. When an asset has been compressing for thousands of days and is now pressing into the apex, the margin for error gets smaller. Every small dip looks heavier than it should. Every bounce looks weaker than it should. Price action starts to feel like it is leaning downhill, not because the trend is decided, but because the market is testing the path of least resistance in an environment where there is not much liquidity to absorb flow. The structure becomes so obvious that support stops feeling like a floor and starts feeling like a target. That is often what it looks like right before resolution.
Right now, Litecoin’s behavior has the hallmarks of that late-stage stress test. The market is acting as if it wants to slip, as if it wants to fail, because this is the phase where participants are most conditioned to give up. It is late in the coil, attention is low, confidence is fragile, and the market can create maximum emotional impact with relatively little movement. This is also when false breaks are most common, because the reward for pushing price through an obvious level is highest. If a breakdown attempt cannot gain acceptance and price quickly reclaims the range, that failed breakdown is information. It suggests sellers do not have follow-through and the market is simply clearing out weak positioning before it moves. If, however, the market starts closing below support on the higher timeframe and every retest is rejected, that is a different regime. That is acceptance, and it means the coil resolved lower, at least first.
The point is not to pretend you know which it will be. The point is to recognize that this is the part of the structure where it is supposed to look like it is failing. The apex is where markets turn certainty into discomfort, because discomfort forces positioning changes. That is what makes the next move powerful when it finally arrives.

Can LITECOIN replicate MONERO's rally??Just some fun chart trivia but we can't deny the obvious. And that's that Litecoin (LTCUSD) has been printing an (almost) identical price action since 2017 with Monero (XMRUSD).
That's up until a little less than a year ago when the two started to diverge aggressively as XMR (orange trend-line) entered a massive rally that broke above its ATH Resistance of the past 2 Cycles and made a new All Time High (ATH), while LTC has been under Lower Highs. However it hasn't broken below its Bull Cycle consolidation, which also shared with XMR before the latter broke aggressive to the upside.
So what do you think? Can LTC follow XMR's lead and make an ATH or it will continue dropping into the new Bear Cycle?
---
** Please LIKE 👍, FOLLOW ✅, SHARE 🙌 and COMMENT ✍ if you enjoy this idea! Also share your ideas and charts in the comments section below! This is best way to keep it relevant, support us, keep the content here free and allow the idea to reach as many people as possible. **
---
💸💸💸💸💸💸
👇 👇 👇 👇 👇 👇

Litecoin 20 -40% move is COMING!!Litecoin 20 -40% move is COMING!!
Price is a range low
all that volume could push LTC to a range high or ven beyond it
at this moment, risk is the lowest

The start of something great is brewingLitecoin is showing clear signs of an automatic rally. This is the things you look for if the price moves lower.
1. One or Two breaks below the current low with the price bouncing back into the range after every low, this is a clear sign of accumulation.
2. Price moving to the top of the range after the spring has formed.
So I will only be bullish after I see the accumulation pattern play out.
Trade safe

LTC is in a clear downward trend📉 MARKET STRUCTURE
Main Trend: Down
Sequence: Lower High → Lower Low
Price is moving in a clear downward channel.
Any upward breakout = correction, not a trend change.
📐 KEY LEVELS
🟩 RESISTANCES (sell zones)
84.50 – current S/R flip (was support → now resistance)
94.50 – strong HTF level, where the market has been rejected multiple times
107.50 – key trend reversal level (BOS)
🟥 SUPPORT
72.00–72.50 – key support, currently being tested
63.10 – next strong HTF support
Below → empty space to ~55–58
🔎 PRICE ACTION – WHAT YOU CAN SEE
Recent Bounce:
Weak HH
No volume
Strong rejection from:
Upper channel line
Level ~84.5
Current candle:
Aggressive supply
No demand response
👉 Sellers in full control
📊 STOCH RSI
Turnover from the upper zones
Bearish momentum
No bullish divergence
👉 Oscillator confirms continuation of the downtrend
🧠 SCENARIOS
🔴 BASELINE SCENARIO (60–65%)
Descent lower
Condition:
Close D1 below 72
Target:
63.1
Possible breakout to 60–61
🟡 CORRECTIVE SCENARIO (25–30%)
Bounce Technical
Condition:
Holding 72
Demand candle + follow-up
Target:
84.5
Maximum 94.5
DOES NOT change the trend
🟢 TREND REVERSE SCENARIO (<10%)
Condition:
Close D1 > 94.5
Then reclaim 107.5
👉 Only then can we talk about a bull market
🎯 HOW TO PLAY IT (technically)
Short:
Retest 84–85 or 94–95
SL: above the structure
TP: 72 → 63
Long:
Only a reaction to 63
Short-term scalp / swing
No forcing the low

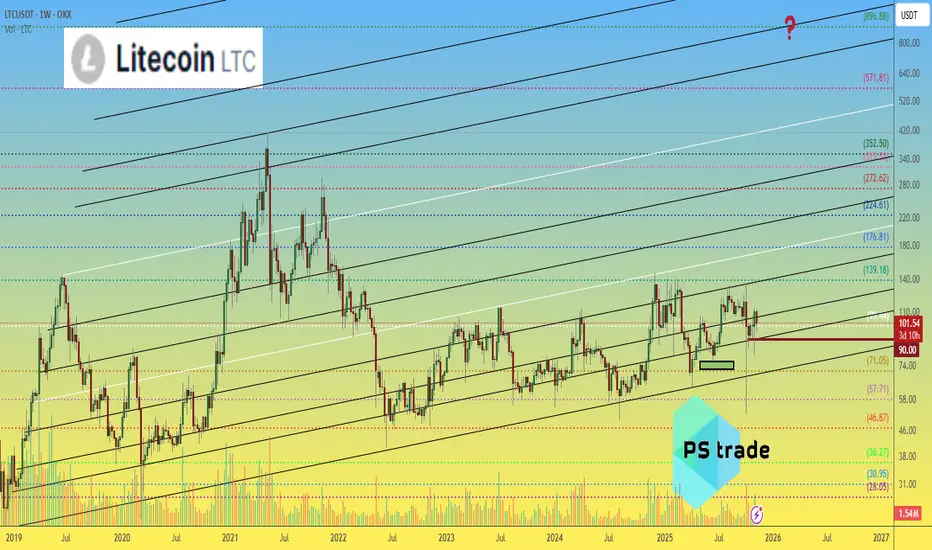
Litecoin LTC price analysis📉 For weeks, OKX:LTCUSDT has been holding strong
And guess what — this consolidation has lasted over 3.5 years! 😮
💭 The last real pump was back in early 2021... feels like it’s time for a sequel, right? 😉
Now, here’s the interesting part:
🔹 Litecoin has the same tokenomics and mining method as Bitcoin ( CRYPTOCAP:BTC ) and
🔹 Recently, another “old school” coin — CRYPTOCAP:ZEC — just pumped hard 💥
🔹 And there are rumors about a potential LTC ETF 😏
With a current market cap of only $7.7B, there’s plenty of room to grow.
So maybe... just maybe... CRYPTOCAP:LTC at $900 isn’t that crazy after all? 🚀
What do you think — are we on the verge of a new #Litecoin era? 👇
______________
◆ Follow us ❤️ for daily crypto insights & updates!
🚀 Don’t miss out on important market moves
🧠 DYOR | This is not financial advice, just thinking out loud
1M Major Support TrendsUsing DWEB Trends, I traced all the underlying trends that will act as support. I also marked the intersections of these trends in the future. See below for the original chart below.

LTC - 20 -30% move is coming!!!Big open interest rise (20%) at range low
if price break above VAH - i think it could hit $100 area

#LTC/USDT analysis.Give me some energy !!!#LTC
The price is moving within a descending channel on the hourly timeframe. It has reached the lower boundary and is heading towards a breakout, with a retest of the upper boundary expected.
The Relative Strength Index (RSI) is showing a downward trend, approaching the lower boundary, and an upward bounce is anticipated.
There is a key support zone in green at 75.00, and the price has bounced from this level several times and is expected to bounce again.
The indicator is showing a trend towards consolidation above the 100-period moving average, which we are approaching, supporting the upward move.
Entry Price: 78.30
First Target: 79.40
Second Target: 81.45
Third Target: 83.86
Stop Loss: Below the green support zone.
Remember this simple thing: Money management.
For any questions, please leave a comment.
Thank you.

$LTC to $600Breakout above $130 = full send to retest the previous high and inevitably make a new one. These are the boring accumulation plays that few take, but those who do will be rewarded greatly. You aren't bullish enough.
Specs:
- Oldest altcoin
- 100% uptime
- Accepted, known and used worldwide
- 4 year channel consolidation
- Same tech as BTC, fraction of the cost

LTCUSDT - Symmetrical Triangle: Breakout or Breakdown?Litecoin (LTC/USDT) on the Weekly (1W) timeframe is currently in a long-term consolidation phase following a major decline from its previous cycle high. Price action is becoming increasingly compressed and is now approaching the apex of a large structure, signaling an upcoming major directional move.
The current price is trading around $82–85, positioned near the middle of the triangle, which represents a critical decision zone for the market.
---
Pattern Explanation
The chart is forming a large Symmetrical Triangle, characterized by:
Lower highs → descending resistance (upper yellow trendline)
Higher lows → ascending support (lower yellow trendline)
Pattern structure developing from 2022 through early 2026
Gradually declining volume → a typical sign of market compression before a breakout
A Symmetrical Triangle is a neutral continuation pattern, meaning the next major move will be determined by a confirmed breakout or breakdown.
---
Key Levels
Major Resistance Levels:
$95 – $100 → minor resistance / mid-range area
$120 → strong historical resistance
$134 → major supply zone
$281 → long-term major resistance / macro target
Major Support Levels:
$82 – $80 → current support zone
$63 → structural support
$40 → swing low / extreme downside support
---
Bullish Scenario
The bullish scenario will be confirmed if:
1. Price breaks above the descending trendline
2. A weekly close above resistance, supported by increasing volume
Bullish Targets (Step-by-Step):
$95 – $100 (initial target)
$120 – $134 (major distribution zone)
$180 – $280 (measured move of the triangle if bullish continuation occurs)
A confirmed breakout could mark the start of a new medium- to long-term uptrend.
---
Bearish Scenario
The bearish scenario becomes valid if:
1. Price fails to break resistance
2. A weekly close below the ascending support trendline
Bearish Targets (Step-by-Step):
$63 → key support
$40 → historical lower boundary
A breakdown from this structure would suggest a continuation of bearish or prolonged sideways conditions.
---
Conclusion
LTC is currently trading within a major decision zone on the weekly timeframe.
Traders and investors are advised to wait for clear confirmation, rather than anticipating direction inside the triangle.
➡ Breakout = potential start of a new bullish trend
➡ Breakdown = risk of further downside or extended consolidation
Patience is crucial during high-compression market phases like this.
---
#LTCUSDT #Litecoin #Altcoin #CryptoMarket
#CryptoAnalysis #AltcoinAnalysis #WeeklyChart
#SymmetricalTriangle #TrianglePattern #TriangleBreakout

LTC/USDT 1D Chart 🔎 Market Structure
The market is in a downtrend (a series of lower highs and lower lows).
The price is moving within a descending channel (black lines).
The recent move is a rebound from the lower demand zones, but the trend has not yet been broken.
📉 Trend & Price Action
The main downtrend line has not been broken – the price has reached it and is reacting.
The current move looks like a pullback/upward correction, not a trend reversal.
No clear higher high → the structure remains bearish.
🟢 Key Levels
Resistance (sell zones)
86.84 USDT – local resistance (currently being tested)
95.83 USDT – strong structural resistance
103.54 USDT – previous downside base
110.66 USDT – very strong resistance (key to trend reversal)
Support (buy zones)
78.67 USDT – local support
72.25 USDT – strong demand zone
63.14 USDT – critical support (channel bottom)
📊 Indicators
Stochastic RSI
Currently in the overbought zone (>80)
Historically, on this chart, → often ends in a correction
Signal: watch out for shorts / profit-taking
CHOP Index
High → market was in consolidation
Recent CHOP breakout down → possible impulse but not yet confirmed by volume
🧠 Scenarios
🔴 Baseline scenario (more likely)
Rejection at 86–88 USDT
Return to around 78.67 → 72.25
Continuation of the downtrend
🟢 Alternative scenario (bullish, conditional)
Daily close above 95.83
Then a breakout of 103.54
Only 110.66 = a real trend change to up
🎯 Final conclusion
This is a correction in a downtrend, not a trend reversal.
Shorts are logical under resistance
Longs are only short-term/scalp
Swing longs only after a breakout of 103–110

3-Phase Litecoin FractalWe are experiencing 2017 again. coins like CRYPTOCAP:LTC just go sideways for infinity while CRYPTOCAP:ETH gets sent to hades. i have no idea what will trigger a pump but it just feels so familiar. the phases of the fractal from LTC in 2017 are almost identical (excluding timing).

LTCUSDT - Retest of the liquidity zone on a downtrendBINANCE:LTCUSDT.P is forming a local rally after breaking through resistance at 78.0. The market is bearish, but within the bullish run, the altcoin may test liquidity at 79.4 - 81.0.
Bitcoin looks weak, a rebound from resistance is forming, and Friday's daily bar indicates strong bearish dominance. A fall in the flagship currency could trigger a fall in LTC after a local rally...
LTC looks slightly stronger than the market. The target of such a rally may be hidden behind 79.4 - 81.0. In the current situation: global downtrend, low market liquidity, I see this as a manipulative hunt for liquidity before a decline.
Resistance levels: 79.4, 81.0
Support levels: 78.0, 77.0, 75.4
A retest of this resistance cluster could end in liquidity capture and a false breakout. Consolidation below 79.4 could trigger a reversal and a decline.
Best regards, R. Linda!

DONT SELL BITCOIN TILL 2031 You see those lines on the chart, yeah those lines are when Gold got an ETF and when Bitcoin got a spot ETF. Bitcoin will be in a full on bull market for the rest of this decade with a blow off top in 2031. Bitcoin is such a new asset and everyone calling for a bear market is so short sighted. Bitcoin trading is now run by the big institutional investors. The retail that used to make the market all got liquidated in the flash crash. No more four year cycles based on the halving, none of what youre used to will be the same ever again. Stop looking at imaginary lines that say we need to move this way or that, they are all bullshlt and they dont matter.
Its my belief that Bitcoin will go on a run that no one could ever imagine and were just getting started. So everyone calling for a bear market needs to open their eyes and look at the bigger picture and stop looking at imaginary moving averages. They may have worked before but they dont work in this scenario with Bitcoin. How many who sold thinking it was the top will lose their mind when Bitcoin spikes to 250k no pullback and 100k will never be seen again.
Not financial advice just sharing my opinion

LTC/USDT — Falling Wedge Formation Signals Potential ReversalOn the 8-hour timeframe, Litecoin (LTC) remains in an overall downtrend. However, the price structure is not moving in parallel lines, indicating that this is not a descending channel. The upper resistance trendline is steeper than the lower support trendline, signaling weakening bearish momentum.
Price is currently trading near the final phase of the pattern, approaching the apex, where a strong directional move (breakout or breakdown) is likely to occur.
---
Pattern & Price Structure
Pattern Identified: Falling Wedge (Bullish Reversal Pattern)
Key characteristics visible on the chart:
Continuous lower highs, forming a sharply declining resistance
Lower lows, but with decreasing downside momentum
Price compression, indicating reduced selling pressure
Non-parallel trendlines, distinguishing it from a descending channel
Technically, a falling wedge forming within a downtrend often precedes a bullish trend reversal, pending confirmation.
---
Key Levels
Support Zones:
80.0 USDT (current reaction zone)
76.0 – 72.6 USDT (major support & pattern invalidation level)
Resistance Zones:
85.8 USDT (near-term resistance)
93.5 – 96.5 USDT (key structural resistance)
104 – 110 USDT (major supply zone)
---
Bullish Scenario
The bullish scenario becomes valid if:
1. Price breaks above the falling wedge resistance
2. An 8H candle closes above 85.8 USDT
3. The market prints a first higher high as confirmation
Bullish Targets:
93.5 – 96.5 USDT
104 USDT
110 USDT (if momentum strengthens)
A confirmed breakout would suggest a shift from bearish control to recovery phase.
---
Bearish Scenario (Pattern Invalidation)
The bearish scenario occurs if:
Price fails to break out from the wedge
76 USDT support is broken with strong volume
Bearish Targets:
72.6 USDT
Extension toward the 70 USDT area if selling pressure accelerates
Such a move would invalidate the falling wedge and confirm bearish continuation.
---
Conclusion
Price action aligns more accurately with a falling wedge
The pattern suggests potential bullish reversal, but:
Confirmation is mandatory
Until a breakout occurs, the dominant trend remains bearish
The optimal approach is to wait for confirmation rather than anticipate.
---
#LTC #Litecoin #LTCUSDT #FallingWedge #BullishReversal #CryptoAnalysis #TechnicalAnalysis #Altcoin #CryptoTrading

LTC Key LevelsThese are LTC Key Levels
70.56
72.25
73.96
75.69
77.44
79.21
81.00
82.81
84.64
86.49
88.36
90.25
