Litecoin: Target Zone Within ReachLTC has recently continued its decline, leading us to believe that the high for green wave B is likely already in place. Price is now just a short distance from our green Target Zone, which ranges from $78.52 to $64.53. Within this zone, we expect to see the low of orange wave ii. Afterward, orange wave iii should drive price above the resistance levels at $118.71 and $147.06.
LTC

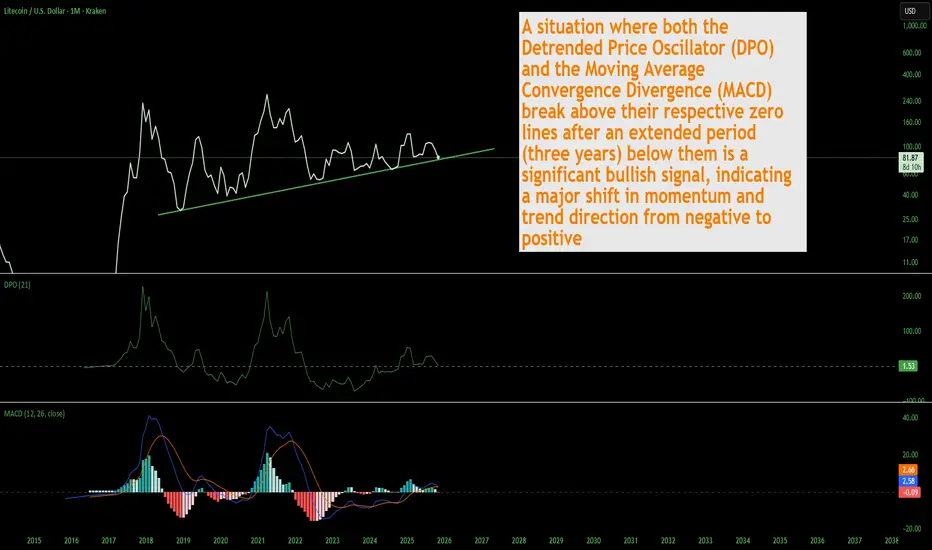
LTC Litecoin Poised For Something Big Macro Style I still see lots of people selling and capitulating. Thats ok that cant be prevented, most have no idea how markets work and those same people are afraid of their own shadow. The capitulation is almost over. I just want to point out the confluence of various indicators on the macro long term time frame pointing to a massive bull run for Litecoin. This is not financial advice just my opinion. Like and follow for more updates.
LITECOIN Analysis (4H)It appears that a double correction is forming on Litecoin and is nearing completion. Around the origin zone, we can look for long buy positions so that once this second corrective leg finishes, the price can enter a bullish phase.
The entry zone and targets are marked on the chart.
For risk management, please don't forget stop loss and capital management
When we reach the first target, save some profit and then change the stop to entry
Comment if you have any questions
Thank You

LTCUSD - Symmetrical Triangles As seen in the first symmetrical triangle a massive break out followed
If the second is anything like the first we can expect a breakout like that one
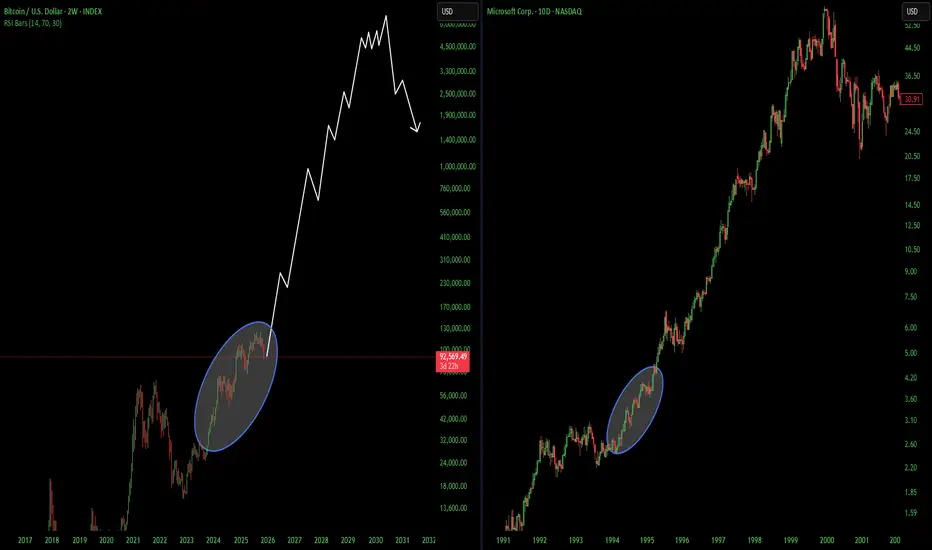
I have posted this chart before but it really is a strong bull option for a long term altcoin.
Weekly timeframe

LTCUSD H4 | Could We See A Bullish Reversal?Momentum: Bullish
The price has recently bounced off the identified buy-entry level, which aligns with the pullback support zone.
Buy Entry: 889.05
Pullback support
Stop Loss: 79.91
Swing-low support
Take Profit: 102.38
Pullback resistance
Positioned slightly below the 61.8% Fibonacci retracement
High Risk Investment Warning
Stratos Markets Limited (tradu.com ), Stratos Europe Ltd (tradu.com ):
CFDs are complex instruments and come with a high risk of losing money rapidly due to leverage. 70% of retail investor accounts lose money when trading CFDs with this provider. You should consider whether you understand how CFDs work and whether you can afford to take the high risk of losing your money.
Stratos Global LLC (tradu.com ): Losses can exceed deposits.
Please be advised that the information presented on TradingView is provided to Tradu (‘Company’, ‘we’) by a third-party provider (‘TFA Global Pte Ltd’). Please be reminded that you are solely responsible for the trading decisions on your account. Any information and/or content is intended entirely for research, educational and informational purposes only and does not constitute investment or consultation advice or investment strategy. The information is not tailored to the investment needs of any specific person and therefore does not involve a consideration of any of the investment objectives, financial situation or needs of any viewer that may receive it. Past performance is not a reliable indicator of future results. Actual results may differ materially from those anticipated in forward-looking or past performance statements. We assume no liability as to the accuracy or completeness of any of the information and/or content provided herein and the Company cannot be held responsible for any omission, mistake nor for any loss or damage including without limitation to any loss of profit which may arise from reliance on any information supplied by TFA Global Pte Ltd.


LTCUSDT : Full analysisHello friends
well you see that the power is in the hands of the sellers and we must have sufficient approvals to buy.
So you see, we have two important support areas that we have identified for you with Fibonacci, and they can be good supports. We need to see how buyers react in these areas.
Well, the next point is that despite the sharp drop in Bitcoin, Litecoin did not fall much. It fell by almost half of Bitcoin. Considering the previous times I saw that when Bitcoin fell, other currencies fell several times as much, and this is a good sign (meaning that its holders have a positive view of the currency).
But to buy, we need to know where and when to buy, to find the best point to buy and to take our profits at the best point. For this reason, we expect that Litecoin will most likely bottom out again and buy in support areas with risk and capital management and in steps And to move with the specified goals.
*Trade safely with us*

What A Shocker That Would Be Huh?Blackrock, Saylor and gang are in for some big gains. As for most of you who sold you're in for a rude awakening!
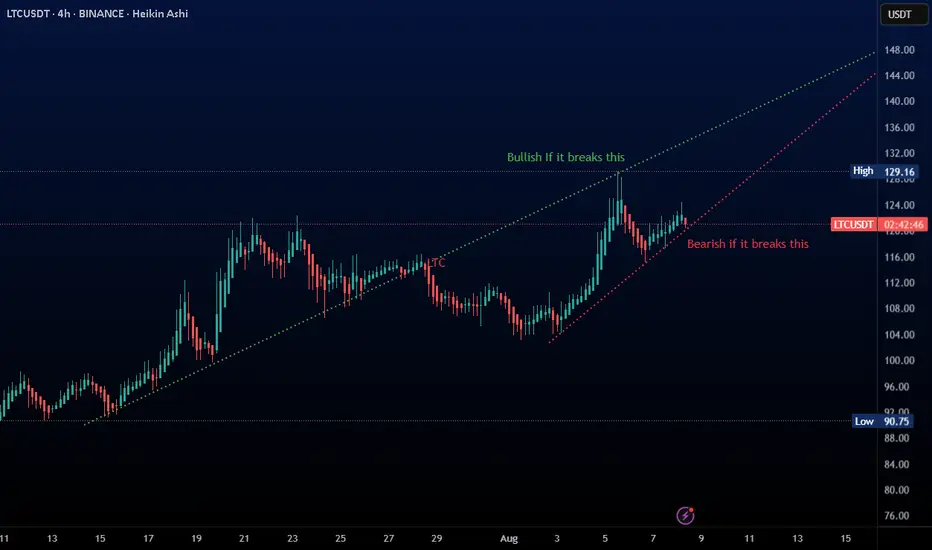
LTC: Don’t FOMO, Wait for Confirmation$LTC/USDT is getting squeezed between the rising trendline and the overhead resistance zone. Price has tested this resistance multiple times before but failed to break through.
A potential upside move could develop if we finally see a clean close above the marked zone.
Until then, it’s best to stay patient, don’t FOMO, wait for a clear breakout pattern.
DYOR, NFA

LTC Following Perfect Trend, May Breakout SOON !!! Keep an eye on these 2 trendlines for perfect setup
I have bought LTC as per below :
Bought Price : 120
TP : 130 +
Tight SL : 118 (To avoid risk)
LTCBTC Monthly – Multi-Year Downtrend Nearing Exhaustion?RSI Structure Suggests a Major Reversal Brewing
Timeframe: 1M (Monthly)
LTCBTC has spent almost a decade grinding lower inside a clearly defined multi-channel descending structure. Every major rally has formed a lower high, respecting long-term trendlines dating back to 2014–2015.
Price is now compressing at the bottom of the macro falling wedge/channel, with volatility at historic lows and volume drying up—a structure that often precedes a major trend change.
📐 Price Structure
1. Macro Downtrend Channels
Red support line marks the absolute long-term floor, tested several times since 2023–2025.
Price is currently sitting right on that red long-term support, with early signs of demand returning.
2. Volume Profile
Volume has been steadily decreasing for years.
This type of volatility + volume contraction at major support has historically preceded large expansions (both bullish or bearish, but combined with RSI, the bullish case is stronger).
📊 RSI Momentum Analysis
This is the strongest part of the chart.
1. Long-Term RSI Downtrend (Orange)
RSI has been respecting a 10-year descending trendline, creating lower highs since 2017.
Price is approaching this trendline again from below.
A monthly breakout above this RSI resistance would be the first macro bullish confirmation in nearly a decade.
2. RSI Higher Lows (Red)
Despite price making flat or lower lows, RSI is making higher lows, creating:
A long-term bullish divergence
A tightening momentum structure, signaling diminishing seller strength
This is the exact structure seen before previous LTCBTC macro reversals.
📈 Bullish Case
If LTCBTC holds the red support and RSI continues upward:
Key bullish triggers:
🔵 Monthly RSI breakout above the orange resistance line
🟢 Monthly close above the orange descending price channel
🟩 Volume expansion returning after multi-year compression
Targets on breakout (from conservative to aggressive):
0.0022 (bottom of mid-green channel)
0.0040 (mid of macro channel)
0.0060–0.0080 (top of the long-term green channel)
📉 Bearish Case
If LTCBTC loses the red macro support:
Structure invalidation
Retest of historical lows
Continuation of multi-year bleed
This would require RSI also rejecting at the orange line and rolling over.
📌 Conclusion
LTCBTC is sitting on a once-per-cycle support zone while RSI prints a multi-year bullish divergence and approaches a key breakout trendline.
This is one of the most interesting long-term setups on the chart in 2025.
Price compression + RSI compression + long-term support often leads to explosive moves.
Not financial advice — just a chart-based idea.

LTC Update📊 LTC Update
LTC is testing the red resistance zone 🔴.
If it breaks out above this level,
the first target will be the green line level 🟢.
This resistance is the key zone that must be cleared
for bullish continuation.

Total Crypto Marketcap --- PLan Your Exit#TOTAL Crypto has already doubled from it's bear bottom, to it's most recent high.
We are almost in 2024, well into crypto summer now
time is really running out to prepare your portfolio for the inevitable Bull market euphoria phase.
I bring this chart up just to remind everyone, that this cycle has potential to be one of the worst in terms of multiple expansions we have seen so far.
We have gone from exploding 340X in one cycle.. to 33X the last cycle.
I expect this time round it will be a single digit multiplier.
We have to hope and pray we do indeed break the previous ATH , and we don't double top at 3 trillion.. of which there is no guarantee!
My realistic target is around 5 Trillion Dollars, which may sound pessimistic at only 3.5X from here ... but that means your Altcoins adding at least a Trillion dollars of value from here!
Optimistically i'm looking at around 7 trillion dollars, no mean feat!
BTC.d at 30% would equal BTC 2.1 Trillion or $110k per coin.

LTC is shaping a global bullish flagLTC is forming a global bull flag pattern, and the asset has remained in the accumulation phase since 2022. At a more local level, a butterfly pattern formed but did not complete its move to point D. Afterward, the price entered a local descending channel, which often forms part of a bull flag formation. It's highly likely that after breaking out of the local pattern, the movement will continue as a local ascending channel within the global structure.
If the global pattern's boundaries are broken, the highs formed since 2024 may be renewed.
A resistance zone (purple area) is also highlighted on the chart, where increased LTC buying activity is observed.
Dropping the price below 70 and holding it there doesn't make much sense, as the accumulation zone has formed above.
More detailed analysis, additional charts, and key levels to watch are available on our site

LTC/USDT | Litecoin Up Over 35%! Can It Keep Climbing?By analyzing the #Litecoin chart on the weekly timeframe, we can see that after the last analysis, the price continued its rally from $88, hitting the targets of $97 and $106, and even reaching up to $114, coming close to the third target.
Currently, LTC is trading around $101, and it’s important to see if the price can hold above $100. If it does, we can expect further upside, with the next targets at $113, $118, and $136.
The overall gain from this analysis has been over 35%, and I hope you’ve made the most of it!
Please support me with your likes and comments to motivate me to share more analysis with you and share your opinion about the possible trend of this chart with me !
Best Regards , Arman Shaban

LTCUSDT - Time to wake up for this Monster!As usual, any popular coin like LTC tends to make you lose hope right before a major rally — it usually forms a bearish-looking triangle, breaks downward, and makes everyone think a bear market has started.
Here’s how you know it’s actually preparing to pump:
It gives a very bearish signal on the chart — spot traders panic sell at a loss, long traders get liquidated or trapped, and short traders start feeling confident right before price reverses and pumps hard.
When everyone’s losing, that’s when the path upward becomes clear and safe.
I believe a 100% move from here is the minimum we’ll see.
Best Regards:
Ceciliones🎯
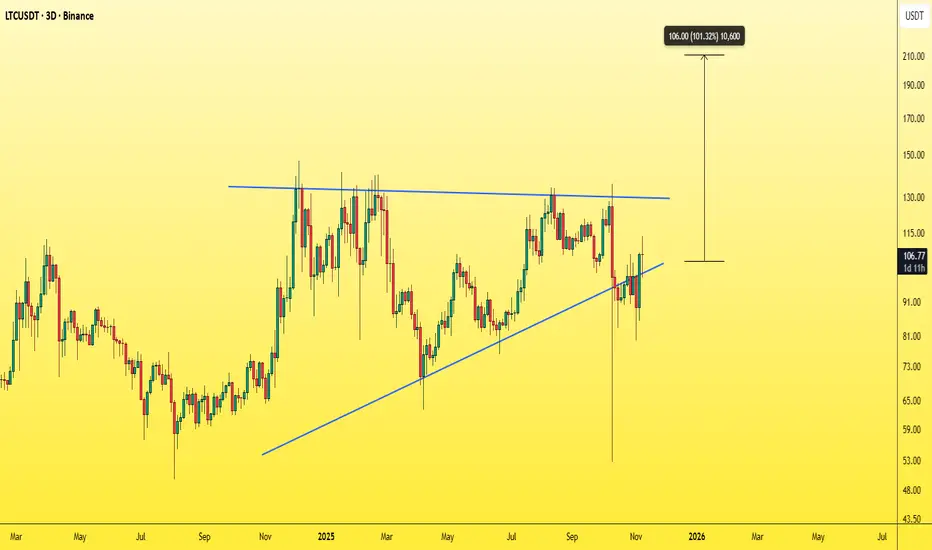
LTC/USDT – Breakout Above $135 Could Trigger Rally Toward $240Litecoin is approaching a pivotal breakout point after consolidating within a multi-year accumulation range between $60 and $140.
The recent higher-low structure and sustained strength above $100 reflect improving market sentiment and growing accumulation interest.
A decisive weekly close above $135 would confirm a breakout from this long-term base, potentially initiating a mid-term rally toward $180, followed by the major supply zone at $230–$240.
Momentum is steadily shifting in favor of buyers, supported by improving trend alignment and volume behavior.
As long as the $95–$100 support zone remains intact, the technical bias stays bullish, and the broader market structure favors continuation to the upside.
These are my observations and plans based on my chart analysis and not financial advice.

$LTC LONG IDEAThe coin has fully formed an ABCDE pattern.
To confirm it, we need a break above wave D.
Potential: $300–500.
Possible risks: if wave D is broken and the price moves to capture wave E (or immediately forms wave C), the scenario becomes invalidated.
For now, the setup remains active and valid.

LTC/USDT — The Calm Before The Storm: A Major Move Is Brewing!Litecoin is currently trading inside an extended Symmetrical Triangle formation that has been developing since mid-2021.
Each price swing is tightening between two major trendlines, compressing volatility like a coiled spring ready to snap.
📊 At around $104, LTC is sitting right at a decision point, where the battle between bulls and bears is approaching its climax.
The next confirmed breakout — either up or down — will likely define Litecoin’s macro trend for the months ahead.
---
Pattern & Technical Structure
Main Pattern: Symmetrical Triangle (neutral → directional bias confirmed only after breakout)
Upper Resistance Zone: $110–$120 (descending trendline)
Horizontal Resistance: $134 (key pivot level), followed by $281–$295 (major historical resistance)
Support Zone: rising trendline around $85–$90, with strong historical supports at $69 and $40
Volatility: extremely compressed, suggesting an imminent expansion phase
---
Bullish Scenario
If LTC manages to break and close weekly above $120–$134 with solid volume, a macro trend reversal could ignite.
🎯 Initial Target: $134 (confirmation zone)
🎯 Mid-term Target: $200
🎯 Major Target: $281–$295
🛡️ Invalidation: weekly close back below the upper trendline
Such breakouts after long compressions often lead to explosive upside moves, as months of built-up energy get unleashed in one direction.
---
Bearish Scenario
If sellers take control and LTC breaks below $85, a significant downside move could unfold.
⚠️ First Target: $69
⚠️ Next Target: $46–$40 (major liquidity zone)
🛡️ Invalidation: price reclaims the broken support on a weekly close
A clean breakdown would likely trigger a capitulation flush, but could also offer long-term accumulation opportunities near historical lows.
---
Market Outlook & Conclusion
Litecoin is now sitting at the tip of a multi-year triangle — a structure that rarely stays quiet for long.
When such formations appear on the weekly timeframe, the next expansion phase usually brings a major directional shift.
Both sides are on alert — one decisive candle could rewrite the chart entirely.
📈 Key takeaway: Stay patient, stay prepared.
The volatility storm is loading — and it’s only a matter of time before it erupts.
---
#LTCUSDT #Litecoin #CryptoAnalysis #BreakoutAlert #SymmetricalTriangle #TechnicalAnalysis #CryptoTA #MarketStructure #SwingTrading

LTC/USDT 1D🕵️♂️ The overall picture
• Price: 102.50 USDT
• Trend: The current downtrend is down (black downtrend line), but we are currently breaking above the trendline, which may signal a change in direction.
• Interval: Daily (1D)
⸻
📊 Key technical levels
• Resistance 1: 106.99 USDT
• Resistance 2: 119.25 USDT
• Support 1: 95.61 USDT
• Support 2: 89.65 USDT
• Support 3: 79.90 USDT
The current candle has broken above the downtrend line and the level of 95.6 USDT, which is a bullish signal.
⸻
🔥 Volume
• You can see a big increase in volume during today's bullish candle - this confirms that the buyers are in control.
• This is a classic example of a confirmed breakout from a downtrend.
⸻
📈 Candles
• Today's candle is a strong demand candle (green) with a large body.
• If today's close stays above the trend line (~100 USDT), it will be a technical confirmation of the breakout.
⸻
⚙️ Stochastic RSI indicator
• The blue line (RSI) is rebounding from the oversold area (<20) and heading upwards - this is a buy signal.
• The orange line begins to turn in the same direction, which may indicate the beginning of an upward impulse.
⸻
💡 Scenarios:
🟢 Growth scenario (more likely):
• Maintaining the price above 100 USDT = breakout confirmed.
• Potential targets:
• 106.99 USDT – first test of resistance, possible short pullback.
• 119.25 USDT – main target in the medium term (approx. +16%).
🔴 Downside scenario (if the breakout turns out to be false):
• Return below 95.6 USDT and closing of the daily candle there = false breakout signal.
• Then a possible decline to 89.65 USDT, and with further weakness even 79.90 USDT.

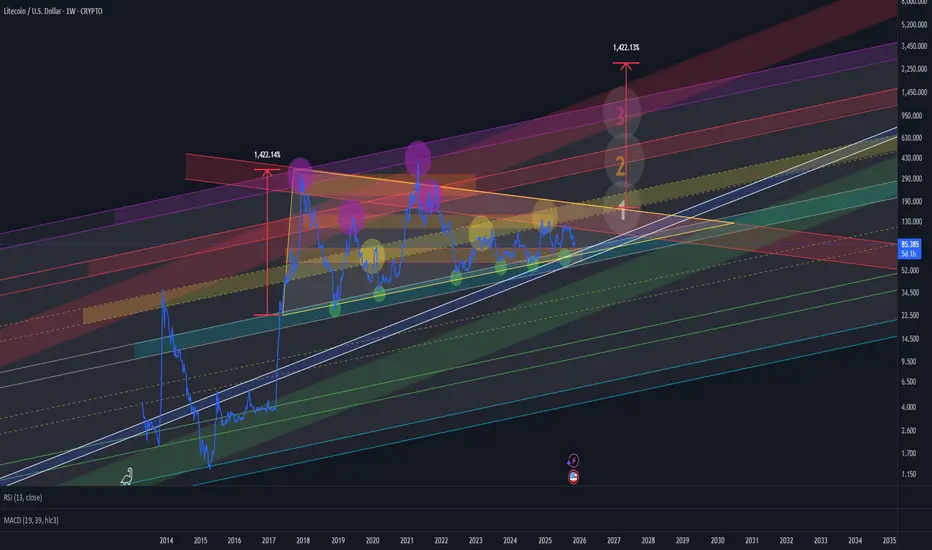
Litecoin — Long-Term Accumulation and Breakout Setup (1W Chart)We have a blue horizontal accumulation zone, which has been acting as the cycle bottom area since 2018.
From this zone, long-term positions can be built with partial profit-taking targets at the yellow, red, and violet zones — each representing stages of distribution and de-risking from the accumulated position.
Additionally, we can observe a massive triangle formation.
If this pattern plays out, the breakout target zones are clearly indicated on the chart.
At the bottom, the blue line inside the white frame marks an additional support level, which may serve as a final retest zone before the next upward cycle.
LTC - NEUTRAL VIBESSome compared NASDAQ:DASH to ... But; #LTC price looks clearly bearish under the 105$ mark! 🔴
Current price looks stuck between the 105$ resistance and 90$ support. Nothing to do with yet.
🟩Bull plan:
Daily candle close above 102$ --> 117 - 120$ pump likely 🎯
🟥Bear plan:
H4 candle break under 89$ --> 83 - 80$ support 🎯

LTC - GREAT Potential : ALT for 2026Hello Traders 📈
LTC / Litecoin may still present great opportunities for 2026.
From a bigger perspective, it may seem like LTC doesn't move much. But if we zoom in, we see massive bounces over the course of 3-4 weeks which presents big opportunities if you can buy in low:
From a technical indicator perspective, in the 4h LTC is still trading UNDER< showing that bears are still in control:
In the daily, we still see the same story however there seems to be a bullish W pattern appearing. As soon as the price reclaims the MA in the DAILY timeframe , that would be the first positive indicator of more upside:
For the short term, we need to see LTC trade ABOVE ALL the 4h moving averages in order to begin anticipating a bigger move up.
