LTC spot plan - midtermBuying in purple area LTC. I also have some spot bids below it between 0.75 fib and 0.786
LTCBTC

Litecoin Halving Cheat Sheet 2026-2027This Litecoin chart shows a recurring halving-cycle structure where accumulation precedes halving events and distribution follows them.
Logical breakdown:
Green zones – pre-halving bottoms:
Across prior cycles (2015, 2019, 2023), Litecoin formed major price bases 6–18 months before each halving, marked here in green. These zones align with low volatility, depressed sentiment, and long-term buyers stepping in.
Orange zones – late-cycle risk:
Orange bands appear as price accelerates toward the halving. Historically, this phase shows increased momentum but deteriorating risk–reward, with price often extended relative to the long-term trend channel.
Red zones – halving/top events:
Red bands coincide with the halving itself or shortly after. In every observed cycle, Litecoin topped either into or just after the halving, followed by multi-month drawdowns of roughly 60–80% (2015–2016, 2019–2020, 2023–2024).
PStructure context:
The broader ascending channel suggests long-term growth, but cycle timing has mattered more than trend direction for intermediate-term returns.
If the historical pattern holds, green zones favour accumulation, while orange-to-red zones favour caution, risk reduction, or profit-taking rather than fresh long exposure.

#LTC/USDT analysis.Give me some energy !!!#LTC
The price is moving within a descending channel on the hourly timeframe. It has reached the lower boundary and is heading towards a breakout, with a retest of the upper boundary expected.
The Relative Strength Index (RSI) is showing a downward trend, approaching the lower boundary, and an upward bounce is anticipated.
There is a key support zone in green at 75.00, and the price has bounced from this level several times and is expected to bounce again.
The indicator is showing a trend towards consolidation above the 100-period moving average, which we are approaching, supporting the upward move.
Entry Price: 78.30
First Target: 79.40
Second Target: 81.45
Third Target: 83.86
Stop Loss: Below the green support zone.
Remember this simple thing: Money management.
For any questions, please leave a comment.
Thank you.

Movement comparisonBitcoin and Monero have approximately the same amount of coins in circulation. Bitcoin has an average of 500,000 transactions daily, while Monero has around 20,000. The Monero ownership centralization is obvious, but not provable.
The two assets have significantly opposite price movement.
The LTCBTC/XMRBTC pair is at the channel top.
The XMRUSD/LTCUSD is retesting long-term support.
The channel has been violated, which possibly means a strong corrective wave in the opposite direction is coming. LTCBTC pair isn't looking great for now, but LTCUSD has been in slow upside movement with quite high usage for payments. The upcoming LitVM hype might have impact on the price, and will be produced by Lunar Digital Assets company in deal with Bitcoin OS and Litecoin Foundation. The LDA is a marketing company and they have made a lot of damage through previous projects thus exercise extreme caution.
The BTCUSD is searching for support on 1W and appears to be completing Elliot five wave impulse, and forming a running flat.
The XMRBTC is at strong long-term resistance, the BTCUSD has more momentum for breakout while grinding at the channel top, and taking under consideration the BTCUSD and XMRBTC are inversed, the BTCUSD seems a better choice for investment at this moment.
However, XMRUSD does seem like it could get a correction, but in smaller magnitude than XMRBTC, thus the XMRUSD price might stay elevated for the period while BTCUSD is in bullish rally.
Furthermore, the BTCUSD versus GOLD is also finding significant support. Countries and private companies are holding the BTCUSD positions. It is possible that in this year people will realize it is easier to keep safe and spend Bitcoin rather than physical gold. Gold appears to be a fear hedge, around 50% of yearly mined gold being used for production of jewelry while around 10% used in electronics production. Silver appreciation is fair. The world will continue further into finance digitalization. Production of physical goods should also get more appreciation in the following years.
Opinion - Good time to move XMR to BTC, even though XMR might make another leg, but less likely.

LTCUSDT (4H) chart update !!Litecoin is holding a strong demand zone around 76–80 and moving sideways under a long-term descending trendline.
A confirmed breakout above the trendline (~84) could trigger a bullish move toward 92, then 100, and ultimately 120.
If the price falls below the 76 support, the downside risk remains toward 69.
Bias: Neutral → Bullish on breakout.
DYOR | NFA.

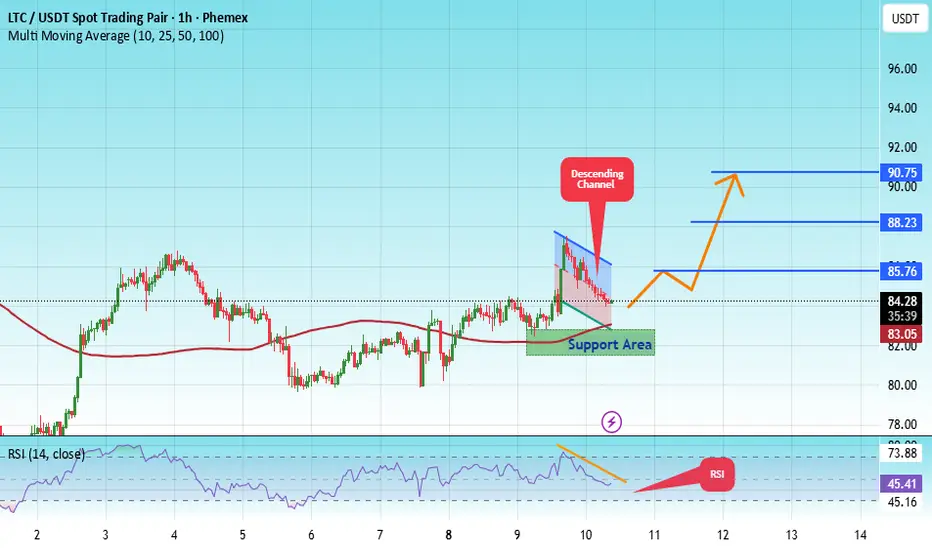
#LTC/USDT analysis.Give me some energy !!!#LTC
The price is moving in a descending channel on the 1-hour timeframe. It has reached the lower boundary and is heading towards breaking above it, with a retest of the upper boundary expected.
We have a downtrend on the RSI indicator, which has reached near the lower boundary, and an upward rebound is expected.
There is a key support zone in green at 82.00. The price has bounced from this level multiple times and is expected to bounce again.
We have a trend towards stability above the 100-period moving average, as we are moving close to it, which supports the upward movement.
Entry price: 84.29
First target: 85.76
Second target: 88.23
Third target: 90.75
Don't forget a simple principle: money management.
Place your stop-loss below the support zone in green.
For any questions, please leave a comment.
Thank you.
FireHoseReel | LTC:When does Litecoin explode next?🔥 Welcome to FireHoseReel!
Let’s dive into the 4H Litecoin (LTC) analysis.
👀 Litecoin is currently trading below a descending curve trendline.
Each time price hits this curve, it gets rejected to the downside. Price is now approaching the end of this compression zone, while a key support has formed at $81.48 near the bottom.
📊 Litecoin volume has been declining during the recent drop and is now at very low levels.
Once volume expands again, any upcoming move in LTC is likely to become more impulsive and powerful.
✅ The LTC/BTC pair is also in a strong corrective phase, showing a noticeable decline in Litecoin’s relative strength against Bitcoin.
✍️ You can review the main Litecoin scenarios below and use them alongside your own trading strategy if needed.
🟢 Long Scenario:
A breakout above the descending curve trendline, followed by a clean pullback, and then a push toward the static resistance at $87.42 with rising buy volume, could activate our long trigger.
🔴 Short Scenario:
A breakdown below the $81.48 support with a confirmed close below this level and increasing sell volume could activate our short trigger.
❤️ Risk Management & Emotional Discipline
Crypto trading is highly risky. Without proper risk management and emotional control, trading is no different from gambling.
Logic must always come before emotions. Learn to manage your trades—and enjoy the process of trading with control and discipline.


LTCUSDT : Full analysisHello friends
well you see that the power is in the hands of the sellers and we must have sufficient approvals to buy.
So you see, we have two important support areas that we have identified for you with Fibonacci, and they can be good supports. We need to see how buyers react in these areas.
Well, the next point is that despite the sharp drop in Bitcoin, Litecoin did not fall much. It fell by almost half of Bitcoin. Considering the previous times I saw that when Bitcoin fell, other currencies fell several times as much, and this is a good sign (meaning that its holders have a positive view of the currency).
But to buy, we need to know where and when to buy, to find the best point to buy and to take our profits at the best point. For this reason, we expect that Litecoin will most likely bottom out again and buy in support areas with risk and capital management and in steps And to move with the specified goals.
*Trade safely with us*

LTCBTC Monthly – Multi-Year Downtrend Nearing Exhaustion?RSI Structure Suggests a Major Reversal Brewing
Timeframe: 1M (Monthly)
LTCBTC has spent almost a decade grinding lower inside a clearly defined multi-channel descending structure. Every major rally has formed a lower high, respecting long-term trendlines dating back to 2014–2015.
Price is now compressing at the bottom of the macro falling wedge/channel, with volatility at historic lows and volume drying up—a structure that often precedes a major trend change.
📐 Price Structure
1. Macro Downtrend Channels
Red support line marks the absolute long-term floor, tested several times since 2023–2025.
Price is currently sitting right on that red long-term support, with early signs of demand returning.
2. Volume Profile
Volume has been steadily decreasing for years.
This type of volatility + volume contraction at major support has historically preceded large expansions (both bullish or bearish, but combined with RSI, the bullish case is stronger).
📊 RSI Momentum Analysis
This is the strongest part of the chart.
1. Long-Term RSI Downtrend (Orange)
RSI has been respecting a 10-year descending trendline, creating lower highs since 2017.
Price is approaching this trendline again from below.
A monthly breakout above this RSI resistance would be the first macro bullish confirmation in nearly a decade.
2. RSI Higher Lows (Red)
Despite price making flat or lower lows, RSI is making higher lows, creating:
A long-term bullish divergence
A tightening momentum structure, signaling diminishing seller strength
This is the exact structure seen before previous LTCBTC macro reversals.
📈 Bullish Case
If LTCBTC holds the red support and RSI continues upward:
Key bullish triggers:
🔵 Monthly RSI breakout above the orange resistance line
🟢 Monthly close above the orange descending price channel
🟩 Volume expansion returning after multi-year compression
Targets on breakout (from conservative to aggressive):
0.0022 (bottom of mid-green channel)
0.0040 (mid of macro channel)
0.0060–0.0080 (top of the long-term green channel)
📉 Bearish Case
If LTCBTC loses the red macro support:
Structure invalidation
Retest of historical lows
Continuation of multi-year bleed
This would require RSI also rejecting at the orange line and rolling over.
📌 Conclusion
LTCBTC is sitting on a once-per-cycle support zone while RSI prints a multi-year bullish divergence and approaches a key breakout trendline.
This is one of the most interesting long-term setups on the chart in 2025.
Price compression + RSI compression + long-term support often leads to explosive moves.
Not financial advice — just a chart-based idea.

LTCUSDT - Time to wake up for this Monster!As usual, any popular coin like LTC tends to make you lose hope right before a major rally — it usually forms a bearish-looking triangle, breaks downward, and makes everyone think a bear market has started.
Here’s how you know it’s actually preparing to pump:
It gives a very bearish signal on the chart — spot traders panic sell at a loss, long traders get liquidated or trapped, and short traders start feeling confident right before price reverses and pumps hard.
When everyone’s losing, that’s when the path upward becomes clear and safe.
I believe a 100% move from here is the minimum we’ll see.
Best Regards:
Ceciliones🎯
LTC : ETFHello friends
Due to the US government shutdown and the Lit coin ETF request that has been raised and is being reviewed, when the government and relevant institutions reopen, it is most likely that the ETF will be approved and expected. Now that the price has corrected and the good decline we had, there is a good opportunity to buy in steps in the specified areas with capital and risk management and move with it to the specified goals.
*Trade safely with us*

#LTC/USDT analysis.Give me some energy !!!#LTC
The price is moving within a descending channel on the 1-hour frame, adhering well to it, and is heading for a strong breakout and retest.
We have a bearish trend on the RSI indicator that is about to be broken and retested, supporting the upside.
There is a major support area (marked in green) at 107.50, which represents a strong basis for the upside.
For inquiries, please leave a comment.
We are in a consolidation trend above the 100 moving average.
Entry price: 111.15
First target: 112.80
Second target: 114.70
Third target: 117
Don't forget a simple matter: capital management.
When you reach the first target, save some money and then change your stop-loss order to an entry order.
For inquiries, please leave a comment.
Thank you.

LTC 4H Analysis - Key Triggers Ahead☃️ Welcome to the cryptos winter , I hope you’ve started your day well.
⏰ We’re analyzing LTC on the 4-Hour timeframe .
👀 After the sharp and deep drop that Litecoin experienced in 3 candles, it moved toward its key support in the $102 area and was well supported from this zone. Then it formed a higher low and higher high compared to its previous low and high, and it is now moving to break its resistance in the $107 area. With a 4-hour confirmation on this zone (the taker-seller and key resistance), it can move upward.
🧮 Two key zones are considered for the RSI oscillator: the 63 level, which is close to the 70 zone—if the volatility crosses this level, Litecoin can move toward overbought. The second zone is the entry threshold into oversold.
🕯 The size and volume of the candles in the recent drop, which can be considered a price correction, are really significant and large. Scattered sell orders are placed above the area we marked, which causes our green candles below this zone to appear a bit smaller. To break the specified taker-seller area, we need a large candle with relatively high volume that fully confirms (stabilizes) on this zone to shape our bullish and high-momentum trend.
💸 BINANCE:LTCBTC is bearish against the Bitcoin pair and has not turned bullish yet, but it is positioned a bit above its support floor. With a breakout of the taker-seller zone in the USDT pair, the Litecoin/Bitcoin pair might also turn bullish, which would increase the movement momentum and the size of the candles.
🧠 For a Litecoin long position, we have to wait until we confirm above this taker-seller area with a strong whale candle and then examine the available scenarios for the breakout.
↗️ Long position scenario: breaking the taker-seller area and key resistance at $107 along with whale candles, and then observing a multi–time frame indecision candle, which will also give us a smaller stop size.
📉 Short position scenario: if the market wants to give a heavy and strong correction, the $102 area can be a good zone for a floor break and a short position on this coin—but the important point for us is that Litecoin is about to start a good bullish trend.
❤️ Disclaimer : This analysis is purely based on my personal opinion and I only trade if the stated triggers are activated .

LTC SUPPORT AND RESISTACEHello friends
Due to the rise we had, the price is in a correction phase and now we have identified the support areas for you that can move to the set targets if they stabilize in these areas and the specified resistance is broken.
*Trade safely with us*

LTCUSDTI think the BINANCE:LTCUSDT price 📈 may pull back to $110.60 before pumping to higher levels 🚀.
Watch for reactions at $116.50 and $128.20 🔍 — key decision zones.
Supports: $116.50 – $110.60 – $104.60 🛡️
Resistance: $128.20 – $140 🏔️
Manage your risk ⚠️.

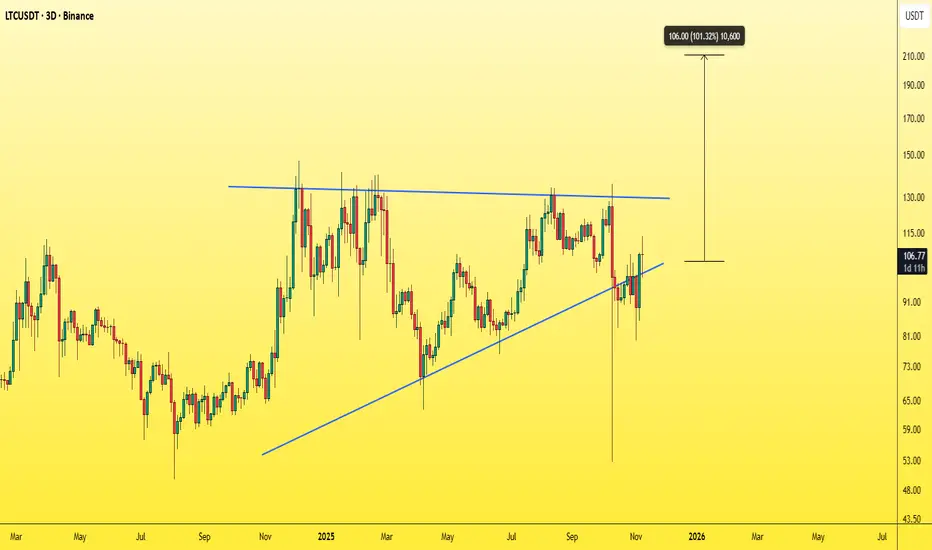
LTC (the most dangerous chart in crypto)LTC / USDT
8 years of accumulation in this triangle and price is being squeezed around apex.. What is the result of this long accumulation?
It reminds me of XRP chart before the big breakout in last November
Keep an eye of it…

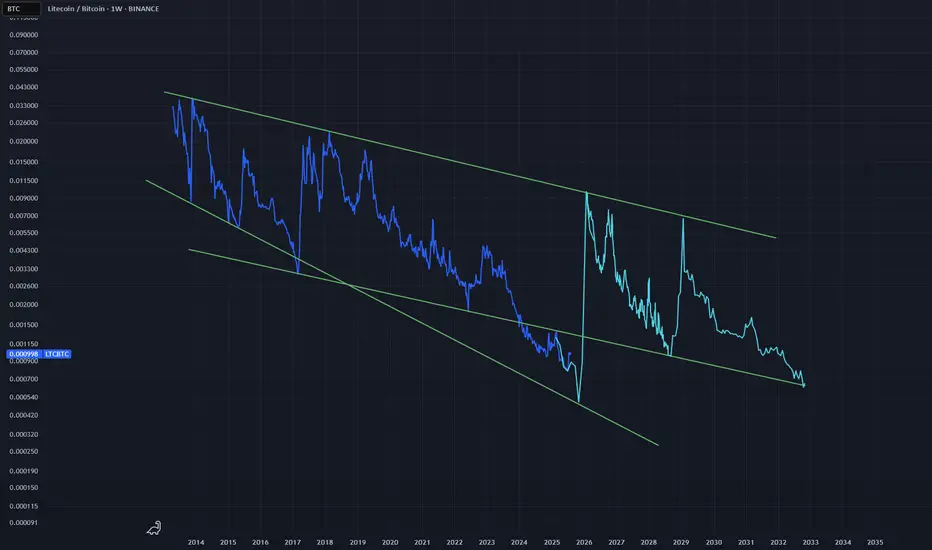
LTCBTC Secular Low launching into the Golden Ratio.One of the biggest sleepers in the cryptoverse. Watch it launch into the Golden Ratio as BTC calms down into the 161.8 grand mark.
Not too sure where the bottom is for LTCBTC, but who cares? The final trajectory here looks to be around 0.01, which puts LTCUSD around $1618 per piece.
This is in fact the silver bullet that will kill the upcoming altseason - be forewarned.
When YouTubers Say 'No'… We Say 'LTC Go!'I’m not here to drop some fancy technical analysis today.
I’m here to tell you… this might just be it.
A big, popular YouTube channel just announced they’re not too bullish on Litecoin this cycle.
And guess what? That might actually be our ultimate buy signal.
The chart’s looking bullish now — the trap has been set, and left behind us. 😎
They FUD, We Flood (Our Bags)
Why Litecoin? Beyond its unshakable fundamentals, if you genuinely understand and believe in crypto and digital freedom, Litecoin is the purest expression of that vision
That's it, that's the idea" - Good night !

Litecoin:Is the main climb coming?hello friends👋
As you can see, the price, after falling in the support area specified by the buyers, has been supported and returned, forming an upward pattern.
Now we don't enter into a transaction with just one pattern, we also check the entry of buyers and the amount of currency and other factors and draw conclusions.
According to the points we have said, we have identified very important support points for you to buy step by step with capital and risk management and move to the specified goals.
🔥Follow us for more signals 🔥
*Trade with us safely*

LTC, he Hidden Strength Beneath the Retrace Ma dudes, we might just be witnessing something big and beautiful here. 🤌✨
Okay okay, I might sound like a total degen, but hear me out:
✅ Double bottom (check those two green arrows)
✅ Bullish divergence on the RSI
✅ MACD on the monthly just crossed bullish — for the first time ever on this pair!
✅ OBV stayed strong, didn’t collapse even during that nasty monthly retrace
✅ Notice how volume was climbing during the uptrend, but fell off during the retrace? That means the drop lacked real conviction.
We’re also sitting at an ATL (all-time low) — the lowest we've been.
Check out that red arrow pointing at the volume: that's the first sign of a burst. The next bursts? 💥 They should be explosive.
…And that’s just to name a few.
See you somewhere up there 🚀 — once we break through that T1 level, we should start trending higher fast.
That's it, that's the idea" - Good night !

Litecoin vs Bitcoin —The Institutional Wave? Consider the ETFsStarting November 2022 LTCBTC (Litecoin vs Bitcoin) went on a major downtrend, until November 2024. After November 2024 this downtrend is no more.
There was a bounce late last year and this event changed the chart. The latest low last month, June 2025, ended up as a technical double-bottom. Less than 5% below the November 2024 low and this low happened after 217 days. This means that in seven months sellers became exhausted and they couldn't produce a new major low. This reveals that the bearish trend is over. Once the downtrend ends, we get a change of trend, a change of trend implies an uptrend, an uptrend implies long-term growth. We are looking at a long-term bottom and... From the bottom we grow.
This is not an opportunity that presents itself often. The BTC trading pairs are hard to trade. These are for experts only. A new opportunity is developing that can lead to exponential growth. It is amazing how this section of the market works. LTCBTC will grow as Bitcoin and the rest of the market grows. This tends to produce a multiplier effect that is hard to explain. You will understand when you see it in action.
LTCBTC is hitting bottom. The bottom is already established, several weeks old. The candles low is flat, we can expect massive growth; excitement and institutional adoption on Litecoin thanks to the ETFs, it will be the first time this pair grows in years and the type of chart it will produce it is hard to tell.
We are entering uncharted territory. The bullish phase can be mild just as it can be ultra-strong. There is no limit to the upside. It can grow for years or for 4 to 8 months. Both scenarios look good.
The best part is to catch the bottom; an early wave. Prices are low now, easy to buy and hold. Focus on the long-term.
Litecoin has good potential for this incoming 2025 bull market.
Thank you for reading.
Namaste.

#LTC/USDT#LTC
The price is moving within a descending channel on the 1-hour frame, adhering well to it, and is heading for a strong breakout and retest.
We are seeing a bounce from the lower boundary of the descending channel, which is support at 92.48.
We have a downtrend on the RSI indicator that is about to be broken and retested, supporting the upward trend.
We are looking for stability above the 100 moving average.
Entry price: 97.44
First target: 100.24
Second target: 102.45
Third target: 105.26
