The start of something great is brewingLitecoin is showing clear signs of an automatic rally. This is the things you look for if the price moves lower.
1. One or Two breaks below the current low with the price bouncing back into the range after every low, this is a clear sign of accumulation.
2. Price moving to the top of the range after the spring has formed.
So I will only be bullish after I see the accumulation pattern play out.
Trade safe
LTCUSD

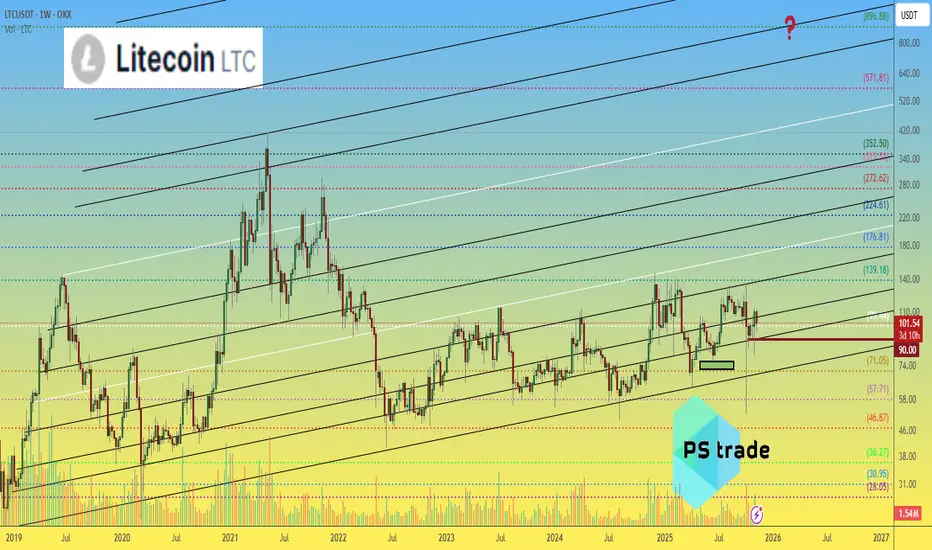
Litecoin LTC price analysis📉 For weeks, OKX:LTCUSDT has been holding strong
And guess what — this consolidation has lasted over 3.5 years! 😮
💭 The last real pump was back in early 2021... feels like it’s time for a sequel, right? 😉
Now, here’s the interesting part:
🔹 Litecoin has the same tokenomics and mining method as Bitcoin ( CRYPTOCAP:BTC ) and
🔹 Recently, another “old school” coin — CRYPTOCAP:ZEC — just pumped hard 💥
🔹 And there are rumors about a potential LTC ETF 😏
With a current market cap of only $7.7B, there’s plenty of room to grow.
So maybe... just maybe... CRYPTOCAP:LTC at $900 isn’t that crazy after all? 🚀
What do you think — are we on the verge of a new #Litecoin era? 👇
______________
◆ Follow us ❤️ for daily crypto insights & updates!
🚀 Don’t miss out on important market moves
🧠 DYOR | This is not financial advice, just thinking out loud
#LTC/USDT analysis.Give me some energy !!!#LTC
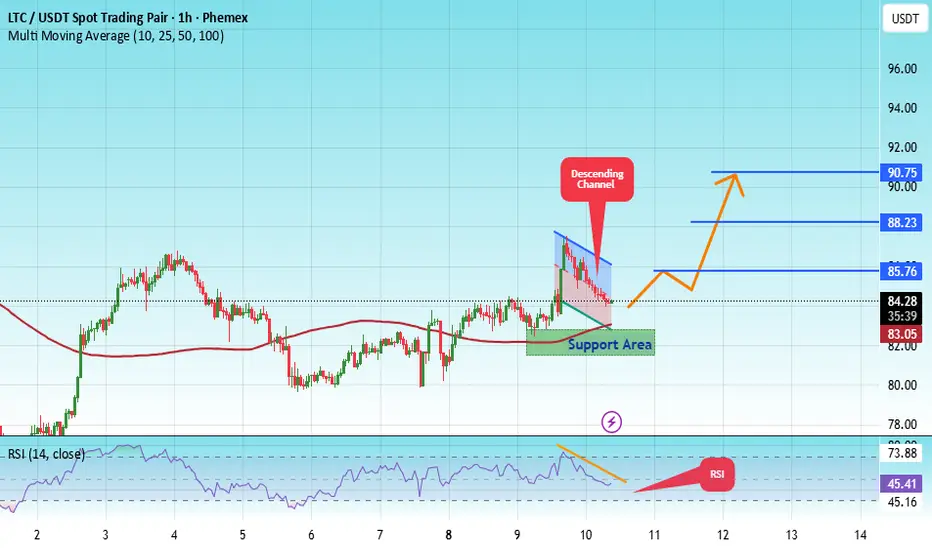
The price is moving within a descending channel on the hourly timeframe. It has reached the lower boundary and is heading towards a breakout, with a retest of the upper boundary expected.
The Relative Strength Index (RSI) is showing a downward trend, approaching the lower boundary, and an upward bounce is anticipated.
There is a key support zone in green at 75.00, and the price has bounced from this level several times and is expected to bounce again.
The indicator is showing a trend towards consolidation above the 100-period moving average, which we are approaching, supporting the upward move.
Entry Price: 78.30
First Target: 79.40
Second Target: 81.45
Third Target: 83.86
Stop Loss: Below the green support zone.
Remember this simple thing: Money management.
For any questions, please leave a comment.
Thank you.

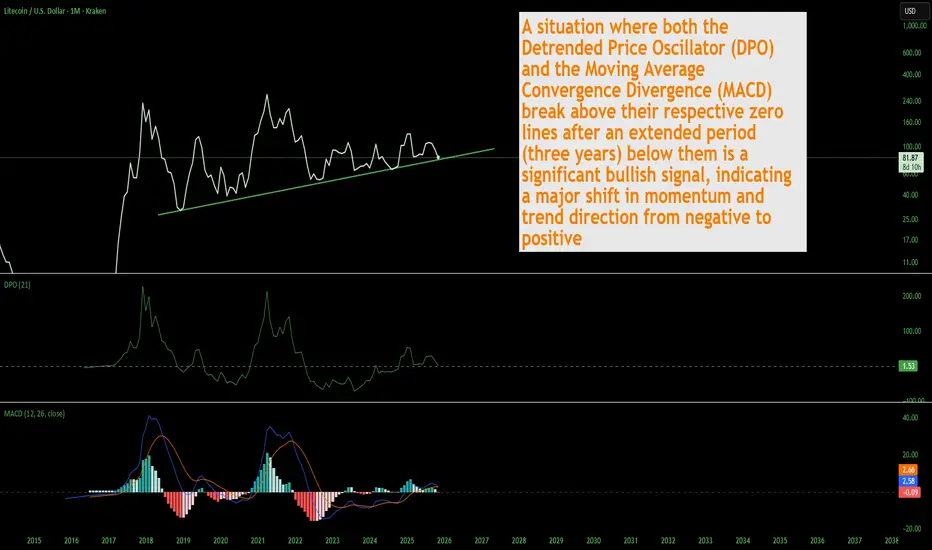
Litecoin: The Next PumpAfter years of posting my Monero KRAKEN:XMRUSD thesis based on its privacy use case it has finally catapulted into new All Time Highs and entered "price discovery."
So I now look to what is next... focusing on
PATTERN RECOGNITION
FUNDAMENTALS: PRIVACY
THE TRADE
Pattern Recognition
A recent post by Peter Brandt got me to check old, long dormant cryptocurrencies and I checked Litecoin $KRAKEN:LTCUSD.
At first glance of the long term historic chart I can't help but notice the eerie similarity between Litecoin and two other recent random pumps:
Silver and Monero
These are assets with history of sporadic, massive volatility pumps that come after long periods of low volatility price action. Imagine spotting the next big pump before the crowd. That is what I imagine when I see a chart that looks like Litecoin right now.
Fundamentals: Privacy Coins
I attribute my success in going all-in on Monero to identifying the market change to valuing privacy coins early (3 years ago). It became clear to me that this use case was NOT being services by Bitcoin.
There is value in privacy.
Monero is "privacy by default". I'm not even going to waste time with the centralized "Z". But then there is Litecoin.
Litecoin's Mimblewimble Extension Blocks (MWEB) provide optional on-chain privacy by hiding transaction amounts and breaking linkability between senders and receivers through confidential transactions, stealth addresses, and native mixing features. This opt-in upgrade keeps the main chain transparent while enabling private, fungible transfers in a parallel secure layer—perfect for cash-like digital payments without sacrificing Litecoin's speed or low fees.
Litecoin is the smart, optional privacy play that keeps things fast and cheap—value in privacy, without the hassle. And most importantly Litecoin is ubiquitously listed on every exchange. It arguably has more potential speculative inflows than Monero which is widely DE-listed.
The Trade:
As a trader what interests me the most is DEFINED RISK. And Litecoin stands out extremely well in this regard because of October 10th:
The October 10th, 2025 liquidation event - brought on by a random US market closed Friday evening Tweet by Trump - sent a shockwave across the cryptocurrency market. It liquidated billions in leveraged longs and put some market makers out of business.
But it did something of incredible importance to us NOW: It defines where price should not go.
Liquidations remove the excess leverage and stupidity of the market. Those traders are out, with less money, and frustrated. They are no longer there to fade rallies and may even FOMO back in when price finally goes the way they wanted. It's market psychology.
Defined risk means you sleep easy—knowing exactly where to cut losses, while the upside plays out. If one sets a stop below major liquidation spikes it is a very effective true level to GET OUT of a trade. Because once the leverage is removed AND price still continues on its downward path you can be confident that the bear trend is actually REAL.
"You know where your stop needs to be"
Here are a few examples I can recall off the top of my head:
The same October 10th, 2025 Spike on Bitcoin:
The December 2021 Spike that ended the last Bull cycle. A historic example with the same result.
We never can know for sure what will pump or dump but the patterns of price action around liquidation spikes let us know "Where our stop needs to be."
So from a place of knowing where to get out of a trade we can size our risk. Then all we have to do is wait for upside.
Trade wisely.

LTCUSDT - Symmetrical Triangle: Breakout or Breakdown?Litecoin (LTC/USDT) on the Weekly (1W) timeframe is currently in a long-term consolidation phase following a major decline from its previous cycle high. Price action is becoming increasingly compressed and is now approaching the apex of a large structure, signaling an upcoming major directional move.
The current price is trading around $82–85, positioned near the middle of the triangle, which represents a critical decision zone for the market.
---
Pattern Explanation
The chart is forming a large Symmetrical Triangle, characterized by:
Lower highs → descending resistance (upper yellow trendline)
Higher lows → ascending support (lower yellow trendline)
Pattern structure developing from 2022 through early 2026
Gradually declining volume → a typical sign of market compression before a breakout
A Symmetrical Triangle is a neutral continuation pattern, meaning the next major move will be determined by a confirmed breakout or breakdown.
---
Key Levels
Major Resistance Levels:
$95 – $100 → minor resistance / mid-range area
$120 → strong historical resistance
$134 → major supply zone
$281 → long-term major resistance / macro target
Major Support Levels:
$82 – $80 → current support zone
$63 → structural support
$40 → swing low / extreme downside support
---
Bullish Scenario
The bullish scenario will be confirmed if:
1. Price breaks above the descending trendline
2. A weekly close above resistance, supported by increasing volume
Bullish Targets (Step-by-Step):
$95 – $100 (initial target)
$120 – $134 (major distribution zone)
$180 – $280 (measured move of the triangle if bullish continuation occurs)
A confirmed breakout could mark the start of a new medium- to long-term uptrend.
---
Bearish Scenario
The bearish scenario becomes valid if:
1. Price fails to break resistance
2. A weekly close below the ascending support trendline
Bearish Targets (Step-by-Step):
$63 → key support
$40 → historical lower boundary
A breakdown from this structure would suggest a continuation of bearish or prolonged sideways conditions.
---
Conclusion
LTC is currently trading within a major decision zone on the weekly timeframe.
Traders and investors are advised to wait for clear confirmation, rather than anticipating direction inside the triangle.
➡ Breakout = potential start of a new bullish trend
➡ Breakdown = risk of further downside or extended consolidation
Patience is crucial during high-compression market phases like this.
---
#LTCUSDT #Litecoin #Altcoin #CryptoMarket
#CryptoAnalysis #AltcoinAnalysis #WeeklyChart
#SymmetricalTriangle #TrianglePattern #TriangleBreakout

LTCUSDT | Bullish run continues? (READ THE CAPTION)In the 2H chart of LTCUSDT, we can see that Litecoin has been on a bullish run in the past couple of days, going from 76.08 all the way to 82.82, and after hitting the FVG, it has dropped in price to 81.50 and is being traded there.
If it drops further, I expect a reaction to the Bullish Breaker. Otherwise, I expect it to challenge the FVG yet again.
Bearish Targets: 81, 80.60, 80.20 and 79.80.
Bullish Targets: 82, 82.40, 82.80 and 83.20.

Movement comparisonBitcoin and Monero have approximately the same amount of coins in circulation. Bitcoin has an average of 500,000 transactions daily, while Monero has around 20,000. The Monero ownership centralization is obvious, but not provable.
The two assets have significantly opposite price movement.
The LTCBTC/XMRBTC pair is at the channel top.
The XMRUSD/LTCUSD is retesting long-term support.
The channel has been violated, which possibly means a strong corrective wave in the opposite direction is coming. LTCBTC pair isn't looking great for now, but LTCUSD has been in slow upside movement with quite high usage for payments. The upcoming LitVM hype might have impact on the price, and will be produced by Lunar Digital Assets company in deal with Bitcoin OS and Litecoin Foundation. The LDA is a marketing company and they have made a lot of damage through previous projects thus exercise extreme caution.
The BTCUSD is searching for support on 1W and appears to be completing Elliot five wave impulse, and forming a running flat.
The XMRBTC is at strong long-term resistance, the BTCUSD has more momentum for breakout while grinding at the channel top, and taking under consideration the BTCUSD and XMRBTC are inversed, the BTCUSD seems a better choice for investment at this moment.
However, XMRUSD does seem like it could get a correction, but in smaller magnitude than XMRBTC, thus the XMRUSD price might stay elevated for the period while BTCUSD is in bullish rally.
Furthermore, the BTCUSD versus GOLD is also finding significant support. Countries and private companies are holding the BTCUSD positions. It is possible that in this year people will realize it is easier to keep safe and spend Bitcoin rather than physical gold. Gold appears to be a fear hedge, around 50% of yearly mined gold being used for production of jewelry while around 10% used in electronics production. Silver appreciation is fair. The world will continue further into finance digitalization. Production of physical goods should also get more appreciation in the following years.
Opinion - Good time to move XMR to BTC, even though XMR might make another leg, but less likely.

LTC/USDT — Falling Wedge Formation Signals Potential ReversalOn the 8-hour timeframe, Litecoin (LTC) remains in an overall downtrend. However, the price structure is not moving in parallel lines, indicating that this is not a descending channel. The upper resistance trendline is steeper than the lower support trendline, signaling weakening bearish momentum.
Price is currently trading near the final phase of the pattern, approaching the apex, where a strong directional move (breakout or breakdown) is likely to occur.
---
Pattern & Price Structure
Pattern Identified: Falling Wedge (Bullish Reversal Pattern)
Key characteristics visible on the chart:
Continuous lower highs, forming a sharply declining resistance
Lower lows, but with decreasing downside momentum
Price compression, indicating reduced selling pressure
Non-parallel trendlines, distinguishing it from a descending channel
Technically, a falling wedge forming within a downtrend often precedes a bullish trend reversal, pending confirmation.
---
Key Levels
Support Zones:
80.0 USDT (current reaction zone)
76.0 – 72.6 USDT (major support & pattern invalidation level)
Resistance Zones:
85.8 USDT (near-term resistance)
93.5 – 96.5 USDT (key structural resistance)
104 – 110 USDT (major supply zone)
---
Bullish Scenario
The bullish scenario becomes valid if:
1. Price breaks above the falling wedge resistance
2. An 8H candle closes above 85.8 USDT
3. The market prints a first higher high as confirmation
Bullish Targets:
93.5 – 96.5 USDT
104 USDT
110 USDT (if momentum strengthens)
A confirmed breakout would suggest a shift from bearish control to recovery phase.
---
Bearish Scenario (Pattern Invalidation)
The bearish scenario occurs if:
Price fails to break out from the wedge
76 USDT support is broken with strong volume
Bearish Targets:
72.6 USDT
Extension toward the 70 USDT area if selling pressure accelerates
Such a move would invalidate the falling wedge and confirm bearish continuation.
---
Conclusion
Price action aligns more accurately with a falling wedge
The pattern suggests potential bullish reversal, but:
Confirmation is mandatory
Until a breakout occurs, the dominant trend remains bearish
The optimal approach is to wait for confirmation rather than anticipate.
---
#LTC #Litecoin #LTCUSDT #FallingWedge #BullishReversal #CryptoAnalysis #TechnicalAnalysis #Altcoin #CryptoTrading

LTCUSD | Reality Check — Liquidity Hasn’t Been TakenHello traders,
I’m not bullish on LTC yet. You shouldn't be either.
1W TF for LTC is still as bearish as it gets. Massive stop loss orders for buyers are setting below $63.
The structure is clear: before any real bullish expansion, sell-side liquidity must be swept.
This historical uptrend is where long-term positioning gets reset. Every strong run LTC ever had came after price touched that line, shook out weak hands, and re-accumulated.
Remember this period (Q4, 2026)
📍 Levels I’m watching
Buy zone (sell-side sweep):
$63 – $50
This is where I’ll be interested, not before.
Sell targets (buy-side liquidity):
$136 - $147
From now on during 2026 bearish market, any price up will be a reset chance.
Good Luck!
If you find this useful, hit a like, drop a comment and follow for more

LTC/USDT — Market StructureThe resistance block and the channel midline proved too strong — after another test, price moved into a correction.
The $70–95 range is the most heavily traded zone, where position building is taking place.
A bullish wedge is currently forming within this range.
Trade options:
— accumulate inside the pattern with a mandatory stop-loss below it;
— or wait for a confirmed breakout above the wedge’s upper boundary and enter on confirmation.
🎯 Primary targets: $93 and $110.
Long-term targets should be considered only after a sustained break and hold above $150.

Litecoin - Long-Term Bearish Structure, New Cycle Low ExpectedDuring previous bull runs (2017 and 2021) , Litecoin consistently made new all-time highs , breaking above prior peaks. However, an important historical pattern stands out: each bear market formed higher lows , suggesting long-term range compression.
At the current stage, this structure appears to be changing. Price remains in a prolonged consolidation phase, and a bear flag has formed on the monthly timeframe, which is a classic bearish continuation pattern following a strong downside impulse.
Based on the overall market cycle structure and historical behavior, I expect a breakdown below previous bear market lows, with a new cycle bottom forming in the $24–20 range.
Key factors:
Clear bear flag on the 1M timeframe
Lack of a sustained uptrend since the 2021 peak
Weak bullish momentum and distribution structure
Market cycle dynamics
Cycle outlook:
2026 is expected to be a bearish year, potentially marking the final phase of this downtrend and the establishment of a macro bottom.
Invalidation:
A sustained breakout and hold above the upper boundary of the monthly bear flag would invalidate this bearish scenario.
This idea is designed for long-term traders and investors who analyze the market through cycle behavior and macro structure, rather than short-term price fluctuations.

LTC: Breakout Before Altcoin SeasonPrice has been moving inside a large 3‑month symmetrical triangle, with lower highs from the 2017 peak and higher lows since the 2018 bottom.
The current candle is compressing between the support and resistance trendlines, suggesting a larger move is getting closer.
A confirmed breakout above the triangle resistance and the 0.5–0.618 Fib would open the way toward the marked profit zone in the 0.65–0.786 area (~185–255 USD), where previous supply sits.
As long as the higher‑low structure holds, the bias remains bullish; a clean weekly/3M close back below the triangle support would invalidate this idea and shift the focus back toward the 40–50 USD zone.
Litecoin often behaves as a “mid‑cap beta play” between Bitcoin and smaller alts: when BTC stabilizes and capital starts rotating out along the risk curve, LTC is one of the first large caps to wake up. A strong, high‑timeframe breakout on Litecoin can therefore be an early sign that market participants are ready to take more risk, paving the way for a broader altcoin season.

LTCUSD H4 | Bearish ContinuationMomentum: Bearish
Price may retrace to the sell entry, which aligns with the 38.2% Fibonacci retracement, adding significant strength to this level.
Sell Entry: 79.61
Pullback resistance
38.2% Fibonacci retracement
Stop Loss: 86.49
Pullback resistance
Take Profit: 71.03
Pullback support
High Risk Investment Warning
Stratos Markets Limited (tradu.com ), Stratos Europe Ltd (tradu.com ):
CFDs are complex instruments and come with a high risk of losing money rapidly due to leverage. 70% of retail investor accounts lose money when trading CFDs with this provider. You should consider whether you understand how CFDs work and whether you can afford to take the high risk of losing your money.
Stratos Global LLC (tradu.com ): Losses can exceed deposits.
Please be advised that the information presented on TradingView is provided to Tradu (‘Company’, ‘we’) by a third-party provider (‘TFA Global Pte Ltd’). Please be reminded that you are solely responsible for the trading decisions on your account. Any information and/or content is intended entirely for research, educational and informational purposes only and does not constitute investment or consultation advice or investment strategy. The information is not tailored to the investment needs of any specific person and therefore does not involve a consideration of any of the investment objectives, financial situation or needs of any viewer that may receive it. Past performance is not a reliable indicator of future results. Actual results may differ materially from those anticipated in forward-looking or past performance statements. We assume no liability as to the accuracy or completeness of any of the information and/or content provided herein and the Company cannot be held responsible for any omission, mistake nor for any loss or damage including without limitation to any loss of profit which may arise from reliance on any information supplied by TFA Global Pte Ltd.

LTC is going up or down ? Answer is be patience I still consider the LTC a Buy, for a potential of good returns and growth by 2027. At present it looks like many manipulators raising the fear index and making price fail under low volatility conditions. If we have to not fall in trap the only way is to stay patience even it shows a sharp fall to 65. Don’t make panic selling and account losses on your ledger. Let the market stable. Consider your 2x to 4x returns only by 2027 and stay quiet for now.
Just my opinion, be cautious on your investment strategy decisions.

#LTC/USDT analysis.Give me some energy !!!#LTC
The price is moving in a descending channel on the 1-hour timeframe. It has reached the lower boundary and is heading towards breaking above it, with a retest of the upper boundary expected.
We have a downtrend on the RSI indicator, which has reached near the lower boundary, and an upward rebound is expected.
There is a key support zone in green at 82.00. The price has bounced from this level multiple times and is expected to bounce again.
We have a trend towards stability above the 100-period moving average, as we are moving close to it, which supports the upward movement.
Entry price: 84.29
First target: 85.76
Second target: 88.23
Third target: 90.75
Don't forget a simple principle: money management.
Place your stop-loss below the support zone in green.
For any questions, please leave a comment.
Thank you.
LITECOIN can easily hit $43 in the next 10 months.Litecoin (LTCUSD) started its new Bear Cycle after a rejection on the 4-year Lower Highs trend-line. Now that it sits below its 1W MA200 (orange trend-line), which was formally a Resistance during the Bull Cycle, we can claim that the next stage should be targeting the Higher Lows 1 trend-line.
Given that all previous Bear Cycles lasted for at least a year and that the last one dropped less than the 2018, we can expect LTC's new Bear Cycle to last up until August 2026 at least. Even a 'modest' decline should still see it targeting Higher Lows trend-line 2, which by the end of August 2026 should have hit $43.00 at least.
---
** Please LIKE 👍, FOLLOW ✅, SHARE 🙌 and COMMENT ✍ if you enjoy this idea! Also share your ideas and charts in the comments section below! This is best way to keep it relevant, support us, keep the content here free and allow the idea to reach as many people as possible. **
---
💸💸💸💸💸💸
👇 👇 👇 👇 👇 👇

FireHoseReel | LTC:When does Litecoin explode next?🔥 Welcome to FireHoseReel!
Let’s dive into the 4H Litecoin (LTC) analysis.
👀 Litecoin is currently trading below a descending curve trendline.
Each time price hits this curve, it gets rejected to the downside. Price is now approaching the end of this compression zone, while a key support has formed at $81.48 near the bottom.
📊 Litecoin volume has been declining during the recent drop and is now at very low levels.
Once volume expands again, any upcoming move in LTC is likely to become more impulsive and powerful.
✅ The LTC/BTC pair is also in a strong corrective phase, showing a noticeable decline in Litecoin’s relative strength against Bitcoin.
✍️ You can review the main Litecoin scenarios below and use them alongside your own trading strategy if needed.
🟢 Long Scenario:
A breakout above the descending curve trendline, followed by a clean pullback, and then a push toward the static resistance at $87.42 with rising buy volume, could activate our long trigger.
🔴 Short Scenario:
A breakdown below the $81.48 support with a confirmed close below this level and increasing sell volume could activate our short trigger.
❤️ Risk Management & Emotional Discipline
Crypto trading is highly risky. Without proper risk management and emotional control, trading is no different from gambling.
Logic must always come before emotions. Learn to manage your trades—and enjoy the process of trading with control and discipline.

Litecoin LTC/USD Buy The Fear Sell The EuphoriaI haven't made a Litecoin chart in a while. We've been sideways and uneventful, figured I would wait till something eventful happens. Well here it is folks , the moment before we actually move up everyone is selling except for a few smart hands. This fractal says it all in my opinion. fractals are usually very similar but not exact. Where we are now in price for Litecoin around 83 is really close to the bottom of this pullback. It washed out and cleaned up all the leverage, a very common occurrence in this market before large moves up. The move will be absolutely explosive and probably no meaningful pullback until we break the all time high. I see a pullback to retest the high before the next massive leg up.
Right now in my opinion is the worst place to sell. I know this "bear market" is not a real bear market because of how many people are saying it is. The whole world says its a bear market right now, every youtube grifter has pivoted to bear market recently with this drop, every news channel is saying it is. Thats why its not, most have sold already and now the price I believe will rebound so fast it'll shock everyone and the ones who sold will be in denial waiting for the "next low". When that low doesn't come and we break the highs they will all pile back in.
Everyone says oh this moving average, or this indicator, or this RSI. Look its all helpful stuff but its also all imaginary lines. Who says that we MUST be in a bear market because we broke a 200 day moving average. Who says because RSI is overbought we must go down. RSI has infinite different adjustments so whos to say that the 14 length is correct? These indicators will begin to fail over time as more and more people look at them. Right now there is more traders and wanna be traders in the world than ever before so if everyone is looking at the same thing all the time then most likely those will start to fail. Oh its happened every time before , I know , I know. Come on at the end of the day Bitcoin is still in its infancy. I dont buy the four year cycle, or seasonality crap, its foolish and betting your portfolio on those factors alone is a recipe for BROKE! I still stand by my previous long term predictions. Obviously its taking much longer than I expected but timing these things is nearly impossible on the long term time frame. While all the youtube grifters flip flop weekly I listen to the Billonaires and people who MAKE the markets. Saylor said three days ago the pullback is almost over and hes buying. Blackrocks Robbie Mitchnick says this is a good buying area and thats just a couple theres dozens of big wigs saying the same thing.
So to wrap this up I believe we are at the point of rocket ship. Look at economic factors, liquidity worldwide is expanding, stimulus is coming, tightening is ending, rates are coming down. Fiat currencies worldwide are about to go into hyperinflation and certain cryptos will reap the benefit of that. Bitcoin and Litecoin being the top gainers in this next phase of hyperinflation in my opinion. This is just my opinion and not financial advice. Thank you

Litecoin: Target Zone Within ReachLTC has recently continued its decline, leading us to believe that the high for green wave B is likely already in place. Price is now just a short distance from our green Target Zone, which ranges from $78.52 to $64.53. Within this zone, we expect to see the low of orange wave ii. Afterward, orange wave iii should drive price above the resistance levels at $118.71 and $147.06.

LTC Litecoin Poised For Something Big Macro Style I still see lots of people selling and capitulating. Thats ok that cant be prevented, most have no idea how markets work and those same people are afraid of their own shadow. The capitulation is almost over. I just want to point out the confluence of various indicators on the macro long term time frame pointing to a massive bull run for Litecoin. This is not financial advice just my opinion. Like and follow for more updates.
LITECOIN Analysis (4H)It appears that a double correction is forming on Litecoin and is nearing completion. Around the origin zone, we can look for long buy positions so that once this second corrective leg finishes, the price can enter a bullish phase.
The entry zone and targets are marked on the chart.
For risk management, please don't forget stop loss and capital management
When we reach the first target, save some profit and then change the stop to entry
Comment if you have any questions
Thank You

LTCUSD - Symmetrical Triangles As seen in the first symmetrical triangle a massive break out followed
If the second is anything like the first we can expect a breakout like that one
I have posted this chart before but it really is a strong bull option for a long term altcoin.
Weekly timeframe

LTCUSD H4 | Could We See A Bullish Reversal?Momentum: Bullish
The price has recently bounced off the identified buy-entry level, which aligns with the pullback support zone.
Buy Entry: 889.05
Pullback support
Stop Loss: 79.91
Swing-low support
Take Profit: 102.38
Pullback resistance
Positioned slightly below the 61.8% Fibonacci retracement
High Risk Investment Warning
Stratos Markets Limited (tradu.com ), Stratos Europe Ltd (tradu.com ):
CFDs are complex instruments and come with a high risk of losing money rapidly due to leverage. 70% of retail investor accounts lose money when trading CFDs with this provider. You should consider whether you understand how CFDs work and whether you can afford to take the high risk of losing your money.
Stratos Global LLC (tradu.com ): Losses can exceed deposits.
Please be advised that the information presented on TradingView is provided to Tradu (‘Company’, ‘we’) by a third-party provider (‘TFA Global Pte Ltd’). Please be reminded that you are solely responsible for the trading decisions on your account. Any information and/or content is intended entirely for research, educational and informational purposes only and does not constitute investment or consultation advice or investment strategy. The information is not tailored to the investment needs of any specific person and therefore does not involve a consideration of any of the investment objectives, financial situation or needs of any viewer that may receive it. Past performance is not a reliable indicator of future results. Actual results may differ materially from those anticipated in forward-looking or past performance statements. We assume no liability as to the accuracy or completeness of any of the information and/or content provided herein and the Company cannot be held responsible for any omission, mistake nor for any loss or damage including without limitation to any loss of profit which may arise from reliance on any information supplied by TFA Global Pte Ltd.
