LTCUSDT - Symmetrical Triangle: Breakout or Breakdown?Litecoin (LTC/USDT) on the Weekly (1W) timeframe is currently in a long-term consolidation phase following a major decline from its previous cycle high. Price action is becoming increasingly compressed and is now approaching the apex of a large structure, signaling an upcoming major directional move.
The current price is trading around $82–85, positioned near the middle of the triangle, which represents a critical decision zone for the market.
---
Pattern Explanation
The chart is forming a large Symmetrical Triangle, characterized by:
Lower highs → descending resistance (upper yellow trendline)
Higher lows → ascending support (lower yellow trendline)
Pattern structure developing from 2022 through early 2026
Gradually declining volume → a typical sign of market compression before a breakout
A Symmetrical Triangle is a neutral continuation pattern, meaning the next major move will be determined by a confirmed breakout or breakdown.
---
Key Levels
Major Resistance Levels:
$95 – $100 → minor resistance / mid-range area
$120 → strong historical resistance
$134 → major supply zone
$281 → long-term major resistance / macro target
Major Support Levels:
$82 – $80 → current support zone
$63 → structural support
$40 → swing low / extreme downside support
---
Bullish Scenario
The bullish scenario will be confirmed if:
1. Price breaks above the descending trendline
2. A weekly close above resistance, supported by increasing volume
Bullish Targets (Step-by-Step):
$95 – $100 (initial target)
$120 – $134 (major distribution zone)
$180 – $280 (measured move of the triangle if bullish continuation occurs)
A confirmed breakout could mark the start of a new medium- to long-term uptrend.
---
Bearish Scenario
The bearish scenario becomes valid if:
1. Price fails to break resistance
2. A weekly close below the ascending support trendline
Bearish Targets (Step-by-Step):
$63 → key support
$40 → historical lower boundary
A breakdown from this structure would suggest a continuation of bearish or prolonged sideways conditions.
---
Conclusion
LTC is currently trading within a major decision zone on the weekly timeframe.
Traders and investors are advised to wait for clear confirmation, rather than anticipating direction inside the triangle.
➡ Breakout = potential start of a new bullish trend
➡ Breakdown = risk of further downside or extended consolidation
Patience is crucial during high-compression market phases like this.
---
#LTCUSDT #Litecoin #Altcoin #CryptoMarket
#CryptoAnalysis #AltcoinAnalysis #WeeklyChart
#SymmetricalTriangle #TrianglePattern #TriangleBreakout
Ltcusdidea

LTCUSDT Bullish Structure – Is This the Next Expansion Leg?📊 LTC/USDT "DIGITAL SILVER" BULLISH BREAKOUT 🚀 | Swing Trade Profit Setup
🎯 TRADE OVERVIEW
Asset: Litecoin vs Tether (LTC/USDT)
Timeframe: 4H / Daily
Current Price: $77.32 USDT
Strategy Type: Swing Trade (Bullish Recovery)
Market Condition: Oversold with Bullish Divergence ⚡
Fear & Greed Index: 21 (Extreme Fear) 👻 = BUY OPPORTUNITY
📈 TECHNICAL CONFIRMATION (Real Market Data - Jan 2, 2026)
✅ 200-Day Simple Moving Average: $99.38 USDT (Strong Resistance Zone)
✅ 50-Day SMA: $83.76 USDT (Critical Breakout Level)
✅ 20-Day SMA: $78.90 USDT (Current Support)
✅ MACD Histogram: +0.3048 (BULLISH DIVERGENCE FORMING) 🔥
✅ RSI (14): 43.16 (Neutral - Room for Upside Movement)
✅ 24H Volume: $14.9M - $273.6M (Healthy Liquidity)
✅ Bollinger Bands: Mid-band at $80.74 (Target Zone)
🎪 ENTRY STRATEGY: "LAYERING METHOD" (Thief OG Style)
Entry Approach: Multiple Limit Orders / Scale-In Method
Layer 1️⃣ (Accumulation Zone)
Entry Point: $76.00 - $76.50 USDT
Risk Reward: Solid Foundation Builder
Size: 35% of position
Layer 2️⃣ (Breakout Confirmation)
Entry Point: $78.00 - $78.50 USDT
Risk Reward: Post-Consolidation Entry
Size: 35% of position
Layer 3️⃣ (Momentum Confirmation)
Entry Point: $80.00 - $81.00 USDT
Risk Reward: Strong Momentum Signal
Size: 30% of position
💡 PRO TIP: Scale into positions gradually. This reduces panic selling and locks in better average entry prices during volatility.
🛑 STOP LOSS PLACEMENT (Risk Management is KING 👑)
Recommended Stop Loss: $74.00 USDT
Hard SL Breakdown: $72.64 USDT (Technical Support)
Emergency SL: $70.00 USDT (Psychological Level)
Risk Calculation:
From Entry at $78.00 → SL at $74.00 = 5.1% Risk Per Trade
Position Size = 1-2% of Portfolio Risk (Suggested)
⚠️ IMPORTANT DISCLAIMER: This is YOUR decision. Adjust SL based on YOUR risk tolerance and account size. Never risk more than you can afford to lose!
🎯 PROFIT TARGETS (Cascading Exit Strategy)
🥉 Target 1 (Initial Profit Take) - 50% Position
TP1: $82.00 - $84.59 USDT
Gain: +5% to +8.3% from entry
Action: Lock in early profits, reduce risk to zero
🥈 Target 2 (Mid-Range Resistance) - 30% Position
TP2: $87.00 - $88.00 USDT (Key Analyst Consensus)
Gain: +11.5% to +12.8% from entry
Action: Trail stop-loss to breakeven
🥇 Target 3 (Major Resistance Break) - 20% Position
TP3: $95.00 - $100.00 USDT (Extended Target)
Gain: +21.8% to +28% from entry
Action: Ride momentum with trailing stop
🚀 STRETCH TARGET (Q1 2026)
Extended Target: $113.71 - $115.00 USDT
Gain: +45% to +47.2%
Condition: Sustained break above $87 with volume confirmation
⚠️ IMPORTANT DISCLAIMER: TP targets are based on technical analysis. Market conditions change. Your profit-taking strategy is YOUR choice. Manage position size wisely!
📊 TECHNICAL ANALYSIS BREAKDOWN
Bullish Signals 🟢
✅ MACD Histogram turning positive (Early momentum shift)
✅ Price above 7-day & 20-day SMA (Short-term uptrend)
✅ RSI in neutral zone (Not overbought = room to run)
✅ Recent consolidation at $74.66 support (Buyers defending)
✅ Oversold conditions (Often precede reversals)
✅ 24H Change: +3.29% (Momentum building)
Bearish Headwinds ⚠️
🔴 Price below 50-day SMA ($83.76) - Medium-term bearish
🔴 Price below 200-day SMA ($99.38) - Long-term bearish
🔴 Weekly Technical Rating: SELL (Mixed signals persist)
🔴 Volatility: 1.91% (Potential sharp moves both directions)
Verdict: Mixed setup = Wait for confirmation before scaling in!
🔗 CORRELATED PAIRS TO MONITOR
Direct Correlation 0.58-0.76
BTC/USDT (Bitcoin) 🔗
Correlation: 0.76 (Very High)
Why Important: LTC follows BTC dominance closely
Action: Monitor BTC chart for macro direction
Current BTC: Trading sideways (Neutral Signal for LTC)
Related Altcoins to Watch 📍
ETH/USDT (Ethereum) 📊
Correlation: 0.559 (Moderate-High)
Significance: Broader altcoin momentum
DOGE/USDT (Dogecoin) 🐕
LTC Weekly Correlation: +0.472
Signal: When alts pump together, LTC often leads
SEI, RENDER, DASH (Sector Leaders) ⭐
7-Day Correlation: +0.50-0.60
Importance: Monitor these for LTC breakout confirmation
💼 FUNDAMENTAL & MACRO FACTORS AFFECTING LTC (Jan 2026)
BULLISH CATALYSTS 🟢
1️⃣ LitecoinVM Layer-2 Launch (Q1 2026 Mainnet)
Status: Testnet Active (Dec 25, 2025)
Impact: Transforms LTC from "Digital Silver" → Programmable Web3 Hub
Details: EVM-compatible smart contracts via Polygon CDK
Significance: Attracts DeFi developers, increases utility
Timeline: Mainnet expected Q1 2026 (Could trigger rally)
2️⃣ MWEB Privacy Upgrade Adoption
Current Status: 90%+ of nodes validating MimbleWimble transactions
Volume Locked: 245,000+ LTC in private transactions
Impact: Enhanced fungibility without sacrificing speed
Implication: Increased demand from privacy-conscious users
3️⃣ Spot ETF Approval Prospects
Status: 3 US ETFs Under SEC Review (Grayscale, Canary, CoinShares)
Approval Odds: 68-90% by end-2025/early-2026
Potential Inflows: $400M-$500M if approved
Historical Precedent: Bitcoin ETF approval drove massive rallies
4️⃣ Institutional Accumulation
Latest Data: Lite Strategy (NASDAQ: LITS) holds 929,548 LTC (~$73M)
Signal: Corporate treasuries adding LTC like Bitcoin playbook
Market Impact: Reduces available supply for retail
5️⃣ Block Reward Halving Cycle ⏰
Last Halving: August 2023
Next Halving: 2027 (Scarcity narrative building)
Max Supply: 84 Million LTC (Fixed cap = deflationary)
BEARISH RISKS 🔴
⚠️ Binance Delisting Alert
Issue: 7 LTC margin pairs delisting Jan 6, 2026
Impact: Reduced leverage trading volume
Severity: Moderate (Spot trading unaffected)
⚠️ BTC Dominance at 59%
Concern: High BTC dominance leaves less capital for altcoins
Watch Level: If BTC dominance drops below 55% = Altcoin season
Current Status: Neutral-bearish for LTC
⚠️ Regulatory Uncertainty
MWEB Privacy Risk: Increased privacy use may attract regulatory scrutiny
Impact: Potential compliance challenges ahead
⚠️ Economic Data Releases
Upcoming: Fed Policy (Jan 29), Unemployment (Feb 7)
Risk: Hawkish signals could trigger broad crypto selloff
Monitor: Fed futures market for rate probability changes
🎬 ACTION PLAN FOR TRADERS
Before Entry ✅
Confirm support holding above $74.66
Wait for MACD histogram to cross above signal line
Check BTC chart for macro direction (critical!)
Scan news for ETF announcements or LitVM updates
During Entry 📍
Scale in using layer method (Don't FOMO all-in)
Set stop-loss FIRST before market order
Use limit orders for better entry prices
Document your entry prices for reference
After Entry 🚀
Take 50% profit at $82-84 level
Move stop to breakeven ($78.00)
Trail stop on remaining position
Monitor related pairs (BTC, ETH, DOGE) for confluence
Watch for ETF approval news (Major catalyst!)
Exit Strategy 🏁
Never hold through major economic news without reason
If LitVM news is negative = exit immediately
If BTC breaks below $85K = reduce position
Q1 2026 ETF decision = major milestone target
📌 KEY LEVELS SUMMARY (Cheat Sheet)
RESISTANCE ZONES:
🔴 $100.00 ← Psychological + Long-term target
🟠 $95.00 ← Analyst consensus (Short-term TP)
🟠 $87.00 ← Major resistance zone
🟡 $84.59 ← Immediate breakout level
🟡 $82.00 ← First profit-taking zone
CURRENT PRICE: $77.32 USDT
SUPPORT ZONES:
🟢 $76.00 ← Layer entry zone
🟢 $74.66 ← Critical support (Hard stop here!)
🔵 $72.64 ← Emergency support level
⚖️ RISK ASSESSMENT & DISCLOSURE
Trade Confidence Level: MEDIUM (60%)
Key Risk: Depends on support holding + BTC correlation
Reward Potential: +21-47% (Medium-term)
Volatility Expected: Moderate to High
🎓 FOR LEARNERS
Study: Litecoin's correlation with Bitcoin (0.76)
Practice: Identify support/resistance zones on your charts
Remember: Technical analysis is probability, not certainty
Execute: Small position sizes while building skill
Improve: Keep a trading journal for every decision
Good luck Thief OG's! Remember: "The best trade is the one where you keep your capital." 💰

LTC/USDT — Falling Wedge Formation Signals Potential ReversalOn the 8-hour timeframe, Litecoin (LTC) remains in an overall downtrend. However, the price structure is not moving in parallel lines, indicating that this is not a descending channel. The upper resistance trendline is steeper than the lower support trendline, signaling weakening bearish momentum.
Price is currently trading near the final phase of the pattern, approaching the apex, where a strong directional move (breakout or breakdown) is likely to occur.
---
Pattern & Price Structure
Pattern Identified: Falling Wedge (Bullish Reversal Pattern)
Key characteristics visible on the chart:
Continuous lower highs, forming a sharply declining resistance
Lower lows, but with decreasing downside momentum
Price compression, indicating reduced selling pressure
Non-parallel trendlines, distinguishing it from a descending channel
Technically, a falling wedge forming within a downtrend often precedes a bullish trend reversal, pending confirmation.
---
Key Levels
Support Zones:
80.0 USDT (current reaction zone)
76.0 – 72.6 USDT (major support & pattern invalidation level)
Resistance Zones:
85.8 USDT (near-term resistance)
93.5 – 96.5 USDT (key structural resistance)
104 – 110 USDT (major supply zone)
---
Bullish Scenario
The bullish scenario becomes valid if:
1. Price breaks above the falling wedge resistance
2. An 8H candle closes above 85.8 USDT
3. The market prints a first higher high as confirmation
Bullish Targets:
93.5 – 96.5 USDT
104 USDT
110 USDT (if momentum strengthens)
A confirmed breakout would suggest a shift from bearish control to recovery phase.
---
Bearish Scenario (Pattern Invalidation)
The bearish scenario occurs if:
Price fails to break out from the wedge
76 USDT support is broken with strong volume
Bearish Targets:
72.6 USDT
Extension toward the 70 USDT area if selling pressure accelerates
Such a move would invalidate the falling wedge and confirm bearish continuation.
---
Conclusion
Price action aligns more accurately with a falling wedge
The pattern suggests potential bullish reversal, but:
Confirmation is mandatory
Until a breakout occurs, the dominant trend remains bearish
The optimal approach is to wait for confirmation rather than anticipate.
---
#LTC #Litecoin #LTCUSDT #FallingWedge #BullishReversal #CryptoAnalysis #TechnicalAnalysis #Altcoin #CryptoTrading

#LTC/USDT analysis.Give me some energy !!!#LTC
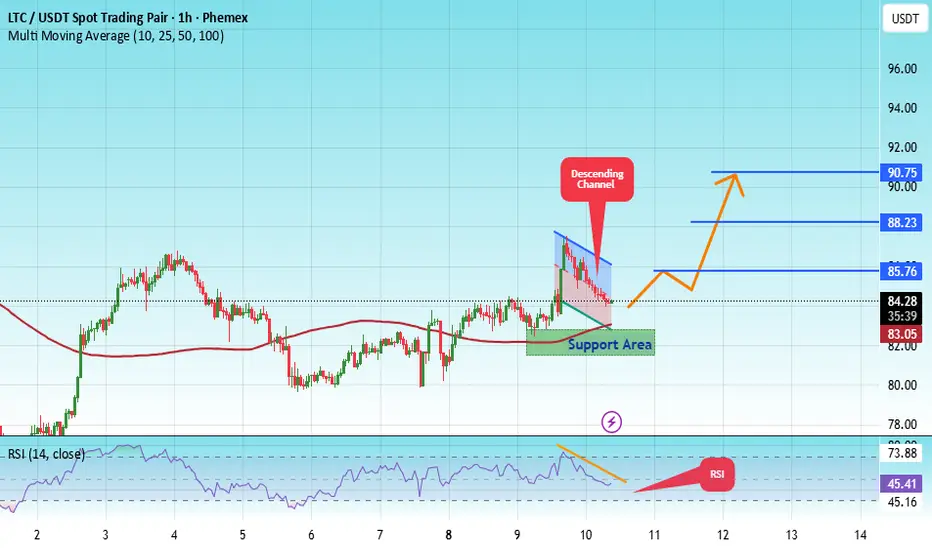
The price is moving in a descending channel on the 1-hour timeframe. It has reached the lower boundary and is heading towards breaking above it, with a retest of the upper boundary expected.
We have a downtrend on the RSI indicator, which has reached near the lower boundary, and an upward rebound is expected.
There is a key support zone in green at 82.00. The price has bounced from this level multiple times and is expected to bounce again.
We have a trend towards stability above the 100-period moving average, as we are moving close to it, which supports the upward movement.
Entry price: 84.29
First target: 85.76
Second target: 88.23
Third target: 90.75
Don't forget a simple principle: money management.
Place your stop-loss below the support zone in green.
For any questions, please leave a comment.
Thank you.
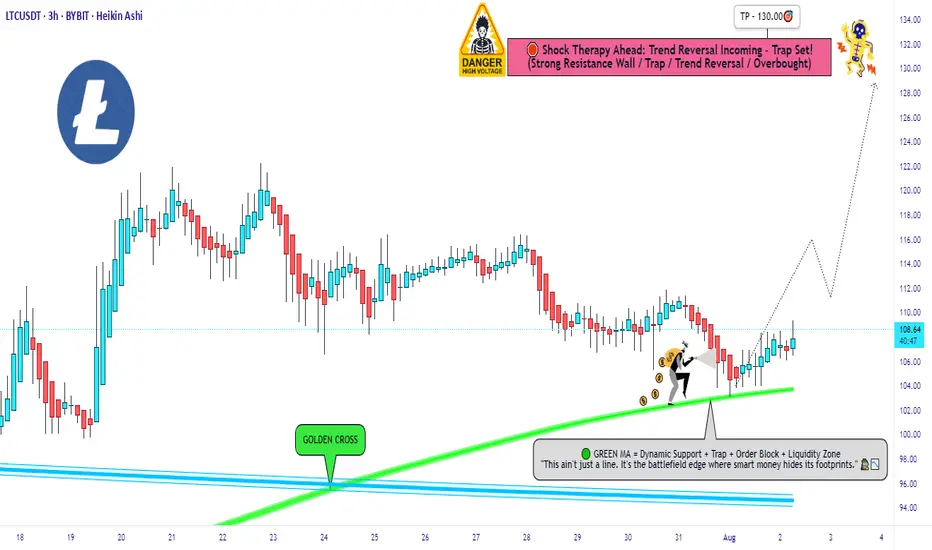
LTC Following Perfect Trend, May Breakout SOON !!! Keep an eye on these 2 trendlines for perfect setup
I have bought LTC as per below :
Bought Price : 120
TP : 130 +
Tight SL : 118 (To avoid risk)
LTC/USD Market Flow Blueprint – Bearish Bias Confirmed!🎯 LTC/USD: The Great Support Heist 🏴☠️ | Bearish Breakdown Blueprint
📊 Market Overview
Asset: LTC/USD (Litecoin vs. U.S. Dollar)
Market: Cryptocurrency
Trade Type: Swing Trade (Bearish Setup)
Strategy Style: "Thief Method" - Multi-Layer Limit Orders
🔍 Technical Analysis
Litecoin has officially broken through its STRONG SUPPORT ZONE, confirming a bearish market structure. This isn't just a casual dip—we're looking at a genuine breakdown that's validated by price action closing below critical support levels. The bears are in control, and the path of least resistance is pointing south. 🐻📉
What's Happening?
✅ Support zone broken with conviction
✅ Market structure showing lower highs forming
✅ Momentum shifting to the downside
✅ Volume confirming the breakdown
🎯 Trade Plan Breakdown
📍 Entry Strategy: "The Thief Layer Method"
Instead of going all-in at one price (rookie move 😅), we're using a multi-layer limit order strategy to build our position as price moves. Think of it as setting multiple traps along the way down.
Suggested Sell Limit Layers:
🎪 Layer 1: $92.00
🎪 Layer 2: $90.00
🎪 Layer 3: $88.00
Pro Tip: You can add more layers based on your risk appetite and position sizing strategy. Scale in, don't gamble in! 🎲
🛑 Stop Loss: $96.00
This stop is placed at the previous market structure's nearest higher high wick. Why? Because if price reclaims this level, it invalidates our bearish thesis and tells us the breakdown was fake news. 🚫
⚠️ IMPORTANT DISCLAIMER: This is MY stop loss based on MY analysis and risk tolerance. You should ALWAYS determine your own stop loss based on YOUR risk management rules. Trade your own plan, not mine! Your money, your rules. 💰
🎁 Target: $75.00
Our profit target sits at a confluence zone where we're expecting:
💎 Strong historical support
💎 Oversold conditions (RSI likely stretched)
💎 Bull trap potential zone
💎 Possible trend reversal area
This is where smart bears become bulls and take profits off the table. Don't be greedy—secure the bag! 💼
⚠️ IMPORTANT DISCLAIMER: This target is based on MY analysis. You should set YOUR OWN take profit levels based on YOUR trading plan and risk management. Lock in profits when YOU feel comfortable. Your capital, your decision! 🎯
🔗 Related Pairs to Watch
Keep an eye on these correlated assets for confluence:
BITSTAMP:BTCUSD - The king leads, alts follow. If Bitcoin dumps, LTC usually amplifies the move 👑
BITSTAMP:ETHUSD - Major alt indicator. Ethereum weakness = altcoin pain 🌊
BINANCE:LTCBTC - Shows LTC's relative strength against Bitcoin. Watch for breakdown here too 📊
TVC:DXY (Dollar Index) - Strong dollar = crypto weakness typically 💵
Correlation Play: Crypto markets move as a herd. When Bitcoin sneezes, Litecoin catches pneumonia. Watch BTC dominance and overall market sentiment. If BTC is showing weakness at key levels, it adds conviction to this LTC short setup. 🧩
📝 Key Takeaways
Confirmation is King - We're not guessing; the support break is confirmed ✅
Layer Your Entries - Don't blow your load at one price. Build the position strategically 🎯
Respect Your Risk - Stop loss is there for a reason. Use it. Love it. Don't delete it. 🛡️
Take Profits - The market doesn't care about your feelings. When you hit target, TAKE THE MONEY 💰
Stay Flexible - Markets change. If the setup invalidates, move on. No ego in trading 🧘
⚡ The Thief Philosophy
This isn't financial advice—it's a treasure map. 🗺️ You still have to dig, avoid the traps, and know when to run. The "Thief Method" is all about stealth entries, calculated risk, and knowing when to escape with the loot before the guards (market reversal) catch you.
We're not gambling; we're executing a heist. Plan the job, execute with discipline, and don't get caught holding bags. 🏴☠️💼
🎬 Final Words
Markets don't reward hope; they reward preparation and execution. This setup offers a solid risk-reward if you manage it properly. Remember: Your trade, your risk, your responsibility. I'm just sharing what I see and how I'm playing it.
Stay sharp, trade safe, and may your stop losses never get hit. 🎯🚀
✨ If you find value in my analysis, a 👍 and 🚀 boost is much appreciated — it helps me share more setups with the community!
#LTCUSD #Litecoin #CryptoTrading #BearishSetup #SwingTrade #TechnicalAnalysis #ThiefMethod #CryptoAnalysis #TradingStrategy #ShortSetup #CryptoTA #LTC #SupportBreakdown #LayeredEntry #RiskManagement

$LTC LONG IDEAThe coin has fully formed an ABCDE pattern.
To confirm it, we need a break above wave D.
Potential: $300–500.
Possible risks: if wave D is broken and the price moves to capture wave E (or immediately forms wave C), the scenario becomes invalidated.
For now, the setup remains active and valid.

Litecoin — Long-Term Accumulation and Breakout Setup (1W Chart)We have a blue horizontal accumulation zone, which has been acting as the cycle bottom area since 2018.
From this zone, long-term positions can be built with partial profit-taking targets at the yellow, red, and violet zones — each representing stages of distribution and de-risking from the accumulated position.
Additionally, we can observe a massive triangle formation.
If this pattern plays out, the breakout target zones are clearly indicated on the chart.
At the bottom, the blue line inside the white frame marks an additional support level, which may serve as a final retest zone before the next upward cycle.
Litecoin: Rally Stays on TrackLitecoin (LTC) has continued its steady upward climb. Under our primary scenario, the ongoing magenta wave is expected to sustain this momentum and push price above the resistance level at $147.06. However, if price falls below support at $50.22, our alternative scenario will come into play (probability: 40%), signaling the potential for further selling pressure.

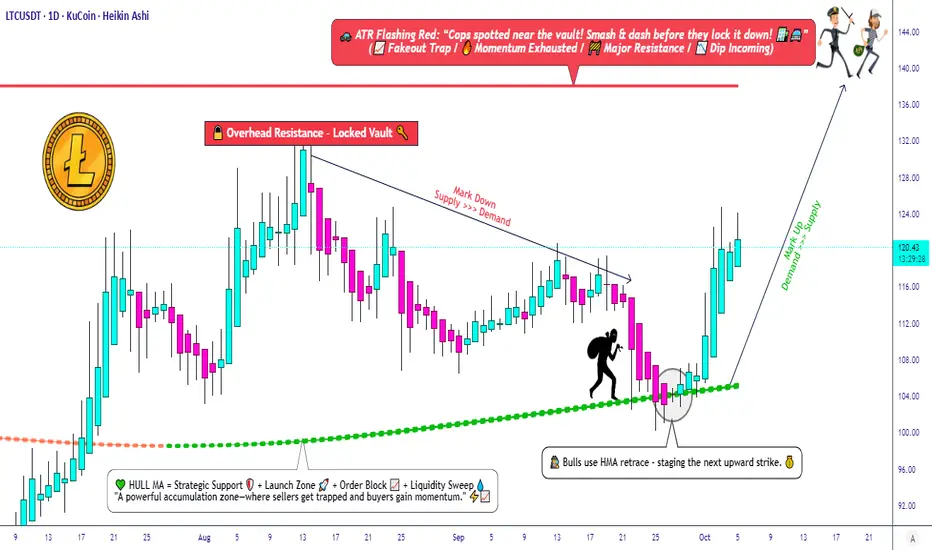
LTC/USDT — Technical Alignment Signals a Fresh Upside Phase!🎭 LTC/USDT: The Market Heist Blueprint | Swing/Day Trade Setup
💰 LITECOIN vs TETHER - Where Opportunity Meets Strategy
📊 THE SETUP
Asset: LTC/USDT (Litecoin/Tether)
Market Approach: Swing/Day Trade Strategy
Trade Style: "Thief Method" - Layered Entry System 🎯
🔍 TECHNICAL CONFIRMATION
✅ Bullish Signal Confirmed:
Hull Moving Average showing bullish retracement pattern
Heiken Ashi printing bullish doji candles (classic reversal signal)
Momentum shifting in favor of bulls
The technical confluence is aligning beautifully here, folks. When the HMA retraces and Heiken Ashi doji appears, we're looking at potential momentum shift territory.
🎯 THE THIEF'S ENTRY PLAN
Method: Layered Limit Orders (The "Thief Strategy")
This isn't your typical "one shot, one kill" approach. We're spreading our risk across multiple entry points:
Suggested Layer Entries:
Layer 1: $112
Layer 2: $114
Layer 3: $116
Layer 4: $118
Layer 5: $120
💡 Pro Tip: You can add more layers based on your risk tolerance and position size. The beauty of layering? You average your entry and reduce timing risk. Feel free to enter at any price level within this range.
🛡️ RISK MANAGEMENT
Stop Loss Zone: $108
⚠️ Important Disclaimer: This is MY stop loss level based on my analysis. You are the captain of your own ship! Set your stop loss based on YOUR risk tolerance. This is your money, your rules, your responsibility.
🎪 TARGET & EXIT STRATEGY
Primary Target: $140
Strategic Exit: $138.00
📍 Key Resistance Alert:
Around the $140 level, we've got the ATR line acting like a police barricade 🚔 - expect strong resistance here. This zone typically sees:
Overbought conditions
Potential bull traps
Heavy profit-taking
Exit Philosophy: When the cops show up (resistance hits), it's time for the thieves to exit with the loot! 💰
⚠️ Another Important Note: This target is based on technical analysis, but YOU decide when to take profits. Your account, your choices, your gains. Manage your risk accordingly!
🔗 RELATED PAIRS TO WATCH
Keep an eye on these correlated assets:
Major Crypto Pairs:
BINANCE:BTCUSDT - Bitcoin often leads altcoin movements; LTC tends to follow BTC trends
BINANCE:ETHUSDT - Ethereum correlation provides broader market sentiment
BINANCE:BCHUSDT - Similar payment-focused crypto, often moves in tandem with LTC
LTC Crosses:
BINANCE:LTCBTC - Shows LTC strength relative to Bitcoin
GEMINI:LTCETH - Alternative correlation metric
Key Correlation: When Bitcoin pumps, Litecoin typically follows with amplified moves. Watch BTC dominance for clues on altcoin season intensity.
🎓 KEY TAKEAWAYS
✨ Hull Moving Average retracement + bullish Heiken Ashi = momentum shift
✨ Layered entries reduce timing risk and improve average entry price
✨ ATR-based resistance at $140 = natural profit-taking zone
✨ Multiple stop loss and take profit levels based on individual risk profiles
✨ Correlation with BTC/ETH movements strengthens the setup
⚖️ LEGAL DISCLAIMER
🎭 This analysis uses the "Thief Style" trading strategy as an educational and entertainment concept. This is NOT financial advice. Trading cryptocurrencies carries substantial risk of loss. All entry prices, stop losses, and targets are for educational purposes only.
You are solely responsible for your trading decisions. Past performance does not guarantee future results. Always do your own research and never risk more than you can afford to lose. This is just one trader's perspective shared for fun and community engagement.
🚀 ENGAGE & SUPPORT
✨ If you find value in my analysis, a 👍 and 🚀 boost is much appreciated — it helps me share more setups with the community!
Happy Trading, Thief OG's! 🎩💎
#LTCUSDT #Litecoin #CryptoTrading #TechnicalAnalysis #SwingTrading #DayTrading #HullMovingAverage #HeikinAshi #LayeredEntry #CryptoStrategy #ThiefMethod #RiskManagement #TradingSetup #Altcoins #CryptoSignals
#LTC/USDT analysis.Give me some energy !!!#LTC
The price is moving within a descending channel on the 1-hour frame, adhering well to it, and is heading for a strong breakout and retest.
We have a bearish trend on the RSI indicator that is about to be broken and retested, supporting the upside.
There is a major support area (marked in green) at 107.50, which represents a strong basis for the upside.
For inquiries, please leave a comment.
We are in a consolidation trend above the 100 moving average.
Entry price: 111.15
First target: 112.80
Second target: 114.70
Third target: 117
Don't forget a simple matter: capital management.
When you reach the first target, save some money and then change your stop-loss order to an entry order.
For inquiries, please leave a comment.
Thank you.

LTC SUPPORT AND RESISTACEHello friends
Due to the rise we had, the price is in a correction phase and now we have identified the support areas for you that can move to the set targets if they stabilize in these areas and the specified resistance is broken.
*Trade safely with us*

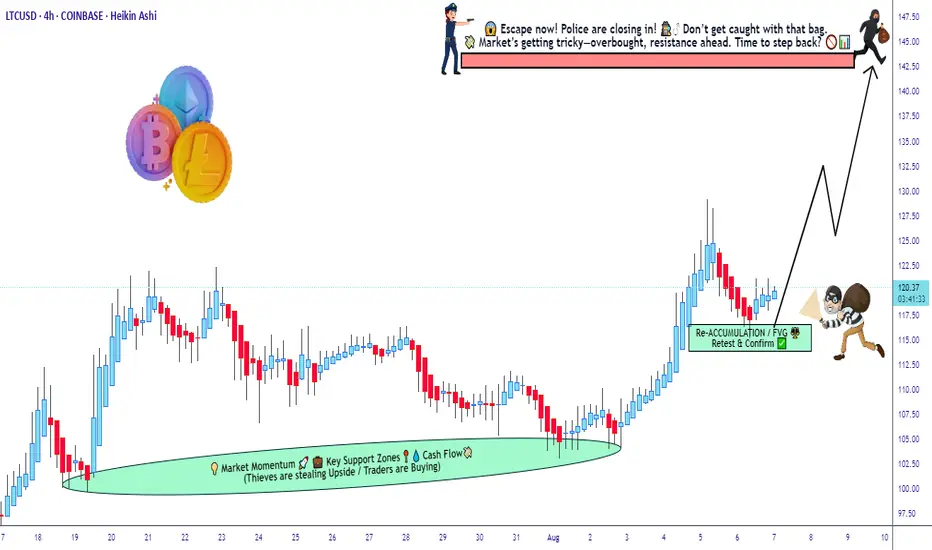
LTC reakout Loading? Targets $137 and Beyond After NFP Shock!Litecoin (LTC) continues to hold key support around $109 despite recent volatility, setting up for another upside push. With the Non-Farm Payrolls report coming in significantly weaker than expected, risk assets like crypto have gained a bullish backdrop as the Fed faces pressure to lean dovish. In this video, I break down LTC’s daily and 4-hour charts, highlighting the crucial demand and resistance levels that will shape the next move.
As long as LTC holds above $109, the structure remains constructive with targets toward $119.8, $123.4, and $137 in play. A breakout above those levels would open the path toward $168, aligning with the broader bullish setup across the crypto market. With Bitcoin showing resilience, Litecoin is well-positioned to continue its recovery in the sessions ahead.
"Is LTC/USD the next target of a stealth bull raid?”🎯 LTC/USD HEIST ALERT: BULLISH LAYER HEIST PLAN! 💎🚁
PLUNDER PLAN: BULLISH
Thief entering the LTC/USD market with calculated stealth—multi-layered buy-limit entries, master-level layering strategy 🌪️💰
👾 ENTRY STRATEGY:
Stack multiple limit orders at staggered price levels (layering like a patient 🐍 thief)
Enter at any price, staying ready to pounce at key zones, using alerts for breakouts
🛑 STOP LOSS:
Fixed SL at 110.00 USD
Keep tight risk control—stop’s your escape hatch!
🏹 TARGET:
Primary profit target: 143.00 USD
Use trailing stop-loss to lock gains early if momentum fades
🧠 THIEF TRADER TACTICS:
Limit orders only—no chasing
Enter the trend, don’t fight it—avoid shorts during bullish bias
For scalpers: swift layered fills
For swing traders: build position patiently
💎 RISK MANAGEMENT:
Every limit order has a stop-loss
Total risk should be controlled—ideal risk‑reward if full strategy plays out
🔍 MARKET CONTEXT:
Bullish outlook supported by confluence of:
macro themes, sentiment swings, on‑chain flows, and intermarket setups
Layered entries optimize risk while capturing upside
⚠️ Avoid trading during high‑volatility news events
Trailing stops = lock profit & evade chaos
📣 CALL TO ACTION:
💥 If you feel the energy, smash that Like and Follow, comment your plan, and join the crew. Let’s rob the market level by level 🔓🎯
Stay sharp, stay sneaky — see you at the target 🔐
— Thief Trader 🐱👤💵🚀
LTCUSDTI think the BINANCE:LTCUSDT price 📈 may pull back to $110.60 before pumping to higher levels 🚀.
Watch for reactions at $116.50 and $128.20 🔍 — key decision zones.
Supports: $116.50 – $110.60 – $104.60 🛡️
Resistance: $128.20 – $140 🏔️
Manage your risk ⚠️.

LTC/USDT Robbery Underway | Bullish Setup, Get In Now!🔥💎 LTC/USDT HEIST PLAN: ROB AT ANY PRICE! 💎🔥
🚨 Bullish Move Incoming | Layered Entries | Thief Trader Exclusive 🚨
🌟Hi! Hola! Ola! Bonjour! Hallo! Marhaba!🌟
Dear Money Makers & Market Robbers, 🤑💰💸✈️
The time has come for another high-stakes Thief Trading heist, and this time we're lockin' in on LTC/USDT – aka "Litecoin vs Tether" 💣💸
🎯 Thief’s Mission Plan: BULLISH AT ANY PRICE LEVEL!
We're going full stealth mode with a layering strategy — stacking multiple limit orders like a true pro thief preparing for a clean escape! 🔪📉📈
🚪 ENTRY: "Anywhere, Anytime" 🚪
📈 Buy from any price level — but for optimal entry:
🟢 Use Buy Limit orders near recent lows (15-30 min TF)
🔔 Don’t forget to set alerts for breakout confirmation!
🛑 STOP LOSS: Strategic Defense 🛑
🗣️ "Listen up, team! Stop loss ain’t a maybe — it’s your armor. Place it smart, or prepare for pain." 🔥
📍Recommended SL: 100.00
🔐 Adjust based on your lot size & how deep you stack your orders.
🏁 TARGET: 130.00 🏁
💸 But always Escape Early if the plan gets too hot!
Use a Trailing SL to lock in gains and slip out clean 😎🧨
🧠 PRO TIPS from the THIEF:
🔎 Only Buy. No Shorting!
💣 Scalpers: Jump in with the trend, not against it.
🧲 Swing Traders: Stay patient, and execute the full heist.
🚀 Use Trailing Stops – Let profit ride, but stay protected!
📢 MARKET INSIGHT:
🔥 Bullish Bias backed by:
✅ On-Chain Metrics
✅ Sentiment Shifts
✅ Macro Flows
✅ COT Reports
✅ Intermarket Divergence
⚠️ TRADING ALERT: Stay Sharp!
📰 News Events = Volatility.
💡 Avoid fresh entries during high-impact events.
📉 Use Trailing SL to secure your running trades.
💖 SUPPORT THE CREW 💖
🚀 Smash that Boost Button if you believe in the Thief Style Strategy
👑 Let's rob the market together, one level at a time.
🧠 Stay sharp, stay sneaky – and I’ll see you at the next target 🎯
— Thief Trader 🐱👤💰🚁🌍
LTC/USDT Trade Plan: Litecoin & Nasdaq CorrelationKeeping a close eye on Litecoin (LTC/USDT) ⚡ — after a bullish breakout from a healthy pullback 📈, I’m eyeing the potential for continued upside momentum 🚀. This perspective remains heavily correlated to the performance of the NASDAQ; if equities continue their bullish trajectory 🟢, I’ll be looking to position myself in line with Litecoin strength.
In the video, we also dive into the Fibonacci extension tool to identify potential targets 🎯 and combine this with historical support and resistance levels 📍. Another key component of my analysis is the anchored volume profile, which I’ve demonstrated throughout the walkthrough 📉.
This is all part of my execution plan 📊 — full details are provided in the video and should not be considered financial advice ⚠️.

LTC (the most dangerous chart in crypto)LTC / USDT
8 years of accumulation in this triangle and price is being squeezed around apex.. What is the result of this long accumulation?
It reminds me of XRP chart before the big breakout in last November
Keep an eye of it…

Is This the Perfect Moment to Rob the LTC/USD Vault?🏴☠️ LTC/USD Heist Mode: The Moving Average Break-In Plan 💰📈
🌟Hi! Hola! Ola! Bonjour! Hallo! Marhaba!🌟
Calling all Market Bandits, Crypto Hustlers & Chart Raiders! 🤑💰🚀
🚨Mission Briefing
We’re eyeing a bullish breakout hit job on the LTC/USD chart — all based on the elite 🔥Thief Trading Style🔥 with a touch of candle science, moving average vault-cracking, and some solid day/swing setups. This ain’t your grandma’s trade plan — this is high-level lootin’ with precision.
🕵️♂️ 🎯 ENTRY PLAN — Unlock the Vault at $86.00
Wait for the MA breakout + candle close above that sneaky Moving Average line.
➡️ Execute Buy Stop orders above MA
➡️ OR place Buy Limit during a pullback to swing low/high zones in 15m–30m timeframe.
📌 Pro tip: Set an alert – catch the breakout live, don’t chase it later.
🛑 STOP LOSS — Your Getaway Route
Place your Thief SL near the recent swing low (82.00 using 3H chart).
🎤“If you’re entering like a pro, stop loss goes where it should – not where fear lives. But hey, it's your ride or die. Choose wisely.” 🔥
💡Adjust SL based on lot size, risk %, & how deep your robbery goes.
🏴☠️ TARGET ZONE — Exit the Scene at $92.00
Get your bags packed, profits stacked, and be ready to escape before the market catches on.
💸 Grab the loot and bounce before the reversal gangs arrive!
📈 Why the Heist?
The LTC/USD crypto market is showing bullish momentum, backed by key analysis angles:
🔍 Fundamentals
📊 COT Report
💥 On-Chain Metrics
🧠 Sentimental Heat
🌍 Intermarket Structure
👉 Check your intel. React. Don’t sleep. 🔗🔗
⚠️ News Alert & Risk Tip
🗞️ Stay clear of trades during volatile news releases
🔐 Use trailing stops to lock in gains
🚫 Protect your positions – don't let profits slip through cracks.
📌Disclaimer:
This ain’t financial advice — it’s just a shared plan for market raiders. Trade at your own risk, and don’t forget to bring your own map. Market shifts faster than a getaway car — so adapt & react smartly. 🧠💡
💖 BOOST the Plan 💥
Hit that Boost Button if you're vibin’ with the robbery crew. It powers up the strategy and supports the movement. Together, we trade to take — The Thief Trading Way. 💸💪🎉
🚀 Catch you on the next breakout. Stay sneaky, stay sharp. 🐱👤🤑

LTC, he Hidden Strength Beneath the Retrace Ma dudes, we might just be witnessing something big and beautiful here. 🤌✨
Okay okay, I might sound like a total degen, but hear me out:
✅ Double bottom (check those two green arrows)
✅ Bullish divergence on the RSI
✅ MACD on the monthly just crossed bullish — for the first time ever on this pair!
✅ OBV stayed strong, didn’t collapse even during that nasty monthly retrace
✅ Notice how volume was climbing during the uptrend, but fell off during the retrace? That means the drop lacked real conviction.
We’re also sitting at an ATL (all-time low) — the lowest we've been.
Check out that red arrow pointing at the volume: that's the first sign of a burst. The next bursts? 💥 They should be explosive.
…And that’s just to name a few.
See you somewhere up there 🚀 — once we break through that T1 level, we should start trending higher fast.
That's it, that's the idea" - Good night !

LTC Short SetupWait for the entry and execute, SL is smaller and if candle closes strongly above the zone then must close the trade. Hopefully it won't break easily this zone as bearish fvg + bearish order block lies here.

LTC/USDT Heist Alert: Bullish Loot Before the Trap! 🚨 LTC/USDT HEIST ALERT: Quick Bullish Raid Before the Trap! (Thief Trading Plan) 🚨
🌟 Greetings, Market Robbers! 🌟
Hola! Ola! Bonjour! Hallo! Marhaba! 🤑💰💸
🔥 Thief Trading Analysis signals a bullish LTC/USDT heist opportunity! Our plan? Enter long, escape near high-risk zones before bears ambush weak hands. Fast profits = less risk! 🏆💸
🎯 Heist Strategy (LTC/USDT Swing/Day Trade)
📈 Entry:
*"Vault is open! Swipe bullish loot at any price—but for a smoother steal, set buy limits near 15M/30M swing lows."*
🛑 Stop Loss:
📍 Thief SL at latest 4H swing low (adjust for risk/lot size).
📍 Multiple orders? Don’t get caught—size SL wisely!
🏴☠️ Target: 114.00 (or escape early if momentum fades!)
💥 Why LTC/USDT?
Bullish momentum (scalping/day trade).
USDT pairs = stablecoin safety (no USD volatility risk).
Liquidity + tighter spreads (cleaner executions).
⚠️ Heist Safety Protocol
🚨 News = Danger Zone! Avoid new trades during releases.
🔐 Trailing stops = Lock profits, dodge reversals.
💖 Boost the Heist!
💥 Smash the Like & Boost 💥 to fuel our robbery crew! More boosts = more profitable heists! 🚀🤝
Stay tuned—next heist coming soon! 🤑🐱👤

LTC/USDT "Litecoin vs Tether" Crypto Heist Plan (Day/Swing)🌟Hi! Hola! Ola! Bonjour! Hallo! Marhaba!🌟
Dear Money Makers & Robbers, 🤑 💰💸✈️
Based on 🔥Thief Trading style technical and fundamental analysis🔥, here is our master plan to heist the LTC/USDT "Litecoin vs Tether" Crypto Market. Please adhere to the strategy I've outlined in the chart, which emphasizes long entry. Our aim is to escape near the high-risk Yellow MA Zone. Risky level, overbought market, consolidation, trend reversal, trap at the level where traders and bearish robbers are stronger. 🏆💸"Take profit and treat yourself, traders. You deserve it!💪🏆🎉
Entry 📈 : "The heist is on! Wait for the MA breakout (90.00) then make your move - Bullish profits await!"
however I advise to Place Buy stop orders above the Moving average (or) Place buy limit orders within a 15 or 30 minute timeframe most recent or swing, low or high level for Pullback entries.
📌I strongly advise you to set an "alert (Alarm)" on your chart so you can see when the breakout entry occurs.
Stop Loss 🛑: "🔊 Yo, listen up! 🗣️ If you're lookin' to get in on a buy stop order, don't even think about settin' that stop loss till after the breakout 🚀. You feel me? Now, if you're smart, you'll place that stop loss where I told you to 📍, but if you're a rebel, you can put it wherever you like 🤪 - just don't say I didn't warn you ⚠️. You're playin' with fire 🔥, and it's your risk, not mine 👊."
📍 Thief SL placed at the nearest/swing low level Using the 3H timeframe (77.50) Day / Swing trade basis.
📍 SL is based on your risk of the trade, lot size and how many multiple orders you have to take.
🏴☠️Target 🎯: 100.00 (or) Escape Before the Target
🧲Scalpers, take note 👀 : only scalp on the Long side. If you have a lot of money, you can go straight away; if not, you can join swing traders and carry out the robbery plan. Use trailing SL to safeguard your money 💰.
💰💵💸LTC/USDT "Litecoin vs Tether" Crypto Market Heist Plan (Swing/Day) is currently experiencing a bullishness,., driven by several key factors. .☝☝☝
📰🗞️Get & Read the Fundamental, Macro, COT Report, On Chain Analysis, Sentimental Outlook, Intermarket Analysis, Future trend targets... go ahead to check 👉👉👉🔗🔗🔗
⚠️Trading Alert : News Releases and Position Management 📰🗞️🚫🚏
As a reminder, news releases can have a significant impact on market prices and volatility. To minimize potential losses and protect your running positions,
we recommend the following:
Avoid taking new trades during news releases
Use trailing stop-loss orders to protect your running positions and lock in profits
💖Supporting our robbery plan 💥Hit the Boost Button💥 will enable us to effortlessly make and steal money 💰💵. Boost the strength of our robbery team. Every day in this market make money with ease by using the Thief Trading Style.🏆💪🤝❤️🎉🚀
I'll see you soon with another heist plan, so stay tuned 🤑🐱👤🤗🤩