#LTC/USDT analysis.Give me some energy !!!#LTC
The price is moving within a descending channel on the hourly timeframe. It has reached the lower boundary and is heading towards a breakout, with a retest of the upper boundary expected.
The Relative Strength Index (RSI) is showing a downward trend, approaching the lower boundary, and an upward bounce is anticipated.
There is a key support zone in green at 75.00, and the price has bounced from this level several times and is expected to bounce again.
The indicator is showing a trend towards consolidation above the 100-period moving average, which we are approaching, supporting the upward move.
Entry Price: 78.30
First Target: 79.40
Second Target: 81.45
Third Target: 83.86
Stop Loss: Below the green support zone.
Remember this simple thing: Money management.
For any questions, please leave a comment.
Thank you.
Ltcusdshort

Litecoin - Long-Term Bearish Structure, New Cycle Low ExpectedDuring previous bull runs (2017 and 2021) , Litecoin consistently made new all-time highs , breaking above prior peaks. However, an important historical pattern stands out: each bear market formed higher lows , suggesting long-term range compression.
At the current stage, this structure appears to be changing. Price remains in a prolonged consolidation phase, and a bear flag has formed on the monthly timeframe, which is a classic bearish continuation pattern following a strong downside impulse.
Based on the overall market cycle structure and historical behavior, I expect a breakdown below previous bear market lows, with a new cycle bottom forming in the $24–20 range.
Key factors:
Clear bear flag on the 1M timeframe
Lack of a sustained uptrend since the 2021 peak
Weak bullish momentum and distribution structure
Market cycle dynamics
Cycle outlook:
2026 is expected to be a bearish year, potentially marking the final phase of this downtrend and the establishment of a macro bottom.
Invalidation:
A sustained breakout and hold above the upper boundary of the monthly bear flag would invalidate this bearish scenario.
This idea is designed for long-term traders and investors who analyze the market through cycle behavior and macro structure, rather than short-term price fluctuations.

#LTC/USDT analysis.Give me some energy !!!#LTC
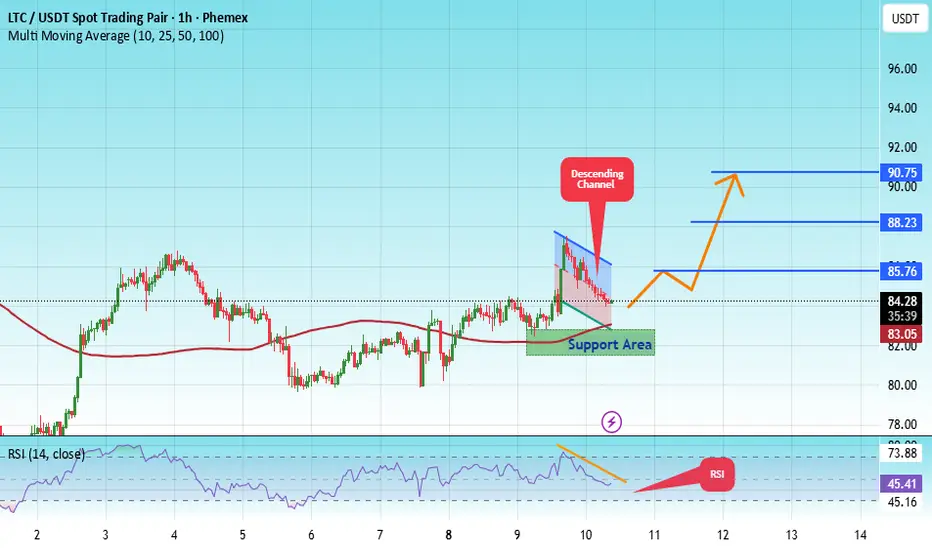
The price is moving in a descending channel on the 1-hour timeframe. It has reached the lower boundary and is heading towards breaking above it, with a retest of the upper boundary expected.
We have a downtrend on the RSI indicator, which has reached near the lower boundary, and an upward rebound is expected.
There is a key support zone in green at 82.00. The price has bounced from this level multiple times and is expected to bounce again.
We have a trend towards stability above the 100-period moving average, as we are moving close to it, which supports the upward movement.
Entry price: 84.29
First target: 85.76
Second target: 88.23
Third target: 90.75
Don't forget a simple principle: money management.
Place your stop-loss below the support zone in green.
For any questions, please leave a comment.
Thank you.
Litecoin Below 70$ Soon.#Litecoin Below 70$ Soon...
After that it'll go for exit liquidity .
Be Safe Guys.

#LTC/USDT analysis.Give me some energy !!!#LTC
The price is moving within a descending channel on the 1-hour frame, adhering well to it, and is heading for a strong breakout and retest.
We have a bearish trend on the RSI indicator that is about to be broken and retested, supporting the upside.
There is a major support area (marked in green) at 107.50, which represents a strong basis for the upside.
For inquiries, please leave a comment.
We are in a consolidation trend above the 100 moving average.
Entry price: 111.15
First target: 112.80
Second target: 114.70
Third target: 117
Don't forget a simple matter: capital management.
When you reach the first target, save some money and then change your stop-loss order to an entry order.
For inquiries, please leave a comment.
Thank you.

LTC SUPPORT AND RESISTACEHello friends
Due to the rise we had, the price is in a correction phase and now we have identified the support areas for you that can move to the set targets if they stabilize in these areas and the specified resistance is broken.
*Trade safely with us*

Litecoin - Expecting Bearish Continuation In The Short TermM15 - Clean bearish trend with the price creating series of lower highs, lower lows.
No opposite signs.
Expecting further continuation lower until the two Fibonacci resistance zones hold.
If you enjoy this idea, don’t forget to LIKE 👍, FOLLOW ✅, SHARE 🙌, and COMMENT ✍! Drop your thoughts and charts below to keep the discussion going. Your support helps keep this content free and reach more people! 🚀
--------------------------------------------------------------------------------------------------------------------
Disclosure: I am part of Trade Nation's Influencer program and receive a monthly fee for using their TradingView charts in my analysis.

#LTC/USDT#LTC
The price is moving within a descending channel on the 1-hour frame, adhering well to it, and is heading for a strong breakout and retest.
We are seeing a bounce from the lower boundary of the descending channel, which is support at 92.48.
We have a downtrend on the RSI indicator that is about to be broken and retested, supporting the upward trend.
We are looking for stability above the 100 moving average.
Entry price: 97.44
First target: 100.24
Second target: 102.45
Third target: 105.26

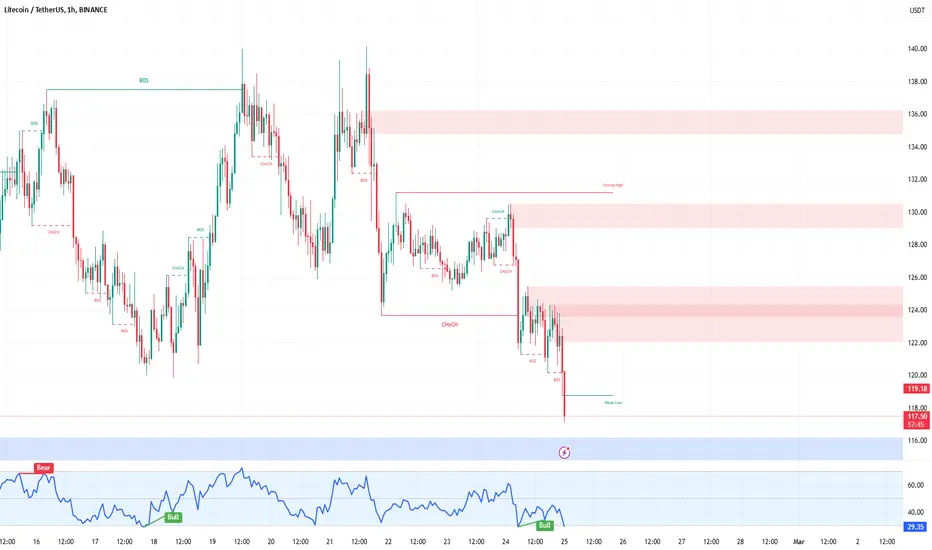
LTC/USDT 1H: Bearish Breakdown – Short Setup Targeting $115.50?LTC/USDT 1H: Bearish Breakdown – Short Setup Targeting $115.50?
🚀 Follow me on TradingView if you respect our charts! 📈 Daily updates!
Current Market Analysis:
Price at $119.85 showing strong bearish momentum.
Market makers appear to be in a distribution phase with clear lower highs.
Hidden bearish divergence on RSI confirms the downtrend.
Risk Score: 8/10 – High risk environment.
Market Maker Activity:
Distribution pattern is evident with lower highs.
Declining volume on bounces suggests persistent selling pressure.
Expect continued downside until testing support around $115.50.
Trade Setup (Confidence 8/10):
Recommendation: Short position with high confidence.
Entry: At current price ($119.85).
Targets:
T1: $118.00
T2: $115.50
Stop Loss: Set at $122.40 (above recent swing high).
Key Resistance Zones: $124.00, $128.50, $136.00
Recommendation:
Wait for confirmation of entry with a rejection around $122. This setup aligns perfectly with SMC principles, indicating strong institutional selling pressure.
🚀 Follow me on TradingView if you respect our charts! 📈 Daily updates!
LTC/USDT 1H: Bears Target $112 After $132 Rejection!LTC/USDT 1H Chart Analysis
🚀 Follow me on TradingView if you respect our charts 📈Daily new charts!
Current Market Structure:
Bearish trend confirmed after rejection from premium zone at $132.
RSI: Bearish divergence at recent high, with overbought conditions.
Market Structure: Lower highs forming, signaling continuation to the downside.
Smart Money Activity:
Accumulation Phase: Likely occurring at discount zone $110-$112.
Distribution Phase: Visible at the premium zone ($132).
Market Makers: Targeting liquidity below $110.
Key Levels:
Entry Zone: Short at $126-$128 (resistance zone).
Targets:
T1: $120 (Equilibrium Zone).
T2: $112 (Discount Zone).
Stop Loss: Above $133 (recent swing high).
Risk Score:
7/10 (Favorable R:R ratio with clear invalidation).
Market Maker Intent:
Stop Hunt Expected: Watch for potential liquidity grab above $132 before further downside.
Volume Analysis: Declining on recent push up, indicating weakening bullish pressure.
Recommendation:
Short positions favorable within the $126-$128 range.
Maintain tight stops above $133 to manage risk.
Wait for bearish order block confirmation before entering.
Confidence Level: 8/10 for bearish continuation.
🚀 Follow me on TradingView if you respect our charts 📈Daily new charts!

#LTC/USDT #LTC
The price is moving in a descending channel on the 1-hour frame and is expected to continue upwards
We have a trend to stabilize above the moving average 100 again
We have a descending trend on the RSI indicator that supports the rise by breaking it upwards
We have a support area at the lower limit of the channel at a price of 110
Entry price 112
First target 114
Second target 116
Third target 120

LTCUSDT - the same shape of XRPBreakout a massive triangle pattern since more than 3 years
It's same shape of XRP ...u must check it
Weekly close above this massive triangle must be a sure sign of going to hit a new ATH
Best regars Ceciliones 🎯

#LTC/USDT#LTC
The price has broken the descending channel on the 12-hour frame upwards and is expected to continue
We have a trend to stabilize above the moving average 100 again
We have an upward trend on the RSI indicator that supports the rise by breaking it upwards
We have a support area at the lower limit of the channel at a price of 60
Entry price 65
First target 71
Second target 77
Third target 83

Litecoin - LTC Free Fall to $60 ??Although Litecoin did not make the Top Altcoins for 2024 list - it is an old timer. And by this, I basically mean that it can (and will) still be traded.
From the 4h, we see some beautiful swings that can be very profitable trades, with the right entry points.
It seems the entire market is turning down following BTC. This however, could result in some good entry points and lower buying orders being filled. Getting in at the RIGHT price is one of Warren Buffet's key investment strategies. Find out more on that, here:
____________________________
BINANCE:LTCUSDT

LTC: buy-low .. sell-high📊Analysis by AhmadArz:
🔗"Uncover new opportunities in the world of cryptocurrencies with AhmadArz.
💡Join us on TradingView and expand your investment knowledge with our five years of experience in financial markets."
🚀Please boost and💬 comment to share your thoughts with us!

LTC - THIS INDICATOR says SELL 🤔📉Hi Traders, Investors and Speculators of Charts📈
Litecoin / LTC is an altcoin that still has massive upside potential for the coming bull season. If you have been following me for a while, you'll know I've been saying we are trading in the opening moments of a new bullish cycle. I've also referred to this as Elliot Wave Theory Wave 1.
According to my plan, this is the first impulse wave towards the upside. But the upwards wave are always followed by correction waves; a natural part of any cycle. I expected the second impulse wave (2-3) only AFTER the BTC halving, which is set to happen in April.
So far, we've seen a correction / pullback across all crypto's. BTC corrected from 48k to 41K and now hovering around FWB:42K where it has found support. But across most altcoins, the bears are controlling the lower timeframes. HOWEVER - this is a great opportunity to get in at lower prices before the second impulse wave starts.
The second impulse wave is know to be the biggest one, with the biggest increase - and that's what we're looking forward to after this correction is over.
For the short term though as pointed out, I'm expecting LTC to trade range or perhaps even slightly lower. This is a great re-accumulation zone, incase you missed the first one.
If you found this content helpful, please remember to hit like and subscribe and never miss a moment in the market s.
_______________________
📢Follow us here on TradingView for daily updates📢
👍Hit like & Follow 👍
CryptoCheck
BINANCE:LTCUSD.P BINANCE:LTCUSDT COINBASE:LTCUSD

buy - sell (LTC)📊Analysis by AhmadArz:
🔗"Uncover new opportunities in the world of cryptocurrencies with AhmadArz.
💡Join us on TradingView and expand your investment knowledge with our five years of experience in financial markets."
🚀Please boost and💬 comment to share your thoughts with us!

...(LTC)📊Analysis by AhmadArz:
....
🔍Entry: 72
🛑Stop Loss:72.82
🎯Take Profit: 71.30
🔗"Uncover new opportunities in the world of cryptocurrencies with AhmadArz.
💡Join us on TradingView and expand your investment knowledge with our five years of experience in financial markets."
🚀Please boost and💬 comment to share your thoughts with us!

LTC Showing a bearish SharkLooking at the LTC chart, it looks like we did a bearish shark and we could have one more move to the down side or we have completed the bearish shark (since the recent low got close to the previous all time low). A break above the previous high should invalidate the bearish sentiment.
In the short term I am bullish on BTC so I want to believe we have completed the bearish shark on LTC but charts don't lie, emotions do.
Please do your DD as this is not a financial advice.

Litecoin Short Term Sell IdeaH4 - Bearish trend pattern.
Currently it looks like a pullback is happening.
Until the strong resistance zone holds I expect the price to move lower further after pullbacks.

LTC ☁️ Downtrend, Time to Sell? A bullish sun 🌞 shines over most of the global crypto market in the next 24 hours, including Bitcoin and Ether, signaling further upside for cryptocurrencies. Binance Coin and Litecoin buck this positive trend with cloudy, bearish trading conditions ahead, ATTMO shows. ☁️
Over a one-week horizon, the sunny 🌞 upward trend will persist, although the price gains are likely to be smaller. Ripple’s XRP, Polkadot, and Uniswap will face bearish clouds over this longer time period. ☁️
Follow us for more crypto weather reports!

Short idea on LTCAs I wrote earlier, I like Litecoin.
There will be a halving soon (people think it's time to buy)
The market is generally positive
I like the structure
*not financial advice (these are trading ideas myself)

LTCUSDTThis is a 1D frame analysis for LTCUSDT After losing its previous support zone, the price was unable to start its upward movement and breached our first support line. Currently, the price is close to our first resistance line and we believe this could be a pullback for further downside to our second support line. However, if it can hold above our first resistance line, it could start its upward trend to our second resistance zone.
