LTCUSDT - Symmetrical Triangle: Breakout or Breakdown?Litecoin (LTC/USDT) on the Weekly (1W) timeframe is currently in a long-term consolidation phase following a major decline from its previous cycle high. Price action is becoming increasingly compressed and is now approaching the apex of a large structure, signaling an upcoming major directional move.
The current price is trading around $82–85, positioned near the middle of the triangle, which represents a critical decision zone for the market.
---
Pattern Explanation
The chart is forming a large Symmetrical Triangle, characterized by:
Lower highs → descending resistance (upper yellow trendline)
Higher lows → ascending support (lower yellow trendline)
Pattern structure developing from 2022 through early 2026
Gradually declining volume → a typical sign of market compression before a breakout
A Symmetrical Triangle is a neutral continuation pattern, meaning the next major move will be determined by a confirmed breakout or breakdown.
---
Key Levels
Major Resistance Levels:
$95 – $100 → minor resistance / mid-range area
$120 → strong historical resistance
$134 → major supply zone
$281 → long-term major resistance / macro target
Major Support Levels:
$82 – $80 → current support zone
$63 → structural support
$40 → swing low / extreme downside support
---
Bullish Scenario
The bullish scenario will be confirmed if:
1. Price breaks above the descending trendline
2. A weekly close above resistance, supported by increasing volume
Bullish Targets (Step-by-Step):
$95 – $100 (initial target)
$120 – $134 (major distribution zone)
$180 – $280 (measured move of the triangle if bullish continuation occurs)
A confirmed breakout could mark the start of a new medium- to long-term uptrend.
---
Bearish Scenario
The bearish scenario becomes valid if:
1. Price fails to break resistance
2. A weekly close below the ascending support trendline
Bearish Targets (Step-by-Step):
$63 → key support
$40 → historical lower boundary
A breakdown from this structure would suggest a continuation of bearish or prolonged sideways conditions.
---
Conclusion
LTC is currently trading within a major decision zone on the weekly timeframe.
Traders and investors are advised to wait for clear confirmation, rather than anticipating direction inside the triangle.
➡ Breakout = potential start of a new bullish trend
➡ Breakdown = risk of further downside or extended consolidation
Patience is crucial during high-compression market phases like this.
---
#LTCUSDT #Litecoin #Altcoin #CryptoMarket
#CryptoAnalysis #AltcoinAnalysis #WeeklyChart
#SymmetricalTriangle #TrianglePattern #TriangleBreakout
Ltcusdtidea

LTC/USDT — Falling Wedge Formation Signals Potential ReversalOn the 8-hour timeframe, Litecoin (LTC) remains in an overall downtrend. However, the price structure is not moving in parallel lines, indicating that this is not a descending channel. The upper resistance trendline is steeper than the lower support trendline, signaling weakening bearish momentum.
Price is currently trading near the final phase of the pattern, approaching the apex, where a strong directional move (breakout or breakdown) is likely to occur.
---
Pattern & Price Structure
Pattern Identified: Falling Wedge (Bullish Reversal Pattern)
Key characteristics visible on the chart:
Continuous lower highs, forming a sharply declining resistance
Lower lows, but with decreasing downside momentum
Price compression, indicating reduced selling pressure
Non-parallel trendlines, distinguishing it from a descending channel
Technically, a falling wedge forming within a downtrend often precedes a bullish trend reversal, pending confirmation.
---
Key Levels
Support Zones:
80.0 USDT (current reaction zone)
76.0 – 72.6 USDT (major support & pattern invalidation level)
Resistance Zones:
85.8 USDT (near-term resistance)
93.5 – 96.5 USDT (key structural resistance)
104 – 110 USDT (major supply zone)
---
Bullish Scenario
The bullish scenario becomes valid if:
1. Price breaks above the falling wedge resistance
2. An 8H candle closes above 85.8 USDT
3. The market prints a first higher high as confirmation
Bullish Targets:
93.5 – 96.5 USDT
104 USDT
110 USDT (if momentum strengthens)
A confirmed breakout would suggest a shift from bearish control to recovery phase.
---
Bearish Scenario (Pattern Invalidation)
The bearish scenario occurs if:
Price fails to break out from the wedge
76 USDT support is broken with strong volume
Bearish Targets:
72.6 USDT
Extension toward the 70 USDT area if selling pressure accelerates
Such a move would invalidate the falling wedge and confirm bearish continuation.
---
Conclusion
Price action aligns more accurately with a falling wedge
The pattern suggests potential bullish reversal, but:
Confirmation is mandatory
Until a breakout occurs, the dominant trend remains bearish
The optimal approach is to wait for confirmation rather than anticipate.
---
#LTC #Litecoin #LTCUSDT #FallingWedge #BullishReversal #CryptoAnalysis #TechnicalAnalysis #Altcoin #CryptoTrading

LITECOIN IS FULLY CHARGEDHey traders! LTC has been quietly accumulating energy in this tight range for days — all the coils are compressed, and the spring is about to pop!
I’m expecting a strong impulsive move upward very soon.
My targets:
🎯 Target 1 — 89
🎯 Target 2 — 91.20 (main zone I’m watching)
❌Invalidation (plan cancelled): 85.89
If we break and hold above the recent highs, this thing can run fast. Watching it closely!
Who’s in? Smash the like & follow for updates 🔥

LTC/USDT — The Calm Before The Storm: A Major Move Is Brewing!Litecoin is currently trading inside an extended Symmetrical Triangle formation that has been developing since mid-2021.
Each price swing is tightening between two major trendlines, compressing volatility like a coiled spring ready to snap.
📊 At around $104, LTC is sitting right at a decision point, where the battle between bulls and bears is approaching its climax.
The next confirmed breakout — either up or down — will likely define Litecoin’s macro trend for the months ahead.
---
Pattern & Technical Structure
Main Pattern: Symmetrical Triangle (neutral → directional bias confirmed only after breakout)
Upper Resistance Zone: $110–$120 (descending trendline)
Horizontal Resistance: $134 (key pivot level), followed by $281–$295 (major historical resistance)
Support Zone: rising trendline around $85–$90, with strong historical supports at $69 and $40
Volatility: extremely compressed, suggesting an imminent expansion phase
---
Bullish Scenario
If LTC manages to break and close weekly above $120–$134 with solid volume, a macro trend reversal could ignite.
🎯 Initial Target: $134 (confirmation zone)
🎯 Mid-term Target: $200
🎯 Major Target: $281–$295
🛡️ Invalidation: weekly close back below the upper trendline
Such breakouts after long compressions often lead to explosive upside moves, as months of built-up energy get unleashed in one direction.
---
Bearish Scenario
If sellers take control and LTC breaks below $85, a significant downside move could unfold.
⚠️ First Target: $69
⚠️ Next Target: $46–$40 (major liquidity zone)
🛡️ Invalidation: price reclaims the broken support on a weekly close
A clean breakdown would likely trigger a capitulation flush, but could also offer long-term accumulation opportunities near historical lows.
---
Market Outlook & Conclusion
Litecoin is now sitting at the tip of a multi-year triangle — a structure that rarely stays quiet for long.
When such formations appear on the weekly timeframe, the next expansion phase usually brings a major directional shift.
Both sides are on alert — one decisive candle could rewrite the chart entirely.
📈 Key takeaway: Stay patient, stay prepared.
The volatility storm is loading — and it’s only a matter of time before it erupts.
---
#LTCUSDT #Litecoin #CryptoAnalysis #BreakoutAlert #SymmetricalTriangle #TechnicalAnalysis #CryptoTA #MarketStructure #SwingTrading

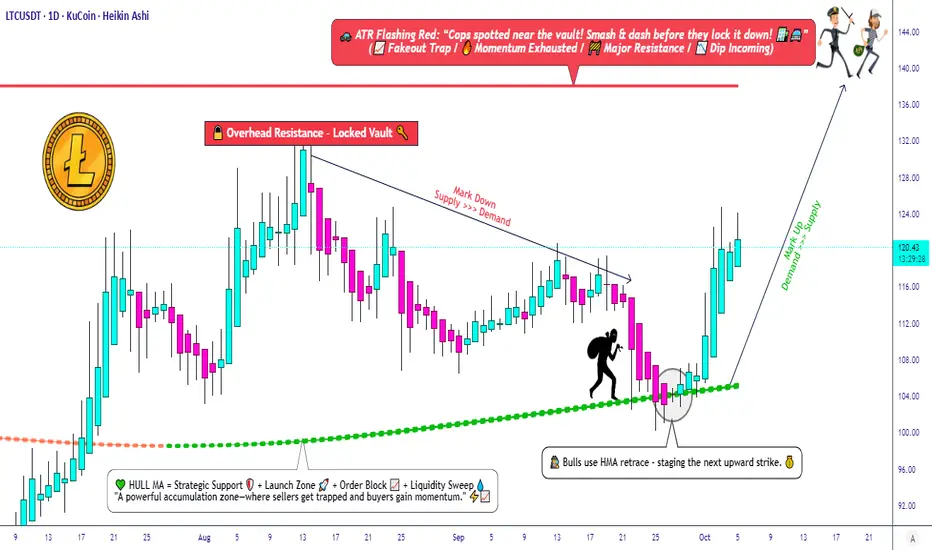
LTC/USDT — Technical Alignment Signals a Fresh Upside Phase!🎭 LTC/USDT: The Market Heist Blueprint | Swing/Day Trade Setup
💰 LITECOIN vs TETHER - Where Opportunity Meets Strategy
📊 THE SETUP
Asset: LTC/USDT (Litecoin/Tether)
Market Approach: Swing/Day Trade Strategy
Trade Style: "Thief Method" - Layered Entry System 🎯
🔍 TECHNICAL CONFIRMATION
✅ Bullish Signal Confirmed:
Hull Moving Average showing bullish retracement pattern
Heiken Ashi printing bullish doji candles (classic reversal signal)
Momentum shifting in favor of bulls
The technical confluence is aligning beautifully here, folks. When the HMA retraces and Heiken Ashi doji appears, we're looking at potential momentum shift territory.
🎯 THE THIEF'S ENTRY PLAN
Method: Layered Limit Orders (The "Thief Strategy")
This isn't your typical "one shot, one kill" approach. We're spreading our risk across multiple entry points:
Suggested Layer Entries:
Layer 1: $112
Layer 2: $114
Layer 3: $116
Layer 4: $118
Layer 5: $120
💡 Pro Tip: You can add more layers based on your risk tolerance and position size. The beauty of layering? You average your entry and reduce timing risk. Feel free to enter at any price level within this range.
🛡️ RISK MANAGEMENT
Stop Loss Zone: $108
⚠️ Important Disclaimer: This is MY stop loss level based on my analysis. You are the captain of your own ship! Set your stop loss based on YOUR risk tolerance. This is your money, your rules, your responsibility.
🎪 TARGET & EXIT STRATEGY
Primary Target: $140
Strategic Exit: $138.00
📍 Key Resistance Alert:
Around the $140 level, we've got the ATR line acting like a police barricade 🚔 - expect strong resistance here. This zone typically sees:
Overbought conditions
Potential bull traps
Heavy profit-taking
Exit Philosophy: When the cops show up (resistance hits), it's time for the thieves to exit with the loot! 💰
⚠️ Another Important Note: This target is based on technical analysis, but YOU decide when to take profits. Your account, your choices, your gains. Manage your risk accordingly!
🔗 RELATED PAIRS TO WATCH
Keep an eye on these correlated assets:
Major Crypto Pairs:
BINANCE:BTCUSDT - Bitcoin often leads altcoin movements; LTC tends to follow BTC trends
BINANCE:ETHUSDT - Ethereum correlation provides broader market sentiment
BINANCE:BCHUSDT - Similar payment-focused crypto, often moves in tandem with LTC
LTC Crosses:
BINANCE:LTCBTC - Shows LTC strength relative to Bitcoin
GEMINI:LTCETH - Alternative correlation metric
Key Correlation: When Bitcoin pumps, Litecoin typically follows with amplified moves. Watch BTC dominance for clues on altcoin season intensity.
🎓 KEY TAKEAWAYS
✨ Hull Moving Average retracement + bullish Heiken Ashi = momentum shift
✨ Layered entries reduce timing risk and improve average entry price
✨ ATR-based resistance at $140 = natural profit-taking zone
✨ Multiple stop loss and take profit levels based on individual risk profiles
✨ Correlation with BTC/ETH movements strengthens the setup
⚖️ LEGAL DISCLAIMER
🎭 This analysis uses the "Thief Style" trading strategy as an educational and entertainment concept. This is NOT financial advice. Trading cryptocurrencies carries substantial risk of loss. All entry prices, stop losses, and targets are for educational purposes only.
You are solely responsible for your trading decisions. Past performance does not guarantee future results. Always do your own research and never risk more than you can afford to lose. This is just one trader's perspective shared for fun and community engagement.
🚀 ENGAGE & SUPPORT
✨ If you find value in my analysis, a 👍 and 🚀 boost is much appreciated — it helps me share more setups with the community!
Happy Trading, Thief OG's! 🎩💎
#LTCUSDT #Litecoin #CryptoTrading #TechnicalAnalysis #SwingTrading #DayTrading #HullMovingAverage #HeikinAshi #LayeredEntry #CryptoStrategy #ThiefMethod #RiskManagement #TradingSetup #Altcoins #CryptoSignals
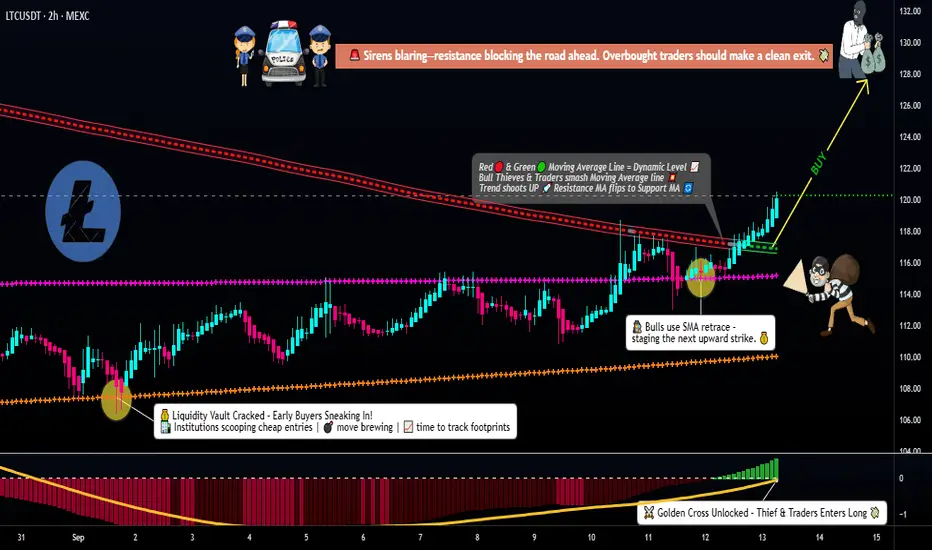
Join LTC/USDT’s Bull Run: MACD Confirms the Move!🚀 LTC/USDT "Litecoin vs Tether" Market Money Looting Plan
📌 Plan
🔹 Buyers enter on Simple Moving Average (SMA) pullback
🔹 Retest push adds momentum for confirmation
🔹 LSMA breakout confirms bullish continuation trend
🔹 MACD golden cross supports bullish strength and entry timing
🎯 Entry Plan
I’m applying a layered limit order strategy (multiple entries) to scale in smoothly instead of going all-in. My layers are:
116.00 💵
117.00 💵
118.00 💵
119.00 💵
120.00 💵
👉 You can always add or adjust based on your own style — layering is flexible.
🛡️ Risk Management
My protective Stop Loss (SL) is placed at 114.00 after breakout confirmation.
⚠️ Important: Risk management is personal. Adjust SL based on your own plan, style & tolerance.
🎯 Target / Exit Strategy
Upside police resistance 🚔 is waiting near 128.00 (strong resistance + overbought zone + possible liquidity trap). The smart play is to escape before getting caught — secure your profits and move! 💨
⚠️ Note: Exit levels are suggestions. You can adapt based on your own strategy.
🔗 Related Pairs to Watch
BINANCE:BTCUSDT → Leader of crypto moves, if Bitcoin pumps, LTC often follows.
BINANCE:ETHUSDT → Strong correlation with LTC, momentum shifts can echo.
BINANCE:BCHUSDT → Competes in similar use case narrative; price moves can align.
BINANCE:DOGEUSDT → Meme momentum sometimes drags mid-cap alts like LTC.
📊 Key Points Recap
✅ SMA Pullback + Retest push = Entry foundation
✅ LSMA breakout = Bullish confirmation
✅ MACD golden cross = Momentum backup
✅ Layered entries (116–120) for scaling in
✅ Exit around 128.00 before “trap zone”
✨ “If you find value in my analysis, a 👍 and 🚀 boost is much appreciated — it helps me share more setups with the community!”
#LTCUSDT #Litecoin #CryptoTrading #SwingTrade #DayTrade #TradingStrategy #TechnicalAnalysis #CryptoCommunity #Altcoins #ChartAnalysis
#LTCUSDT: On The Way To $200, Get Ready For Swing Buy! Hey there!
Evening Everyone,
The price of this crypto is currently in a bullish formation, and it looks like it’s on the rise, potentially reaching $200. The best thing you can do is wait for the price to break out of the downtrend and then keep going up. You could set a target at $150 and then $200, which would be a swing move.
Good luck and trade safely! 😊
Thanks a bunch for your unwavering support! ❤️🚀
If you’d like to lend a hand, here are a few ways you can contribute:
- Like our ideas
- Comment on our ideas
- Share our ideas
Cheers,
Team Setupsfx_

LTC/USDT Weekly – Massive Breakout Loading? 3-Year Triangle
📌 Litecoin is now standing at one of its most crucial technical levels since the 2021 bull run. After 3 years of compression inside a massive symmetrical triangle, price action is nearing a major breakout point. Will LTC finally explode upward, or are bears still in control? Let’s break it down!
🧠 Technical Pattern: Long-Term Symmetrical Triangle
This is a classic pattern that signals a prolonged phase of buyer-seller equilibrium, where lower highs and higher lows converge into a point of tension. Historically, this type of formation often ends in a sharp breakout in either direction.
🔺 Pattern Duration: Since May 2021
🔺 Converging trendlines: Tightening into Q3/Q4 2025
🔺 Historical breakout probability: ~60-75% chance of upward breakout in symmetrical triangles
🟢 Bullish Scenario (Upside Breakout):
If LTC breaks above the upper triangle resistance (~$100 – $115) with strong volume, it could ignite a major rally due to:
✅ The end of a multi-year consolidation
✅ Renewed investor confidence and potential altcoin season
✅ Technical confirmation of breakout from a long-term base
🎯 Upside Targets:
$134.66 – Psychological resistance and minor horizontal supply zone
$230.13 – Major resistance area from 2022 breakdown
$280.87 – Fib extension & key structural level
$325.00 – Pre-blowoff level from 2021
$387.91 – All-Time High (ATH) retest zone
📌 Based on the triangle’s base projection, a technical target of ~$280+ is plausible if breakout confirms.
🔴 Bearish Scenario (Downside Breakdown):
If LTC fails to hold the rising support (~$85), it may trigger a strong bearish reaction, especially if Bitcoin also loses key support levels.
📉 Downside Levels to Watch:
$65.00 – Key horizontal support
$49.00 – $39.00 – Historical demand zone from early 2020
$23.90 – Pandemic-era low (extreme bearish target)
📌 Breakdown confirmation requires a weekly close below support with high volume, ideally accompanied by macro risk-off sentiment.
🧩 Key Confirmations to Watch For:
1. Volume Surge on Breakout – Is the move supported by strong volume?
2. Successful Retest – Does price retest the breakout level as support?
3. Momentum Indicators – Weekly RSI > 50 and MACD bullish crossover can strengthen conviction.
📊 Fundamental & Sentiment Context:
Litecoin halving occurred in August 2023. Historically, price rallies follow 6–12 months after.
Often dubbed the “digital silver”, LTC remains relevant during altcoin cycles.
Whale accumulation has increased slowly since late 2024—possibly indicating long-term positioning.
✅ Conclusion & Strategy:
Litecoin is like a technical time bomb waiting to explode. Traders and investors should prepare for both breakout and breakdown scenarios. Patience and confirmation are key. Don’t chase—let the chart speak first.
🎯 Plan the trade, trade the plan. Don’t FOMO into noise—wait for structure!
#LTCUSDT #LitecoinBreakout #CryptoTechnicalAnalysis #SymmetricalTriangle #BullishSetup #AltcoinSeason #Litecoin2025 #CryptoChart #TrianglePattern #LitecoinRally

LTCUSDT 1D AnalysisLTC ~ 1D Analysis
#LTC Buy after successfully breaking this resistance line with a short term target of at least 10%+ from here.

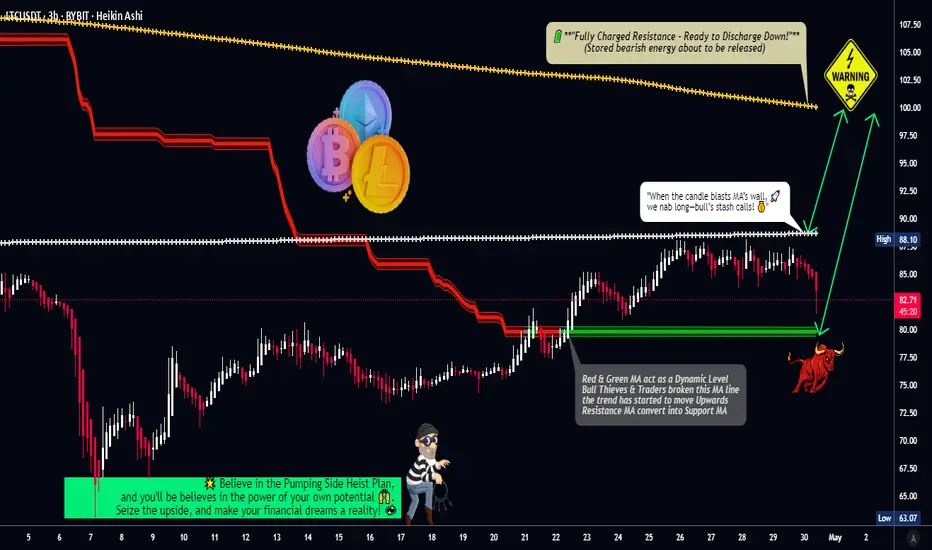
LTC/USDT "Litecoin vs Tether" Crypto Heist Plan (Day/Swing)🌟Hi! Hola! Ola! Bonjour! Hallo! Marhaba!🌟
Dear Money Makers & Robbers, 🤑 💰💸✈️
Based on 🔥Thief Trading style technical and fundamental analysis🔥, here is our master plan to heist the LTC/USDT "Litecoin vs Tether" Crypto Market. Please adhere to the strategy I've outlined in the chart, which emphasizes long entry. Our aim is to escape near the high-risk Yellow MA Zone. Risky level, overbought market, consolidation, trend reversal, trap at the level where traders and bearish robbers are stronger. 🏆💸"Take profit and treat yourself, traders. You deserve it!💪🏆🎉
Entry 📈 : "The heist is on! Wait for the MA breakout (90.00) then make your move - Bullish profits await!"
however I advise to Place Buy stop orders above the Moving average (or) Place buy limit orders within a 15 or 30 minute timeframe most recent or swing, low or high level for Pullback entries.
📌I strongly advise you to set an "alert (Alarm)" on your chart so you can see when the breakout entry occurs.
Stop Loss 🛑: "🔊 Yo, listen up! 🗣️ If you're lookin' to get in on a buy stop order, don't even think about settin' that stop loss till after the breakout 🚀. You feel me? Now, if you're smart, you'll place that stop loss where I told you to 📍, but if you're a rebel, you can put it wherever you like 🤪 - just don't say I didn't warn you ⚠️. You're playin' with fire 🔥, and it's your risk, not mine 👊."
📍 Thief SL placed at the nearest/swing low level Using the 3H timeframe (77.50) Day / Swing trade basis.
📍 SL is based on your risk of the trade, lot size and how many multiple orders you have to take.
🏴☠️Target 🎯: 100.00 (or) Escape Before the Target
🧲Scalpers, take note 👀 : only scalp on the Long side. If you have a lot of money, you can go straight away; if not, you can join swing traders and carry out the robbery plan. Use trailing SL to safeguard your money 💰.
💰💵💸LTC/USDT "Litecoin vs Tether" Crypto Market Heist Plan (Swing/Day) is currently experiencing a bullishness,., driven by several key factors. .☝☝☝
📰🗞️Get & Read the Fundamental, Macro, COT Report, On Chain Analysis, Sentimental Outlook, Intermarket Analysis, Future trend targets... go ahead to check 👉👉👉🔗🔗🔗
⚠️Trading Alert : News Releases and Position Management 📰🗞️🚫🚏
As a reminder, news releases can have a significant impact on market prices and volatility. To minimize potential losses and protect your running positions,
we recommend the following:
Avoid taking new trades during news releases
Use trailing stop-loss orders to protect your running positions and lock in profits
💖Supporting our robbery plan 💥Hit the Boost Button💥 will enable us to effortlessly make and steal money 💰💵. Boost the strength of our robbery team. Every day in this market make money with ease by using the Thief Trading Style.🏆💪🤝❤️🎉🚀
I'll see you soon with another heist plan, so stay tuned 🤑🐱👤🤗🤩
LTCUSDT 1D Analysis LTC ~ 1D Analysis
#LTC Buy after successfully breaking this resistance line or buy when retesting this support block with a short term target of at least 10%+.

LTCUSDT 1D AnalysisLTC ~ 1D Analysis
#LTC Buy after successfully penetrating this resistant line with a short -term target of at least 10%+ from here.

LTC/USD "LiteCoin vs US Dollar" Crypto Heist (Scalping / Day)🌟Hi! Hola! Ola! Bonjour! Hallo! Marhaba!🌟
Dear Money Makers & Robbers, 🤑 💰💸✈️
Based on 🔥Thief Trading style technical and fundamental analysis🔥, here is our master plan to heist the LTC/USD "Lite Coin vs US Dollar" Crypto Market. Please adhere to the strategy I've outlined in the chart, which emphasizes long entry. Our aim is to escape near the high-risk MA Zone. Risky level, overbought market, consolidation, trend reversal, trap at the level where traders and bearish robbers are stronger. 🏆💸"Take profit and treat yourself, traders. You deserve it!💪🏆🎉
Entry 📈 : "The heist is on! Wait for the MA breakout (80.00) then make your move - Bullish profits await!"
however I advise to Place Buy stop orders above the Moving average (or) Place buy limit orders within a 15 or 30 minute timeframe most recent or swing, low or high level for pullback entries.
📌I strongly advise you to set an "alert (Alarm)" on your chart so you can see when the breakout entry occurs.
Stop Loss 🛑: "🔊 Yo, listen up! 🗣️ If you're lookin' to get in on a buy stop order, don't even think about settin' that stop loss till after the breakout 🚀. You feel me? Now, if you're smart, you'll place that stop loss where I told you to 📍, but if you're a rebel, you can put it wherever you like 🤪 - just don't say I didn't warn you ⚠️. You're playin' with fire 🔥, and it's your risk, not mine 👊."
📍 Thief SL placed at the recent/swing low level Using the 3H timeframe (72.00) Scalping/Day trade basis.
📍 SL is based on your risk of the trade, lot size and how many multiple orders you have to take.
🏴☠️Target 🎯: 88.00 (or) Escape Before the Target
💰💵💸LTC/USD "LiteCoin vs US Dollar" Crypto Market Heist Plan (Day / Scalping Trade) is currently experiencing a bullishness,., driven by several key factors.👇👇👇
📰🗞️Get & Read the Fundamental, Macro, COT Report, On Chain Analysis, Sentimental Outlook, Intermarket Analysis, Future trend targets.. go ahead to check 👉👉👉🔗
⚠️Trading Alert : News Releases and Position Management 📰 🗞️ 🚫🚏
As a reminder, news releases can have a significant impact on market prices and volatility. To minimize potential losses and protect your running positions,
we recommend the following:
Avoid taking new trades during news releases
Use trailing stop-loss orders to protect your running positions and lock in profits
💖Supporting our robbery plan 💥Hit the Boost Button💥 will enable us to effortlessly make and steal money 💰💵. Boost the strength of our robbery team. Every day in this market make money with ease by using the Thief Trading Style.🏆💪🤝❤️🎉🚀
I'll see you soon with another heist plan, so stay tuned 🤑🐱👤🤗🤩

LTCUSDT 1WLTC ~ 1W Analysis
#LTC Buy gradually when re -testing this support with a short -term target of at least 15%+.

LTC/USD "Litecoin vs US Dollar" Crypto Market Heist Plan🌟Hi! Hola! Ola! Bonjour! Hallo!🌟
Dear Money Makers & Robbers, 🤑💰🐱👤🐱🏍
Based on 🔥Thief Trading style technical and fundamental analysis🔥, here is our master plan to heist the LTC/USD "Litecoin vs US Dollar" Crypto market. Please adhere to the strategy I've outlined in the chart, which emphasizes long entry. Our aim is the high-risk Red Zone. Risky level, overbought market, consolidation, trend reversal, trap at the level where traders and bearish robbers are stronger. 🏆💸Book Profits Be wealthy and safe trade.💪🏆🎉
Entry 📈 : "The vault is wide open! Swipe the Bullish loot at any price - the heist is on!
however I advise placing Buy limit orders within a 15 or 30 minute timeframe. Entry from the most recent or closest low or high level should be in retest.
Stop Loss 🛑: Thief SL placed at 110.00 (swing Trade Basis) Using the 4H period, the recent / nearest low level.
SL is based on your risk of the trade, lot size and how many multiple orders you have to take.
Target 🎯: 165.00 (or) Escape Before the Target
Scalpers, take note 👀 : only scalp on the Long side. If you have a lot of money, you can go straight away; if not, you can join swing traders and carry out the robbery plan. Use trailing SL to safeguard your money 💰.
📰🗞️Fundamental, Macro, COT, Sentimental Outlook:
LTC/USD "Litecoin vs US Dollar" Crypto Market market is currently experiencing a bullish trend,., driven by several key factors.
🔱Fundamental Analysis
Litecoin Adoption: Growing adoption of Litecoin as a payment method, with increasing transaction volumes.
Halving Event: The upcoming halving event in August 2025 is expected to reduce Litecoin's block reward, potentially increasing demand and prices.
Competition from Other Cryptocurrencies: Increasing competition from other cryptocurrencies, such as Bitcoin and Ethereum, may impact Litecoin's market share.
🔱Macro Economics
Global Economic Trends: The ongoing global economic recovery is expected to drive up demand for cryptocurrencies, including Litecoin.
Inflation Rate: Global inflation is expected to rise to 3.8% in 2025, potentially increasing demand for cryptocurrencies as a hedge against inflation.
Interest Rates: Central banks are expected to maintain low interest rates in 2025, supporting cryptocurrency markets.
🔱COT Data
Net Long Positions: Institutional traders have increased their net long positions in Litecoin to 60%.
COT Ratio: The COT ratio has risen to 2.5, indicating a bullish trend.
Open Interest: Open interest in Litecoin futures has increased by 20% over the past month, indicating growing investor interest.
🔱Sentimental Outlook
Institutional Sentiment: 65% bullish, 35% bearish.
Retail Sentiment: 60% bullish, 40% bearish.
Market Mood: The overall market mood is bullish, with a sentiment score of +40.
🔱Technical Analysis
Moving Averages: 50-period SMA: 120.00, 200-period SMA: 110.00.
Relative Strength Index (RSI): 4-hour chart: 62.21, daily chart: 58.14.
Bollinger Bands: 4-hour chart: 130.00 (upper band), 120.00 (lower band).
🔱Next Move Prediction
Bullish Move: Potential upside to 150.00-170.00.
Key Support Levels: 120.00, 110.00.
Key Resistance Levels: 150.00, 170.00.
🔱Market Overview
Current Price: 130.00
Daily Change: 2.5%
Weekly Change: 10.2%
Overall Outlook
🔱The overall outlook for LTC/USD is bullish, driven by a combination of fundamental, technical, and sentimental factors. The expected increase in Litecoin adoption, upcoming halving event, and bullish market sentiment are all supporting the bullish trend. However, investors should remain cautious of potential downside risks, including changes in global economic trends and unexpected regulatory developments.
⚠️Trading Alert : News Releases and Position Management 📰 🗞️ 🚫🚏
As a reminder, news releases can have a significant impact on market prices and volatility. To minimize potential losses and protect your running positions,
we recommend the following:
Avoid taking new trades during news releases
Use trailing stop-loss orders to protect your running positions and lock in profits
📌Please note that this is a general analysis and not personalized investment advice. It's essential to consider your own risk tolerance and market analysis before making any investment decisions.
📌Keep in mind that these factors can change rapidly, and it's essential to stay up-to-date with market developments and adjust your analysis accordingly.
💖Supporting our robbery plan will enable us to effortlessly make and steal money 💰💵 Tell your friends, Colleagues and family to follow, like, and share. Boost the strength of our robbery team. Every day in this market make money with ease by using the Thief Trading Style.🏆💪🤝❤️🎉🚀
I'll see you soon with another heist plan, so stay tuned 🤑🐱👤🤗🤩

LTCUSDT 1WLTC ~ 1W Analysis
#LTC This support block continues to be maintained so far.
Buy gradually from here with a minimum target of 20%+.

LTCUSDT LONG 1H (Update/Results)From the main review, in which I indicated personal expectations, new market variables arrived both in terms of goals and entry.
On the 1D chart, the price interacted with the key area of interest (poi), removed the liq of the nearest min. and hit the order block 15m TF
New goal on CHoCH target, has been achieved.
stop moved to profit!

LTCUSDT 1H LONGOn higher timeframes, the asset forms many liquidity pools and has aggressive market purchases, thereby protecting the break levels of the structure!
Previously, the asset went under the POI range , but returned on good volume with full-bodied candles.
I am considering a long position at the specified price on a trading chart with targets:
$123.69
$131.20
$141.22
Risk management - 1% on stop order

LTC Aims for $140 After Mid S/R BreakoutPrice is trading within a broad range between the $98 support and $140 resistance. After breaking out of the mid S/R line around $115, the price could now move toward the $140 target.
A breakout above $140 may trigger a strong bullish rally, while a drop below $98 signals bearish risks. Watch for volume confirmation!

Litecoin (LTC) - Potential Bullish Breakout in the Next 48 HoursHello fellow traders!
This analysis outlines my outlook for Litecoin's price action over the next 48 hours, leading up to the reopening of traditional stock markets on Monday. I'm anticipating a potential upward move, and here's my rationale:
Current Setup:
I've identified a potential bullish setup on the Litecoin ( BINANCE:LTCUSDT LTC/USDT) chart. Based on my analysis, I've placed a buy stop order at $127.50 . This means that my long position will be automatically triggered if the price reaches this level.
Target Levels:
If the price breaks through the $127.50 level and activates my order, I have two primary price targets in mind:
Target 1: $145.00
Target 2: $165.20
Leverage:
I'll be using 8x leverage for this LTC/USDT trade, amplifying both potential gains and losses.
Important Considerations:
* I'm using a buy stop order as it allows me to enter the market only when the price is going up.
* I have set two targets as they are the resistance levels that the price is likely to go towards.
* Remember, using leverage magnifies your risk. Manage your position size accordingly and only risk what you can afford to lose.
Disclaimer:
This is my personal analysis and not financial advice. Always conduct your own research and due diligence before making any trading decisions. Cryptocurrency markets are highly volatile, and past performance is not indicative of future results.
I wish you all profitable trades!

LTC/USDT "Litecoin vs Tether" Crypto Market Bullish Heist Plan🌟Hi! Hola! Ola! Bonjour! Hallo!🌟
Dear Money Makers & Robbers, 🤑 💰
Based on 🔥Thief Trading style technical and fundamental analysis🔥, here is our master plan to heist the LTC/USDT "Litecoin vs Tether" Crypto market. Please adhere to the strategy I've outlined in the chart, which emphasizes long entry. Our aim is the high-risk Red Zone. Risky level, overbought market, consolidation, trend reversal, trap at the level where traders and bearish robbers are stronger. Be wealthy and safe trade.💪🏆🎉
Entry 📈 : You can enter a Bull trade after the breakout of Resistance Level.
however I advise placing Buy limit orders within a 15 or 30 minute timeframe. Entry from the most recent or closest low or high level should be in retest.
Stop Loss 🛑: Using the 2H period, the recent / nearest low or high level.
Goal 🎯: 120.00
Scalpers, take note 👀 : only scalp on the Long side. If you have a lot of money, you can go straight away; if not, you can join swing traders and carry out the robbery plan. Use trailing SL to safeguard your money 💰.
Warning⚠️ : Our heist strategy is incompatible with Fundamental Analysis news 📰 🗞️. We'll wreck our plan by smashing the Stop Loss 🚫🚏. Avoid entering the market right after the news release.
Fundamental Outlook 📰🗞️
Based on the fundamental analysis, I would conclude that the LTC/USDT (Litecoin/Tether) pair is: Bullish
Reasons:
Adoption and usage: Increasing adoption and usage of Litecoin, particularly in the payments and e-commerce sectors, could drive up demand and price.
Technological advancements: Ongoing technological advancements, such as the implementation of the MimbleWimble protocol, could improve the scalability, security, and usability of the Litecoin network.
Halving event: The upcoming halving event, which reduces the block reward from 25 LTC to 12.5 LTC, could lead to a decrease in supply and increase in price.
Market sentiment: A shift in market sentiment, particularly among institutional investors and traders, could drive up demand and price.
However, it's essential to consider the following risks:
Regulatory uncertainty: Uncertainty and potential regulatory changes, particularly in the US and China, could negatively impact the price of Litecoin.
Competition from other cryptocurrencies: Increasing competition from other cryptocurrencies, particularly those with similar use cases and technological advancements, could negatively impact the price of Litecoin.
Security concerns: Security concerns, such as the potential for 51% attacks or other vulnerabilities, could negatively impact the price of Litecoin.
Bullish Scenario:
Increasing adoption and usage of Litecoin, particularly in the payments and e-commerce sectors, drives up demand and price
Technological advancements, such as the implementation of the MimbleWimble protocol, improve the scalability, security, and usability of the Litecoin network
Please note that this is a general analysis and not personalized investment advice. It's essential to consider your own risk tolerance and market analysis before making any investment decisions.
Take advantage of the target and get away 🎯 Swing Traders Please reserve the half amount of money and watch for the next dynamic level or order block breakout. Once it is resolved, we can go on to the next new target in our heist plan.
Keep in mind that these factors can change rapidly, and it's essential to stay up-to-date with market developments and adjust your analysis accordingly.
💖Supporting our robbery plan will enable us to effortlessly make and steal money 💰💵 Tell your friends, Colleagues and family to follow, like, and share. Boost the strength of our robbery team. Every day in this market make money with ease by using the Thief Trading Style.🏆💪🤝❤️🎉🚀
I'll see you soon with another heist plan, so stay tuned 🫂

LTCUSDT 1WLTC Update ~ 1W
#LTC Retesting this support Block,. buy gradually inside this support block,. Minimum target 20%+ from here.

LTC / USDT : Setting the stage for a Bullish Run after retestLTC/USDT: Setting the Stage for a Bullish Run After Retest
LTC/USDT is gearing up for an impressive move 📈 as it successfully retests a critical breakout zone 📊. The pair is showing signs of strength and resilience, hinting at the potential for a sustained bullish rally 🚀. Now is the time to watch this pair closely and prepare for a possible upward surge.
Key insights:
1. Retest Confirmation: LTC/USDT has retested the breakout level, which is now acting as a solid support zone. This is a textbook signal for the continuation of an uptrend ✅.
2. Bullish Volume Patterns: Increasing trading volume during the retest phase suggests buyers are stepping in, reinforcing bullish sentiment 🔥.
3. Momentum Indicators: Indicators like RSI and MACD are turning bullish ⚡, signaling the likelihood of upward momentum in the coming days.
Steps to confirm the bullish move:
Look for a strong bounce off the retest zone with a clear 4H or daily candle close above key levels 📍.
Monitor trading volume for a noticeable increase during upward moves 📊.
Wait for confirmation of higher highs and higher lows to validate the bullish trend ✅.
Stay cautious of false breakouts or sharp reversals below the support zone ⚠️.
Risk management strategies:
Use stop-loss orders below the retest zone to minimize risk 🔒.
Scale your position size based on your overall trading strategy and risk tolerance 🎯.
This analysis is for educational purposes only and not financial advice. Always conduct your own research (DYOR) 🔍 before making any investment decisions.
