The start of something great is brewingLitecoin is showing clear signs of an automatic rally. This is the things you look for if the price moves lower.
1. One or Two breaks below the current low with the price bouncing back into the range after every low, this is a clear sign of accumulation.
2. Price moving to the top of the range after the spring has formed.
So I will only be bullish after I see the accumulation pattern play out.
Trade safe
Ltcusdtlong

LTCUSDT - Symmetrical Triangle: Breakout or Breakdown?Litecoin (LTC/USDT) on the Weekly (1W) timeframe is currently in a long-term consolidation phase following a major decline from its previous cycle high. Price action is becoming increasingly compressed and is now approaching the apex of a large structure, signaling an upcoming major directional move.
The current price is trading around $82–85, positioned near the middle of the triangle, which represents a critical decision zone for the market.
---
Pattern Explanation
The chart is forming a large Symmetrical Triangle, characterized by:
Lower highs → descending resistance (upper yellow trendline)
Higher lows → ascending support (lower yellow trendline)
Pattern structure developing from 2022 through early 2026
Gradually declining volume → a typical sign of market compression before a breakout
A Symmetrical Triangle is a neutral continuation pattern, meaning the next major move will be determined by a confirmed breakout or breakdown.
---
Key Levels
Major Resistance Levels:
$95 – $100 → minor resistance / mid-range area
$120 → strong historical resistance
$134 → major supply zone
$281 → long-term major resistance / macro target
Major Support Levels:
$82 – $80 → current support zone
$63 → structural support
$40 → swing low / extreme downside support
---
Bullish Scenario
The bullish scenario will be confirmed if:
1. Price breaks above the descending trendline
2. A weekly close above resistance, supported by increasing volume
Bullish Targets (Step-by-Step):
$95 – $100 (initial target)
$120 – $134 (major distribution zone)
$180 – $280 (measured move of the triangle if bullish continuation occurs)
A confirmed breakout could mark the start of a new medium- to long-term uptrend.
---
Bearish Scenario
The bearish scenario becomes valid if:
1. Price fails to break resistance
2. A weekly close below the ascending support trendline
Bearish Targets (Step-by-Step):
$63 → key support
$40 → historical lower boundary
A breakdown from this structure would suggest a continuation of bearish or prolonged sideways conditions.
---
Conclusion
LTC is currently trading within a major decision zone on the weekly timeframe.
Traders and investors are advised to wait for clear confirmation, rather than anticipating direction inside the triangle.
➡ Breakout = potential start of a new bullish trend
➡ Breakdown = risk of further downside or extended consolidation
Patience is crucial during high-compression market phases like this.
---
#LTCUSDT #Litecoin #Altcoin #CryptoMarket
#CryptoAnalysis #AltcoinAnalysis #WeeklyChart
#SymmetricalTriangle #TrianglePattern #TriangleBreakout

LTC/USDT — Falling Wedge Formation Signals Potential ReversalOn the 8-hour timeframe, Litecoin (LTC) remains in an overall downtrend. However, the price structure is not moving in parallel lines, indicating that this is not a descending channel. The upper resistance trendline is steeper than the lower support trendline, signaling weakening bearish momentum.
Price is currently trading near the final phase of the pattern, approaching the apex, where a strong directional move (breakout or breakdown) is likely to occur.
---
Pattern & Price Structure
Pattern Identified: Falling Wedge (Bullish Reversal Pattern)
Key characteristics visible on the chart:
Continuous lower highs, forming a sharply declining resistance
Lower lows, but with decreasing downside momentum
Price compression, indicating reduced selling pressure
Non-parallel trendlines, distinguishing it from a descending channel
Technically, a falling wedge forming within a downtrend often precedes a bullish trend reversal, pending confirmation.
---
Key Levels
Support Zones:
80.0 USDT (current reaction zone)
76.0 – 72.6 USDT (major support & pattern invalidation level)
Resistance Zones:
85.8 USDT (near-term resistance)
93.5 – 96.5 USDT (key structural resistance)
104 – 110 USDT (major supply zone)
---
Bullish Scenario
The bullish scenario becomes valid if:
1. Price breaks above the falling wedge resistance
2. An 8H candle closes above 85.8 USDT
3. The market prints a first higher high as confirmation
Bullish Targets:
93.5 – 96.5 USDT
104 USDT
110 USDT (if momentum strengthens)
A confirmed breakout would suggest a shift from bearish control to recovery phase.
---
Bearish Scenario (Pattern Invalidation)
The bearish scenario occurs if:
Price fails to break out from the wedge
76 USDT support is broken with strong volume
Bearish Targets:
72.6 USDT
Extension toward the 70 USDT area if selling pressure accelerates
Such a move would invalidate the falling wedge and confirm bearish continuation.
---
Conclusion
Price action aligns more accurately with a falling wedge
The pattern suggests potential bullish reversal, but:
Confirmation is mandatory
Until a breakout occurs, the dominant trend remains bearish
The optimal approach is to wait for confirmation rather than anticipate.
---
#LTC #Litecoin #LTCUSDT #FallingWedge #BullishReversal #CryptoAnalysis #TechnicalAnalysis #Altcoin #CryptoTrading

#LTC/USDT analysis.Give me some energy !!!#LTC
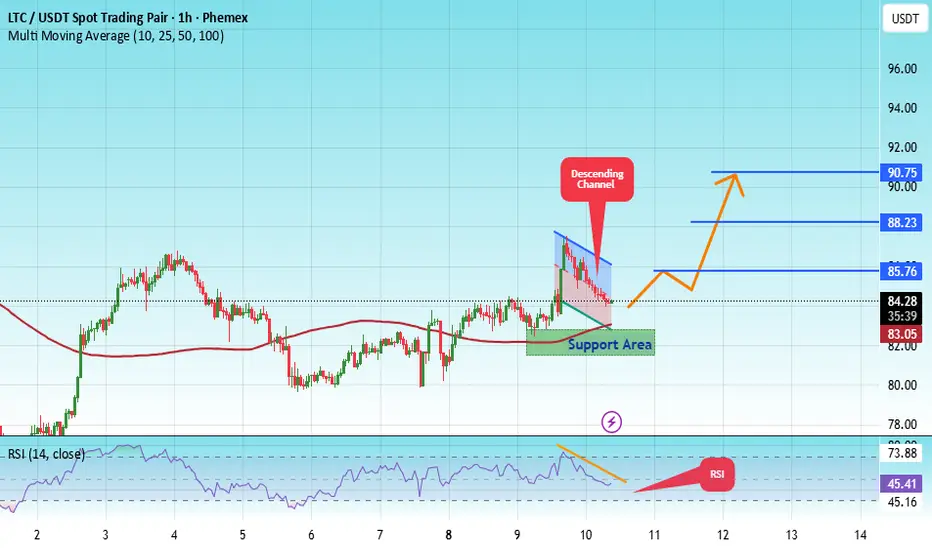
The price is moving in a descending channel on the 1-hour timeframe. It has reached the lower boundary and is heading towards breaking above it, with a retest of the upper boundary expected.
We have a downtrend on the RSI indicator, which has reached near the lower boundary, and an upward rebound is expected.
There is a key support zone in green at 82.00. The price has bounced from this level multiple times and is expected to bounce again.
We have a trend towards stability above the 100-period moving average, as we are moving close to it, which supports the upward movement.
Entry price: 84.29
First target: 85.76
Second target: 88.23
Third target: 90.75
Don't forget a simple principle: money management.
Place your stop-loss below the support zone in green.
For any questions, please leave a comment.
Thank you.
LITECOIN IS FULLY CHARGEDHey traders! LTC has been quietly accumulating energy in this tight range for days — all the coils are compressed, and the spring is about to pop!
I’m expecting a strong impulsive move upward very soon.
My targets:
🎯 Target 1 — 89
🎯 Target 2 — 91.20 (main zone I’m watching)
❌Invalidation (plan cancelled): 85.89
If we break and hold above the recent highs, this thing can run fast. Watching it closely!
Who’s in? Smash the like & follow for updates 🔥

LTC at the Edge? — Hold $100 and We May Have a Ride to $300+ 📊 LTC Price Update | Major Level on Watch
Litecoin (LTCUSDT) is currently holding the $100 support — a crucial psychological and technical level.
If buyers manage to hold above $100, momentum could build toward the next key resistance zone near $135.
🔹 Key Levels:
Support: $100 (must hold for bullish structure)
Resistance: $135 – breakout here confirms mid-term reversal
Upside Target: $300+ possible if $135 breaks with volume
🔸 Market Outlook:
Price consolidation above $100 is showing early signs of accumulation.
A strong breakout above $135 could mark the beginning of a long-term uptrend, targeting the $250–$300 region.
Failure to defend $100, however, would risk revisiting lower demand zones around $85.
🧭 Strategy:
Watch for daily closes above $135 for trend confirmation. Until then, $100 remains the line in the sand for bulls.

LTC/USDT — The Calm Before The Storm: A Major Move Is Brewing!Litecoin is currently trading inside an extended Symmetrical Triangle formation that has been developing since mid-2021.
Each price swing is tightening between two major trendlines, compressing volatility like a coiled spring ready to snap.
📊 At around $104, LTC is sitting right at a decision point, where the battle between bulls and bears is approaching its climax.
The next confirmed breakout — either up or down — will likely define Litecoin’s macro trend for the months ahead.
---
Pattern & Technical Structure
Main Pattern: Symmetrical Triangle (neutral → directional bias confirmed only after breakout)
Upper Resistance Zone: $110–$120 (descending trendline)
Horizontal Resistance: $134 (key pivot level), followed by $281–$295 (major historical resistance)
Support Zone: rising trendline around $85–$90, with strong historical supports at $69 and $40
Volatility: extremely compressed, suggesting an imminent expansion phase
---
Bullish Scenario
If LTC manages to break and close weekly above $120–$134 with solid volume, a macro trend reversal could ignite.
🎯 Initial Target: $134 (confirmation zone)
🎯 Mid-term Target: $200
🎯 Major Target: $281–$295
🛡️ Invalidation: weekly close back below the upper trendline
Such breakouts after long compressions often lead to explosive upside moves, as months of built-up energy get unleashed in one direction.
---
Bearish Scenario
If sellers take control and LTC breaks below $85, a significant downside move could unfold.
⚠️ First Target: $69
⚠️ Next Target: $46–$40 (major liquidity zone)
🛡️ Invalidation: price reclaims the broken support on a weekly close
A clean breakdown would likely trigger a capitulation flush, but could also offer long-term accumulation opportunities near historical lows.
---
Market Outlook & Conclusion
Litecoin is now sitting at the tip of a multi-year triangle — a structure that rarely stays quiet for long.
When such formations appear on the weekly timeframe, the next expansion phase usually brings a major directional shift.
Both sides are on alert — one decisive candle could rewrite the chart entirely.
📈 Key takeaway: Stay patient, stay prepared.
The volatility storm is loading — and it’s only a matter of time before it erupts.
---
#LTCUSDT #Litecoin #CryptoAnalysis #BreakoutAlert #SymmetricalTriangle #TechnicalAnalysis #CryptoTA #MarketStructure #SwingTrading

LTCUSD Next Target for Bulls RevealedLTCUSD 4H Chart
The correction has already ended at 100.25 . We expect a small retracement before the trend continues. Upon closer examination, this correction appears to be subwave C of wave (4). For now, watch the 119 level for a potential bullish breakout.
LTCUSD Targets: 122 , 127 , and 132 .
Wave (4) has already reached the 0.382 Fibonacci retracement level, which may act as support near the upper boundary and serve as a possible reversal point.
Stay tuned!
@Money_Dictators
Thank you :)

#LTC/USDT analysis.Give me some energy !!!#LTC
The price is moving within a descending channel on the 1-hour frame, adhering well to it, and is heading for a strong breakout and retest.
We have a bearish trend on the RSI indicator that is about to be broken and retested, supporting the upside.
There is a major support area (marked in green) at 107.50, which represents a strong basis for the upside.
For inquiries, please leave a comment.
We are in a consolidation trend above the 100 moving average.
Entry price: 111.15
First target: 112.80
Second target: 114.70
Third target: 117
Don't forget a simple matter: capital management.
When you reach the first target, save some money and then change your stop-loss order to an entry order.
For inquiries, please leave a comment.
Thank you.

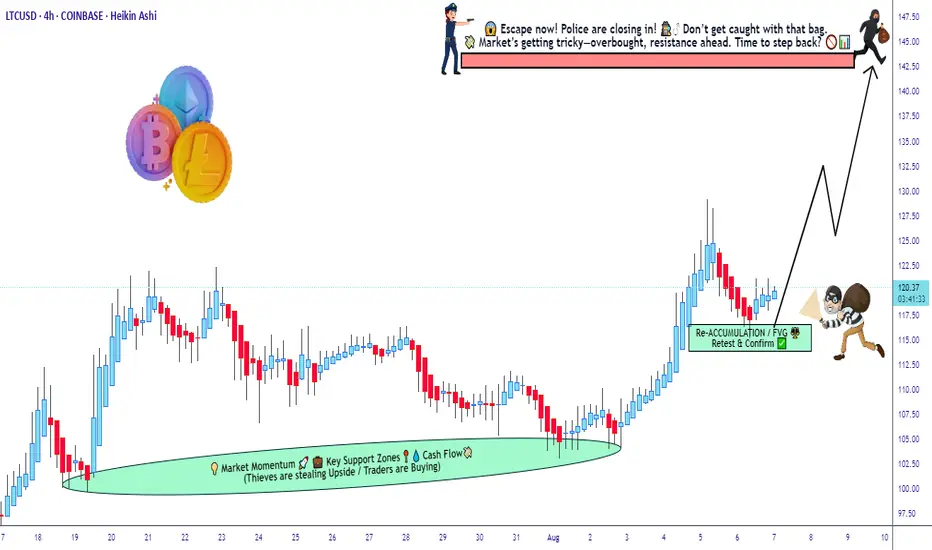
"Is LTC/USD the next target of a stealth bull raid?”🎯 LTC/USD HEIST ALERT: BULLISH LAYER HEIST PLAN! 💎🚁
PLUNDER PLAN: BULLISH
Thief entering the LTC/USD market with calculated stealth—multi-layered buy-limit entries, master-level layering strategy 🌪️💰
👾 ENTRY STRATEGY:
Stack multiple limit orders at staggered price levels (layering like a patient 🐍 thief)
Enter at any price, staying ready to pounce at key zones, using alerts for breakouts
🛑 STOP LOSS:
Fixed SL at 110.00 USD
Keep tight risk control—stop’s your escape hatch!
🏹 TARGET:
Primary profit target: 143.00 USD
Use trailing stop-loss to lock gains early if momentum fades
🧠 THIEF TRADER TACTICS:
Limit orders only—no chasing
Enter the trend, don’t fight it—avoid shorts during bullish bias
For scalpers: swift layered fills
For swing traders: build position patiently
💎 RISK MANAGEMENT:
Every limit order has a stop-loss
Total risk should be controlled—ideal risk‑reward if full strategy plays out
🔍 MARKET CONTEXT:
Bullish outlook supported by confluence of:
macro themes, sentiment swings, on‑chain flows, and intermarket setups
Layered entries optimize risk while capturing upside
⚠️ Avoid trading during high‑volatility news events
Trailing stops = lock profit & evade chaos
📣 CALL TO ACTION:
💥 If you feel the energy, smash that Like and Follow, comment your plan, and join the crew. Let’s rob the market level by level 🔓🎯
Stay sharp, stay sneaky — see you at the target 🔐
— Thief Trader 🐱👤💵🚀
LTCUSDTI think the BINANCE:LTCUSDT price 📈 may pull back to $110.60 before pumping to higher levels 🚀.
Watch for reactions at $116.50 and $128.20 🔍 — key decision zones.
Supports: $116.50 – $110.60 – $104.60 🛡️
Resistance: $128.20 – $140 🏔️
Manage your risk ⚠️.

#LTCUSDT: On The Way To $200, Get Ready For Swing Buy! Hey there!
Evening Everyone,
The price of this crypto is currently in a bullish formation, and it looks like it’s on the rise, potentially reaching $200. The best thing you can do is wait for the price to break out of the downtrend and then keep going up. You could set a target at $150 and then $200, which would be a swing move.
Good luck and trade safely! 😊
Thanks a bunch for your unwavering support! ❤️🚀
If you’d like to lend a hand, here are a few ways you can contribute:
- Like our ideas
- Comment on our ideas
- Share our ideas
Cheers,
Team Setupsfx_

LTC/USDT Weekly – Massive Breakout Loading? 3-Year Triangle
📌 Litecoin is now standing at one of its most crucial technical levels since the 2021 bull run. After 3 years of compression inside a massive symmetrical triangle, price action is nearing a major breakout point. Will LTC finally explode upward, or are bears still in control? Let’s break it down!
🧠 Technical Pattern: Long-Term Symmetrical Triangle
This is a classic pattern that signals a prolonged phase of buyer-seller equilibrium, where lower highs and higher lows converge into a point of tension. Historically, this type of formation often ends in a sharp breakout in either direction.
🔺 Pattern Duration: Since May 2021
🔺 Converging trendlines: Tightening into Q3/Q4 2025
🔺 Historical breakout probability: ~60-75% chance of upward breakout in symmetrical triangles
🟢 Bullish Scenario (Upside Breakout):
If LTC breaks above the upper triangle resistance (~$100 – $115) with strong volume, it could ignite a major rally due to:
✅ The end of a multi-year consolidation
✅ Renewed investor confidence and potential altcoin season
✅ Technical confirmation of breakout from a long-term base
🎯 Upside Targets:
$134.66 – Psychological resistance and minor horizontal supply zone
$230.13 – Major resistance area from 2022 breakdown
$280.87 – Fib extension & key structural level
$325.00 – Pre-blowoff level from 2021
$387.91 – All-Time High (ATH) retest zone
📌 Based on the triangle’s base projection, a technical target of ~$280+ is plausible if breakout confirms.
🔴 Bearish Scenario (Downside Breakdown):
If LTC fails to hold the rising support (~$85), it may trigger a strong bearish reaction, especially if Bitcoin also loses key support levels.
📉 Downside Levels to Watch:
$65.00 – Key horizontal support
$49.00 – $39.00 – Historical demand zone from early 2020
$23.90 – Pandemic-era low (extreme bearish target)
📌 Breakdown confirmation requires a weekly close below support with high volume, ideally accompanied by macro risk-off sentiment.
🧩 Key Confirmations to Watch For:
1. Volume Surge on Breakout – Is the move supported by strong volume?
2. Successful Retest – Does price retest the breakout level as support?
3. Momentum Indicators – Weekly RSI > 50 and MACD bullish crossover can strengthen conviction.
📊 Fundamental & Sentiment Context:
Litecoin halving occurred in August 2023. Historically, price rallies follow 6–12 months after.
Often dubbed the “digital silver”, LTC remains relevant during altcoin cycles.
Whale accumulation has increased slowly since late 2024—possibly indicating long-term positioning.
✅ Conclusion & Strategy:
Litecoin is like a technical time bomb waiting to explode. Traders and investors should prepare for both breakout and breakdown scenarios. Patience and confirmation are key. Don’t chase—let the chart speak first.
🎯 Plan the trade, trade the plan. Don’t FOMO into noise—wait for structure!
#LTCUSDT #LitecoinBreakout #CryptoTechnicalAnalysis #SymmetricalTriangle #BullishSetup #AltcoinSeason #Litecoin2025 #CryptoChart #TrianglePattern #LitecoinRally

LTCUSDT 1D AnalysisLTC ~ 1D Analysis
#LTC Buy after successfully breaking this resistance line with a short term target of at least 10%+ from here.

#LTC/USDT#LTC
The price is moving within a descending channel on the 1-hour frame, adhering well to it, and is heading for a strong breakout and retest.
We are seeing a bounce from the lower boundary of the descending channel, which is support at 92.48.
We have a downtrend on the RSI indicator that is about to be broken and retested, supporting the upward trend.
We are looking for stability above the 100 moving average.
Entry price: 97.44
First target: 100.24
Second target: 102.45
Third target: 105.26

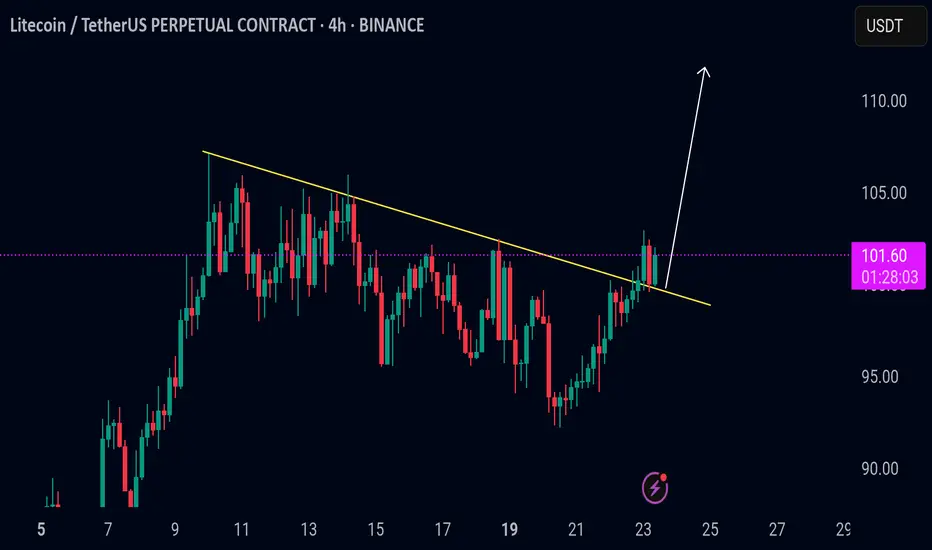
LTC/USDT Trendline Breakout AlertLTC/USDT Trendline Breakout Alert
LTC has broken above a key descending trendline, signaling a potential shift in momentum from bearish to bullish. This kind of breakout often marks the end of a consolidation phase and the beginning of a new upward trend.
If the price holds above the trendline and gains volume support, further upside can be expected. However, if LTC drops back below the trendline, it may signal a false breakout, and caution is advised.
**Key levels to watch:**
* Retest of the broken trendline as support
* Immediate resistance overhead
* Volume confirmation for trend strength
LTC is showing signs of strength — keep it on your radar for a possible bullish continuation.
LTCUSDT 1D Analysis LTC ~ 1D Analysis
#LTC Buy after successfully breaking this resistance line or buy when retesting this support block with a short term target of at least 10%+.

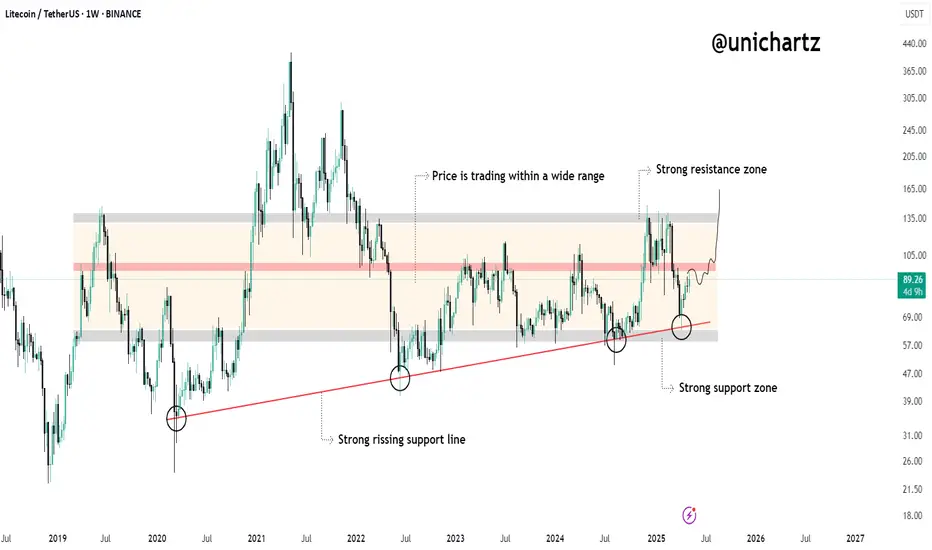
Is $LTC Lining Up for a Breakout Move?LTCUSDT is moving inside a wide range that's been respected for over 3 years — with price bouncing between a strong support zone ($50–$60) and a strong resistance zone ($130–$145).
Key Highlights:
Strong Support Zone:
Price recently bounced off a long-term horizontal support area near $60 — the same zone that sparked multiple rallies in the past.
Rising Trendline:
A clean, rising diagonal support has held since 2020 — each retest has led to upward momentum. The latest bounce confirms this structure is still valid.
Current Structure:
Price is climbing from the base of the range. If it breaks through the mid-zone and holds, we could see an attempt toward the upper resistance around $130+.
DYOR, NFA
LTCUSDT 1D AnalysisLTC ~ 1D Analysis
#LTC Buy after successfully penetrating this resistant line with a short -term target of at least 10%+ from here.

LTCUSDT 1WLTC ~ 1W Analysis
#LTC Buy gradually when re -testing this support with a short -term target of at least 15%+.

LTCUSDT Breakout Loading….BINANCE:LTCUSDT has been consolidating for several days, repeatedly testing resistance levels. This pattern suggests a potential breakout is on the horizon. With ETH already gaining momentum, Litecoin could follow suit. Once the market starts moving, plenty of trading opportunities may arise.
Trade Smart: Always use a stop loss and manage your risk effectively.
BINANCE:LTCUSDT Currently trading at $91.5
Buy level: Above $91
Stop loss: Below $83
Target : $130
Max Leverage 3x
Always keep Stop loss
Follow Our Tradingview Account for More Technical Analysis Updates, | Like, Share and Comment Your thoughts

LTC/USD "Litecoin vs US Dollar" Crypto Market Heist Plan🌟Hi! Hola! Ola! Bonjour! Hallo!🌟
Dear Money Makers & Robbers, 🤑💰🐱👤🐱🏍
Based on 🔥Thief Trading style technical and fundamental analysis🔥, here is our master plan to heist the LTC/USD "Litecoin vs US Dollar" Crypto market. Please adhere to the strategy I've outlined in the chart, which emphasizes long entry. Our aim is the high-risk Red Zone. Risky level, overbought market, consolidation, trend reversal, trap at the level where traders and bearish robbers are stronger. 🏆💸Book Profits Be wealthy and safe trade.💪🏆🎉
Entry 📈 : "The vault is wide open! Swipe the Bullish loot at any price - the heist is on!
however I advise placing Buy limit orders within a 15 or 30 minute timeframe. Entry from the most recent or closest low or high level should be in retest.
Stop Loss 🛑: Thief SL placed at 110.00 (swing Trade Basis) Using the 4H period, the recent / nearest low level.
SL is based on your risk of the trade, lot size and how many multiple orders you have to take.
Target 🎯: 165.00 (or) Escape Before the Target
Scalpers, take note 👀 : only scalp on the Long side. If you have a lot of money, you can go straight away; if not, you can join swing traders and carry out the robbery plan. Use trailing SL to safeguard your money 💰.
📰🗞️Fundamental, Macro, COT, Sentimental Outlook:
LTC/USD "Litecoin vs US Dollar" Crypto Market market is currently experiencing a bullish trend,., driven by several key factors.
🔱Fundamental Analysis
Litecoin Adoption: Growing adoption of Litecoin as a payment method, with increasing transaction volumes.
Halving Event: The upcoming halving event in August 2025 is expected to reduce Litecoin's block reward, potentially increasing demand and prices.
Competition from Other Cryptocurrencies: Increasing competition from other cryptocurrencies, such as Bitcoin and Ethereum, may impact Litecoin's market share.
🔱Macro Economics
Global Economic Trends: The ongoing global economic recovery is expected to drive up demand for cryptocurrencies, including Litecoin.
Inflation Rate: Global inflation is expected to rise to 3.8% in 2025, potentially increasing demand for cryptocurrencies as a hedge against inflation.
Interest Rates: Central banks are expected to maintain low interest rates in 2025, supporting cryptocurrency markets.
🔱COT Data
Net Long Positions: Institutional traders have increased their net long positions in Litecoin to 60%.
COT Ratio: The COT ratio has risen to 2.5, indicating a bullish trend.
Open Interest: Open interest in Litecoin futures has increased by 20% over the past month, indicating growing investor interest.
🔱Sentimental Outlook
Institutional Sentiment: 65% bullish, 35% bearish.
Retail Sentiment: 60% bullish, 40% bearish.
Market Mood: The overall market mood is bullish, with a sentiment score of +40.
🔱Technical Analysis
Moving Averages: 50-period SMA: 120.00, 200-period SMA: 110.00.
Relative Strength Index (RSI): 4-hour chart: 62.21, daily chart: 58.14.
Bollinger Bands: 4-hour chart: 130.00 (upper band), 120.00 (lower band).
🔱Next Move Prediction
Bullish Move: Potential upside to 150.00-170.00.
Key Support Levels: 120.00, 110.00.
Key Resistance Levels: 150.00, 170.00.
🔱Market Overview
Current Price: 130.00
Daily Change: 2.5%
Weekly Change: 10.2%
Overall Outlook
🔱The overall outlook for LTC/USD is bullish, driven by a combination of fundamental, technical, and sentimental factors. The expected increase in Litecoin adoption, upcoming halving event, and bullish market sentiment are all supporting the bullish trend. However, investors should remain cautious of potential downside risks, including changes in global economic trends and unexpected regulatory developments.
⚠️Trading Alert : News Releases and Position Management 📰 🗞️ 🚫🚏
As a reminder, news releases can have a significant impact on market prices and volatility. To minimize potential losses and protect your running positions,
we recommend the following:
Avoid taking new trades during news releases
Use trailing stop-loss orders to protect your running positions and lock in profits
📌Please note that this is a general analysis and not personalized investment advice. It's essential to consider your own risk tolerance and market analysis before making any investment decisions.
📌Keep in mind that these factors can change rapidly, and it's essential to stay up-to-date with market developments and adjust your analysis accordingly.
💖Supporting our robbery plan will enable us to effortlessly make and steal money 💰💵 Tell your friends, Colleagues and family to follow, like, and share. Boost the strength of our robbery team. Every day in this market make money with ease by using the Thief Trading Style.🏆💪🤝❤️🎉🚀
I'll see you soon with another heist plan, so stay tuned 🤑🐱👤🤗🤩

LTCUSDT 1WLTC ~ 1W Analysis
#LTC This support block continues to be maintained so far.
Buy gradually from here with a minimum target of 20%+.
