And Yes the whales are buyingThis market volatility over the last few weeks might be an attempt to shake out the weak holders.
If price moves out of the smaller micro range (as illustrated) and pushes back in and breaks structure bullish, this would be a buy signal for me.
**The trade only happens if these conditions are met.
Keep your eye on the market and respond when it shows.
Happy Trading.
LTCUSDTPERP

#LTC/USDT analysis.Give me some energy !!!#LTC
The price is moving within a descending channel on the hourly timeframe. It has reached the lower boundary and is heading towards a breakout, with a retest of the upper boundary expected.
The Relative Strength Index (RSI) is showing a downward trend, approaching the lower boundary, and an upward bounce is anticipated.
There is a key support zone in green at 75.00, and the price has bounced from this level several times and is expected to bounce again.
The indicator is showing a trend towards consolidation above the 100-period moving average, which we are approaching, supporting the upward move.
Entry Price: 78.30
First Target: 79.40
Second Target: 81.45
Third Target: 83.86
Stop Loss: Below the green support zone.
Remember this simple thing: Money management.
For any questions, please leave a comment.
Thank you.

LTCUSDT - Symmetrical Triangle: Breakout or Breakdown?Litecoin (LTC/USDT) on the Weekly (1W) timeframe is currently in a long-term consolidation phase following a major decline from its previous cycle high. Price action is becoming increasingly compressed and is now approaching the apex of a large structure, signaling an upcoming major directional move.
The current price is trading around $82–85, positioned near the middle of the triangle, which represents a critical decision zone for the market.
---
Pattern Explanation
The chart is forming a large Symmetrical Triangle, characterized by:
Lower highs → descending resistance (upper yellow trendline)
Higher lows → ascending support (lower yellow trendline)
Pattern structure developing from 2022 through early 2026
Gradually declining volume → a typical sign of market compression before a breakout
A Symmetrical Triangle is a neutral continuation pattern, meaning the next major move will be determined by a confirmed breakout or breakdown.
---
Key Levels
Major Resistance Levels:
$95 – $100 → minor resistance / mid-range area
$120 → strong historical resistance
$134 → major supply zone
$281 → long-term major resistance / macro target
Major Support Levels:
$82 – $80 → current support zone
$63 → structural support
$40 → swing low / extreme downside support
---
Bullish Scenario
The bullish scenario will be confirmed if:
1. Price breaks above the descending trendline
2. A weekly close above resistance, supported by increasing volume
Bullish Targets (Step-by-Step):
$95 – $100 (initial target)
$120 – $134 (major distribution zone)
$180 – $280 (measured move of the triangle if bullish continuation occurs)
A confirmed breakout could mark the start of a new medium- to long-term uptrend.
---
Bearish Scenario
The bearish scenario becomes valid if:
1. Price fails to break resistance
2. A weekly close below the ascending support trendline
Bearish Targets (Step-by-Step):
$63 → key support
$40 → historical lower boundary
A breakdown from this structure would suggest a continuation of bearish or prolonged sideways conditions.
---
Conclusion
LTC is currently trading within a major decision zone on the weekly timeframe.
Traders and investors are advised to wait for clear confirmation, rather than anticipating direction inside the triangle.
➡ Breakout = potential start of a new bullish trend
➡ Breakdown = risk of further downside or extended consolidation
Patience is crucial during high-compression market phases like this.
---
#LTCUSDT #Litecoin #Altcoin #CryptoMarket
#CryptoAnalysis #AltcoinAnalysis #WeeklyChart
#SymmetricalTriangle #TrianglePattern #TriangleBreakout

LTC/USDT — Falling Wedge Formation Signals Potential ReversalOn the 8-hour timeframe, Litecoin (LTC) remains in an overall downtrend. However, the price structure is not moving in parallel lines, indicating that this is not a descending channel. The upper resistance trendline is steeper than the lower support trendline, signaling weakening bearish momentum.
Price is currently trading near the final phase of the pattern, approaching the apex, where a strong directional move (breakout or breakdown) is likely to occur.
---
Pattern & Price Structure
Pattern Identified: Falling Wedge (Bullish Reversal Pattern)
Key characteristics visible on the chart:
Continuous lower highs, forming a sharply declining resistance
Lower lows, but with decreasing downside momentum
Price compression, indicating reduced selling pressure
Non-parallel trendlines, distinguishing it from a descending channel
Technically, a falling wedge forming within a downtrend often precedes a bullish trend reversal, pending confirmation.
---
Key Levels
Support Zones:
80.0 USDT (current reaction zone)
76.0 – 72.6 USDT (major support & pattern invalidation level)
Resistance Zones:
85.8 USDT (near-term resistance)
93.5 – 96.5 USDT (key structural resistance)
104 – 110 USDT (major supply zone)
---
Bullish Scenario
The bullish scenario becomes valid if:
1. Price breaks above the falling wedge resistance
2. An 8H candle closes above 85.8 USDT
3. The market prints a first higher high as confirmation
Bullish Targets:
93.5 – 96.5 USDT
104 USDT
110 USDT (if momentum strengthens)
A confirmed breakout would suggest a shift from bearish control to recovery phase.
---
Bearish Scenario (Pattern Invalidation)
The bearish scenario occurs if:
Price fails to break out from the wedge
76 USDT support is broken with strong volume
Bearish Targets:
72.6 USDT
Extension toward the 70 USDT area if selling pressure accelerates
Such a move would invalidate the falling wedge and confirm bearish continuation.
---
Conclusion
Price action aligns more accurately with a falling wedge
The pattern suggests potential bullish reversal, but:
Confirmation is mandatory
Until a breakout occurs, the dominant trend remains bearish
The optimal approach is to wait for confirmation rather than anticipate.
---
#LTC #Litecoin #LTCUSDT #FallingWedge #BullishReversal #CryptoAnalysis #TechnicalAnalysis #Altcoin #CryptoTrading

Litecoin - Long-Term Bearish Structure, New Cycle Low ExpectedDuring previous bull runs (2017 and 2021) , Litecoin consistently made new all-time highs , breaking above prior peaks. However, an important historical pattern stands out: each bear market formed higher lows , suggesting long-term range compression.
At the current stage, this structure appears to be changing. Price remains in a prolonged consolidation phase, and a bear flag has formed on the monthly timeframe, which is a classic bearish continuation pattern following a strong downside impulse.
Based on the overall market cycle structure and historical behavior, I expect a breakdown below previous bear market lows, with a new cycle bottom forming in the $24–20 range.
Key factors:
Clear bear flag on the 1M timeframe
Lack of a sustained uptrend since the 2021 peak
Weak bullish momentum and distribution structure
Market cycle dynamics
Cycle outlook:
2026 is expected to be a bearish year, potentially marking the final phase of this downtrend and the establishment of a macro bottom.
Invalidation:
A sustained breakout and hold above the upper boundary of the monthly bear flag would invalidate this bearish scenario.
This idea is designed for long-term traders and investors who analyze the market through cycle behavior and macro structure, rather than short-term price fluctuations.

LTC/USDT — The Calm Before The Storm: A Major Move Is Brewing!Litecoin is currently trading inside an extended Symmetrical Triangle formation that has been developing since mid-2021.
Each price swing is tightening between two major trendlines, compressing volatility like a coiled spring ready to snap.
📊 At around $104, LTC is sitting right at a decision point, where the battle between bulls and bears is approaching its climax.
The next confirmed breakout — either up or down — will likely define Litecoin’s macro trend for the months ahead.
---
Pattern & Technical Structure
Main Pattern: Symmetrical Triangle (neutral → directional bias confirmed only after breakout)
Upper Resistance Zone: $110–$120 (descending trendline)
Horizontal Resistance: $134 (key pivot level), followed by $281–$295 (major historical resistance)
Support Zone: rising trendline around $85–$90, with strong historical supports at $69 and $40
Volatility: extremely compressed, suggesting an imminent expansion phase
---
Bullish Scenario
If LTC manages to break and close weekly above $120–$134 with solid volume, a macro trend reversal could ignite.
🎯 Initial Target: $134 (confirmation zone)
🎯 Mid-term Target: $200
🎯 Major Target: $281–$295
🛡️ Invalidation: weekly close back below the upper trendline
Such breakouts after long compressions often lead to explosive upside moves, as months of built-up energy get unleashed in one direction.
---
Bearish Scenario
If sellers take control and LTC breaks below $85, a significant downside move could unfold.
⚠️ First Target: $69
⚠️ Next Target: $46–$40 (major liquidity zone)
🛡️ Invalidation: price reclaims the broken support on a weekly close
A clean breakdown would likely trigger a capitulation flush, but could also offer long-term accumulation opportunities near historical lows.
---
Market Outlook & Conclusion
Litecoin is now sitting at the tip of a multi-year triangle — a structure that rarely stays quiet for long.
When such formations appear on the weekly timeframe, the next expansion phase usually brings a major directional shift.
Both sides are on alert — one decisive candle could rewrite the chart entirely.
📈 Key takeaway: Stay patient, stay prepared.
The volatility storm is loading — and it’s only a matter of time before it erupts.
---
#LTCUSDT #Litecoin #CryptoAnalysis #BreakoutAlert #SymmetricalTriangle #TechnicalAnalysis #CryptoTA #MarketStructure #SwingTrading

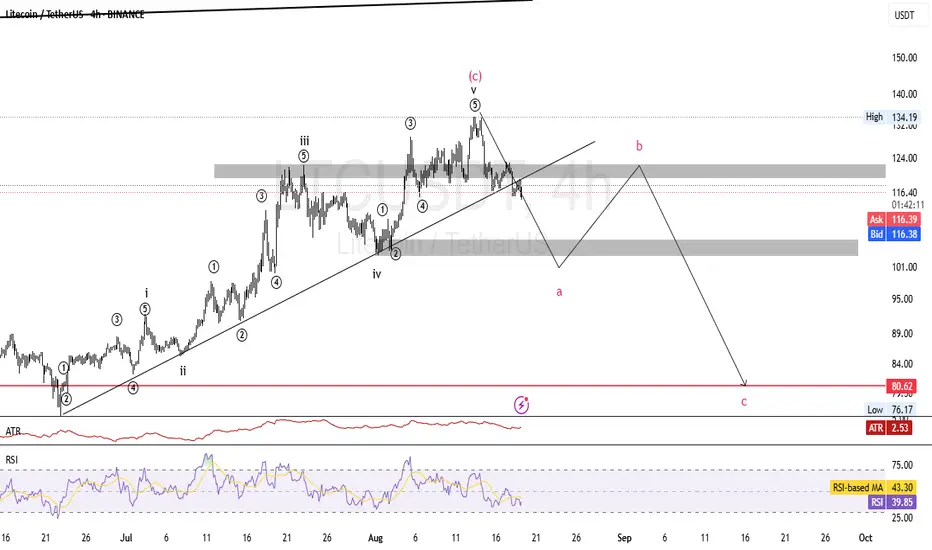
LTCUSDT: Elliot waves AnalysisHello friends, if we examine the Litecoin chart based on Elliott waves, we can see that its five waves have completed and also its medium-term trend line has been broken, so we can expect a deep correction like this. This can only be an analysis and other scenarios should be examined.
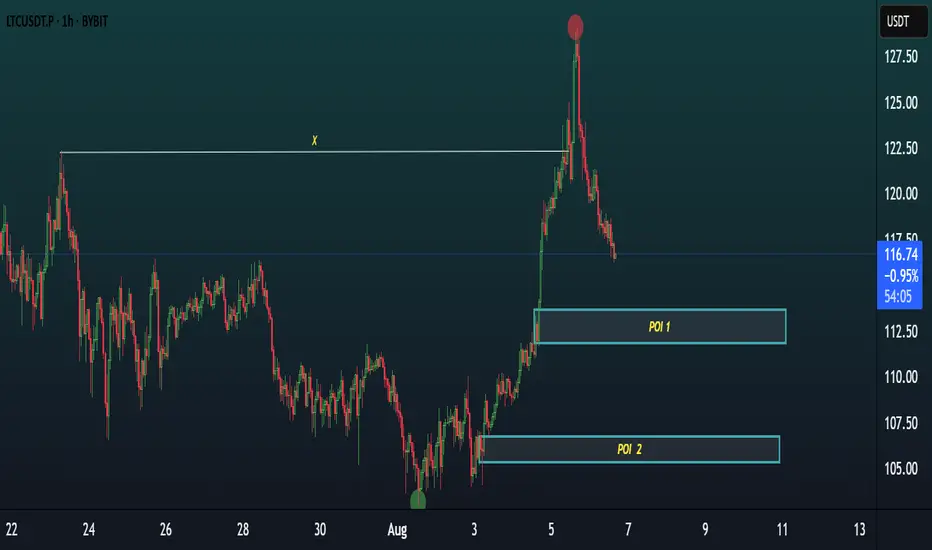
LTC/USDT 1H CHART BREAKDOWN.LTC/USDT 1H Chart Breakdown 🔍
Price swept major liquidity at the top and is now retracing.
We have 2 key POIs (Points of Interest) below:
📍 POI 1: Aggressive entry zone
📍 POI 2: More discounted price for safer long entries
⚡ Watch for bullish confirmation inside these zones for potential reversal to the upside. Smart money may accumulate here.
Scalp & intraday traders — stay sharp!
LTC/USDT Weekly – Massive Breakout Loading? 3-Year Triangle
📌 Litecoin is now standing at one of its most crucial technical levels since the 2021 bull run. After 3 years of compression inside a massive symmetrical triangle, price action is nearing a major breakout point. Will LTC finally explode upward, or are bears still in control? Let’s break it down!
🧠 Technical Pattern: Long-Term Symmetrical Triangle
This is a classic pattern that signals a prolonged phase of buyer-seller equilibrium, where lower highs and higher lows converge into a point of tension. Historically, this type of formation often ends in a sharp breakout in either direction.
🔺 Pattern Duration: Since May 2021
🔺 Converging trendlines: Tightening into Q3/Q4 2025
🔺 Historical breakout probability: ~60-75% chance of upward breakout in symmetrical triangles
🟢 Bullish Scenario (Upside Breakout):
If LTC breaks above the upper triangle resistance (~$100 – $115) with strong volume, it could ignite a major rally due to:
✅ The end of a multi-year consolidation
✅ Renewed investor confidence and potential altcoin season
✅ Technical confirmation of breakout from a long-term base
🎯 Upside Targets:
$134.66 – Psychological resistance and minor horizontal supply zone
$230.13 – Major resistance area from 2022 breakdown
$280.87 – Fib extension & key structural level
$325.00 – Pre-blowoff level from 2021
$387.91 – All-Time High (ATH) retest zone
📌 Based on the triangle’s base projection, a technical target of ~$280+ is plausible if breakout confirms.
🔴 Bearish Scenario (Downside Breakdown):
If LTC fails to hold the rising support (~$85), it may trigger a strong bearish reaction, especially if Bitcoin also loses key support levels.
📉 Downside Levels to Watch:
$65.00 – Key horizontal support
$49.00 – $39.00 – Historical demand zone from early 2020
$23.90 – Pandemic-era low (extreme bearish target)
📌 Breakdown confirmation requires a weekly close below support with high volume, ideally accompanied by macro risk-off sentiment.
🧩 Key Confirmations to Watch For:
1. Volume Surge on Breakout – Is the move supported by strong volume?
2. Successful Retest – Does price retest the breakout level as support?
3. Momentum Indicators – Weekly RSI > 50 and MACD bullish crossover can strengthen conviction.
📊 Fundamental & Sentiment Context:
Litecoin halving occurred in August 2023. Historically, price rallies follow 6–12 months after.
Often dubbed the “digital silver”, LTC remains relevant during altcoin cycles.
Whale accumulation has increased slowly since late 2024—possibly indicating long-term positioning.
✅ Conclusion & Strategy:
Litecoin is like a technical time bomb waiting to explode. Traders and investors should prepare for both breakout and breakdown scenarios. Patience and confirmation are key. Don’t chase—let the chart speak first.
🎯 Plan the trade, trade the plan. Don’t FOMO into noise—wait for structure!
#LTCUSDT #LitecoinBreakout #CryptoTechnicalAnalysis #SymmetricalTriangle #BullishSetup #AltcoinSeason #Litecoin2025 #CryptoChart #TrianglePattern #LitecoinRally

#LTC/USDT#LTC
The price is moving within a descending channel on the 1-hour frame, adhering well to it, and is heading for a strong breakout and retest.
We are seeing a bounce from the lower boundary of the descending channel, which is support at 92.48.
We have a downtrend on the RSI indicator that is about to be broken and retested, supporting the upward trend.
We are looking for stability above the 100 moving average.
Entry price: 97.44
First target: 100.24
Second target: 102.45
Third target: 105.26

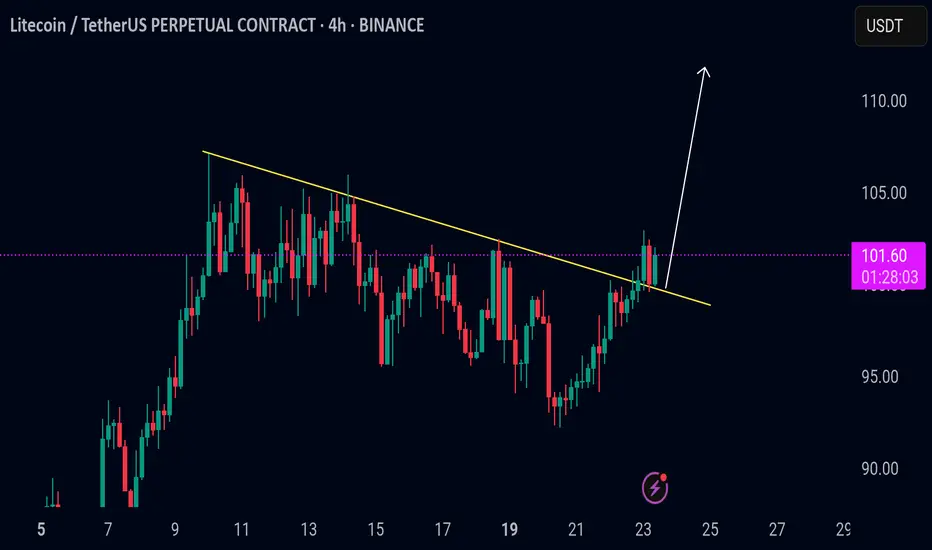
LTC/USDT Trendline Breakout AlertLTC/USDT Trendline Breakout Alert
LTC has broken above a key descending trendline, signaling a potential shift in momentum from bearish to bullish. This kind of breakout often marks the end of a consolidation phase and the beginning of a new upward trend.
If the price holds above the trendline and gains volume support, further upside can be expected. However, if LTC drops back below the trendline, it may signal a false breakout, and caution is advised.
**Key levels to watch:**
* Retest of the broken trendline as support
* Immediate resistance overhead
* Volume confirmation for trend strength
LTC is showing signs of strength — keep it on your radar for a possible bullish continuation.
LTCUSDT 1D Analysis LTC ~ 1D Analysis
#LTC Buy after successfully breaking this resistance line or buy when retesting this support block with a short term target of at least 10%+.

LTCUSDT 1D AnalysisLTC ~ 1D Analysis
#LTC Buy after successfully penetrating this resistant line with a short -term target of at least 10%+ from here.

LTCUSDT 1WLTC ~ 1W Analysis
#LTC Buy gradually when re -testing this support with a short -term target of at least 15%+.

LTCUSDT Breakout Loading….BINANCE:LTCUSDT has been consolidating for several days, repeatedly testing resistance levels. This pattern suggests a potential breakout is on the horizon. With ETH already gaining momentum, Litecoin could follow suit. Once the market starts moving, plenty of trading opportunities may arise.
Trade Smart: Always use a stop loss and manage your risk effectively.
BINANCE:LTCUSDT Currently trading at $91.5
Buy level: Above $91
Stop loss: Below $83
Target : $130
Max Leverage 3x
Always keep Stop loss
Follow Our Tradingview Account for More Technical Analysis Updates, | Like, Share and Comment Your thoughts

LTCUSDT LONG 1H (Update/Results)From the main review, in which I indicated personal expectations, new market variables arrived both in terms of goals and entry.
On the 1D chart, the price interacted with the key area of interest (poi), removed the liq of the nearest min. and hit the order block 15m TF
New goal on CHoCH target, has been achieved.
stop moved to profit!

LTCUSDT 1H LONGOn higher timeframes, the asset forms many liquidity pools and has aggressive market purchases, thereby protecting the break levels of the structure!
Previously, the asset went under the POI range , but returned on good volume with full-bodied candles.
I am considering a long position at the specified price on a trading chart with targets:
$123.69
$131.20
$141.22
Risk management - 1% on stop order

LTCUSDT on the Rise: Major Breakout Signal!!MARKETSCOM:LITECOIN ( BINANCE:LTCUSDT ) has broken out of a major resistance level with strong volume, indicating renewed bullish momentum. This breakout marks the start of a potential uptrend, as BINANCE:LTCUSDT shows strength above the critical zone.
If the price holds above this resistance level, we could witness further upside movement, potentially challenging and even surpassing its previous all-time high. With increasing market interest, LTC might just be gearing up for a remarkable rally.
BINANCE:LTCUSDT Currently trading at $130
Buy level: Above $115
Stop loss: Below $85
Target : $410
Max Leverage 3x
Always keep Stop loss
Follow Our Tradingview Account for More Technical Analysis Updates, | Like, Share and Comment Your thoughts

LTCUSDT 1WLTC Update ~ 1W
#LTC Retesting this support Block,. buy gradually inside this support block,. Minimum target 20%+ from here.

LTCUSDT 5DLTC ~ 5D
#LTC So far it still maintains this support Block. If you still have Conviction on this coin,. Buy gradually within this support block,. with a minimum target of 30%++

#LTC has huge upside potential 📊#LTC has huge upside potential 💥
🧠From a weekly perspective, there is a large double bottom structure, so it is a bullish trend, and its ideal target area is 189-235. It is currently consolidating near the stage resistance area, and with further breakthroughs, we are expected to continue to move higher from here.
➡️Originally, I wanted to buy near the neckline support area, but there was no such pullback opportunity. I entered after finding a buy signal yesterday. I hope the development will be as expected☕️🙏
Let's see👀
🤜If you like my analysis, please like💖 and share💬 BITGET:LTCUSDT.P

LTC Breaks 2,200-Day Triangle – 250% Rally Ahead?BINANCE:LTCUSDT Technical analysis update
LTC price has broken out of a 2,200-day triangle pattern on the weekly chart with high volume. Additionally, the price has surpassed a 2-year resistance level that it tested multiple times before finally breaking through. This breakout, accompanied by strong volume, suggests a potential bullish move of 100-250% in the coming days.

LTCUSDT Breaks Resistance with Volume Surge: Is $100 Next?LTCUSDT has decisively broken through resistance with impressive trading volume, signaling a potential surge in the coming days. With momentum building, can LTC surpass its previous highs? The outlook is positive, and we're anticipating a move towards $100 soon.
Currently, it's facing minor resistance at the 200 EMA. Keep an eye on market trends and adjust your strategies accordingly, as this coin shows strong potential for upward movement!
LTCUSDT Currently trading at $70
Buy level: Above $69
Stop loss: Below $59
TP1: $76
TP2: $85
TP3: $100
TP4: $112
Max Leverage 3x
Follow Our Tradingview Account for More Technical Analysis Updates, | Like, Share and Comment Your thoughts
