LUNA rising from ashesPlease 1st of all click the boost🚀 button if you want me to post more ideas and follow me to support my work! It's absolutely for free.
LUNA is breaking up out of this triangle📐 and I think there is chance for run to 2.49 and even higher.
See what Terra Classic (LUNC) recently did after triangle breakout:
Check my other stuff in related ideas.
Please boost🚀, comment🗣️, follow me✒️, enjoy📺!
⚠️Disclaimer: I'm not financial advisor. This is not a financial advice. Do your own due dilingence.
LUNAUSD

LUNA TERRA CLASSIC USD CUP & HANDLE BULLISH MOVE TARGET $.00054LUNA has formed a cup and handle after its bounce from the death drop. There has been some serious interest in LUNA CLASSIC these day by big whales. Wallet activity shows a lot of accumulation and some by big wallets. One wallet has been accumulating large amounts and depositing it into a wallet owned by Binance? This is a direct copy and paste from part of the article.
This wallet accumulated around 8.5 billion #LUNC and dumped it all into the 2.6T wallet that I hear belongs to Binance. After dumping that it has since started accumulating again and is currently holding over 700M. Is this Binance loading up??🤔🤔Although it was not confirmed whether the receiving address belongs to Binance, the exchange’s CEO CZ confirmed a few days ago that a burn is necessary. This might point towards better times ahead for LUNC if its supply reduces significantly courtesy of a token burn.LUNC has other things going for it. For example, outflows from its supply held by whales bottomed out at 43.57% on 12 June and increased to 43.78% by press time.
This confirms that whales have been buying LUNC in the last three days, thus the bullish pressure build-up. In fact, the volume also saw a significant increase over the last 24 hours of 15 July.
Now just imagine this for a second. Imagine CZ who is salty about losing billions from Luna crash is actually buying up the excess trillions and then BAAM he makes a post and says I'm going to burn 4 trillion coins in one day. Imagine the hype around that and the respect from the LUNA community he would get if he did something like that. He would also probably make many more billions in profits than he lost if he did that. Then the consistent burn of 1.2% and LUNA could easily see $.10 in the nearer term and single digit dollars over the longer term and then perhaps way down the road when LUNA has redistributed and gone through its boom and bust cycles and the burns have brought supply back down to the hundreds of millions or billions LUNA could see double digits and triple digits. Sure this is all hypothetical but thats how big money is made when you go from a hundred dollar investment to a millionaire. Don't think its possible, go talk to some of the DOGE millionaires and SHIB etc. There is tons of them. Anyways I wish you all the best of luck. LUNA for me is a no brainer. I'm loading up. This is not financial advice this is just my opinion. Thank you

Terra Luna classic bulflag!Hello
After days with upside,vwe are now bull flagging
This will for sure go higher. expect 0.00055-0.0006 area next

Terra Classic LUNC History to Repeat ItselfTerra Classic LUNC is made for those who cannot learn from history and which are doomed to repeat it.
LUNC/USDT short
Entry Range: $0.0003900 - 0.0004200
Take Profit 1: $0.0003100
Take Profit 2: $0.0002730
Take Profit 3: $0.0001920
Stop Loss: $0.0004620

LUNC is on fire!🔥Please 1st of all smash the boost🚀 button to support my work if you like it! It's absolutely for free.
Terra Classic being very generous cash💵 machine these days. To put things in context please see the idea down below first:
So TARGET3 still yet to be hit. Now on lower timeframe (15m) the price is trying to break this local downtrendline resistance. Once broken we could see the run to my last target @ 0.000332, where I will be completely out waiting what's next. I see two possible paths (as shown). The blue/red uptrendline & TARGET2 should act as supports. I don't want to see price dropping below the orange support
Check my other stuff in related ideas.
Please boost🚀, comment🗣️, follow me✒️, enjoy📺!
⚠️Disclaimer: I'm not financial advisor. This is not a financial advice. Do your own due dilingence.

LUNC ( LUNA CLASSIC) GOING FOR MORE Luna classic looks to have a good effect since last 10 days.
until now its still into green cycle.
As long its on green cycle its prefect to hold - but same time mange the risk well in case there will be a pullback.
There is a possibility that the price can increase more with next 30 % or more coming time.

Chance knocks your door 4 times and then breaks itThe song on my mind is heaven's door.
Consolidating above 0.0001311 resistance and knocking the door above is priceless

Luna Classic Low Volatility Break outLow Volatility leading to a strong break out in the first situation
We are now experiencing low volatility on a larger scale
Waiting for break out

LunaUSDT | Trend correction in the upward movementMy opinion is, JUST take buy trade for the next 24 hours.

✅TS ❕ BTCUSD: bounced back✅✅BTCUSD has already bounced back from an important level. A downward movement is possible.✅
🚀 SELL scenario: short to the support level area.🚀
----------------------------------------------------------------------------
Remember, there is no place for luck in trading - only strategy!
Thanks for the likes and comments.


MY MINIMALIST CHART ANALYSIS FOR $TERRA$LUNA
On a 4HR Chart
SHORT POSITION
06.30..22
1025H +8 SINGAPORE
Disclaimer:
The findings of the following analysis are the sole opinions of the publisher of this idea and should not be taken as a piece of investment advice.
My Published Ideas are not 100% Accurate. There are many factors at a given time that can change the forecast.
ALERT:
My Bearish Bias: All white price notes are possible entries depending on future price action.
Based on VITAL SIGNS ( RSI, STOCH, VOL., MA VOL.) Looks healthy and is on a reversal of a trend.
Bitcoin is still bearish at this moment, but on a weekly, it has compressed too much and is about to reverse. Maybe we see a bull trap to further push it down or not. (See linked chart for $BTC)
1. We may see it climb further to 0.0007667 zone a FIB reversal, depending on the closing of the bar on its FIB retracement.
2. Trading ranges may develop between 0.00007478 - 0.00016300 before pushing upward, beyond our maximized target in the next few months.
3. Probable back to 0.00004226 trading ranges will take effect as smart money will try to wash out and rinse all the long positions after a bull trap on its way down.
4. Bitcoin is still bearish at this moment, but on a weekly, it has compressed too much and is about to reverse. Maybe we see a bull trap to further push it down or not. (See linked chart for $BTC)
Hoping that this BENTO BOX CHART ANALYSIS will efficiently help you with your DYOR as we Enter a NEW SWING CYCLE for LONG positions, either short, mid, or long term.
INSTRUCTIONS:
HOW TO USE THIS MINIMALIST CHART a.k.a (Bento Box)
"Follow the white rabbit!"
Just Follow the TOPS and BOTTOMS of the BOXES as a GUIDE to where the MARKET will take you.
TARGET ZONE IDENTIFICATION:
The LARGE BOXES (Tops and Bottoms) are MAJOR turning points that will occur sometime in the future. While the SMALL BOXES (Tops and Bottoms) are MINOR turning points.
These can be entries to a BUY/ SELL POSITION, EXIT/PARTIAL EXIT/TOP-UP AREAS, as well as Support and resistance levels
Also includes MAXIMUM TARGET EXIT AREA OF VALUE - CONSERVATIVE (If price action conditions are right at that given moment.)
If it cannot break a TOP or BOTTOM of a BOX, It signifies a reversal.
NOTE:
1. That PRICE TARGETS for ENTRY and EXITS are DYNAMIC and can CHANGE from time to time.
2. Created on a MONTHLY, WEEKLY & DAILY Analysis of a MARKET'S CHARACTER.
3. My BENTO BOXES are designed for SWING TRADES at the LOWEST or START of a SWING CYCLE.
4. At times I will include a WAY BEYOND PARABOLIC PRICE TARGET, depending on The Character of the Market (CRYPTOS ONLY).
5. DYOR for your Fundamentals, Volume, Chart Patterns, Candlestick Math, FIB COILS ( ABC ), Price Action, FIB LEVELS, Market Dynamics, AB=CD Pattern especially institutional and retailer trading psychology .
Wishing you all The Best Trades and Thank you all for your Appreciation and Support of My Work.
Much thanks to My 3 Mentors. They are so much of a Blessing that I also wish to share my knowledge.
Vive Le Autist!
Vive Le Diamond Hands!

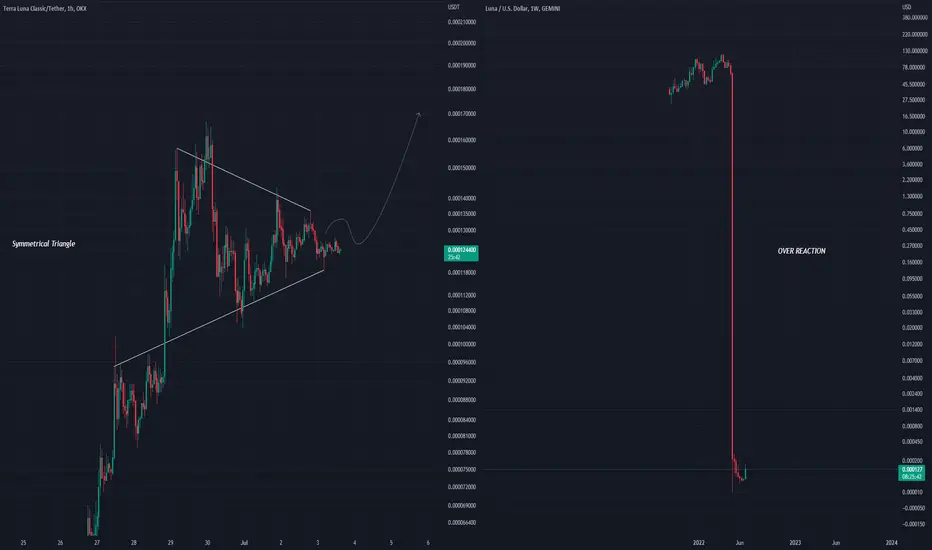
Luna 2.0 Analyze (Symmetrical Triangle)!!!Luna 2 is running in Symmetrical Triangle and it was able to complete its pullback and I expect that it will go UP .
🔴 Resistance Zone 🔴 & 🟢 Support Zone 🟢 that we have in front of Luna 2 .
🔴 Resistance Zone 🔴: 2.38$ until 2.34$
🟢 Support Zone 🟢: 2.05$ until 2.00$
Terra Analyze ( LUNAUSDT ) Timeframe 30 min⏰ (Log Scale)
❗️ Note ❗️: Please just invest 1%_max 4% of your fund in this project at this time.
Do not forget to put Stop loss for your positions (For every position you want to open).
Please follow your strategy , this is just my idea, and I will be glad to see your ideas in this post.
Please do not forget the ✅' like '✅ button 🙏😊 & Share it with your friends; thanks, and Trade safe.

LUNA Will be short term upLUNA2.0 trade will be boost up for short term from blue range area as we predicted before. You can see trade is accumulated in narrow range. Now anytime it can go up. There is one leg up before head down to zero. Trade scenario will be completely changed it crosses 50% Fib level which is around $25 level. We are expecting two mega negative candles then up after long accumulation period.

LUNAC Symmetrical Triangle HourlyLUNA has formed a beautiful symmetrical triangle on the hourly timeframe
This will likely lead to a break out to the upside for the bulls
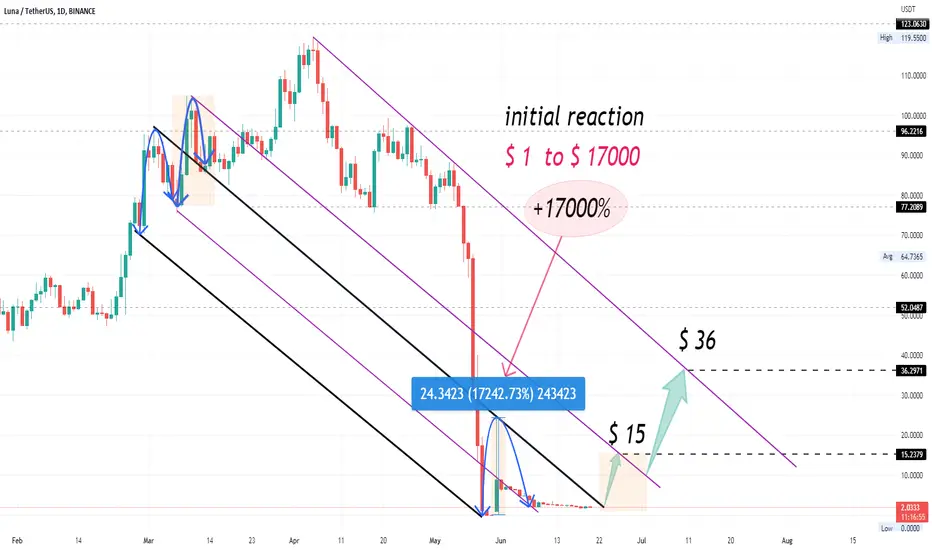
LUNA's plummet in my eyes is considered an overreaction
✅TS ❕ ETHUSD: support level✅✅ETHUSD has reached the support level and is already preparing for a rebound. I expect an upward movement.✅
🚀 BUY scenario: long to the area of the resistance level.🚀
----------------------------------------------------------------------------
Remember, there is no place for luck in trading - only strategy!
Thanks for the likes and comments.


✅TS ❕ SHIBUSD: cannot go further✅✅SHIB is moving in the area of the resistance level and cannot go further. I expect a bounce down.✅
🚀 SELL scenario: short to 0.000936.🚀
----------------------------------------------------------------------------
Remember, there is no place for luck in trading - only strategy!
Thanks for the likes and comments.

✅TS ❕ DOGEUSD: bounced back✅✅DOGE bounced back from a strong level that was once a support level. Now the price is ready for retest, after which it is expected to fall.✅
🚀 SELL scenario: short to 0.068.🚀
----------------------------------------------------------------------------
Remember, there is no place for luck in trading - only strategy!
Thanks for the likes and comments.

✅TS ❕ ETHUSD: bounced down✅✅ETHUSD has reached a resistance level from which it has already bounced down several times. Now the situation is expected to repeat and a new fall.✅
🚀 SELL scenario: short to 1047.🚀
----------------------------------------------------------------------------
Remember, there is no place for luck in trading - only strategy!
Thanks for the likes and comments.

✅TS ❕ ETHUSD: broke✅✅ETHUSD broke through the level, after which it bounced off the support and has already turned around. The price is moving towards the resistance level. I expect growth.✅
🚀 BUY scenario: long to 1238.🚀
----------------------------------------------------------------------------
Remember, there is no place for luck in trading - only strategy!
Thanks for the likes and comments.

✅TS ❕ SOLUSD: resistance level a✅✅SOL reached the resistance level and made a false breakdown, after which it returned to the level. I expect the fall to continue.✅
🚀 SELL scenario: short to 26.78.🚀
----------------------------------------------------------------------------
Remember, there is no place for luck in trading - only strategy!
Thanks for the likes and comments.

How to turn $2 into $36 ?
Consider the following pattern (ETH-2018) to understand why
ETH 2018:
History is repeating itself for Luna
Personally: an investor (newbie) should not allocate more than 5% of their portfolio funds into Luna