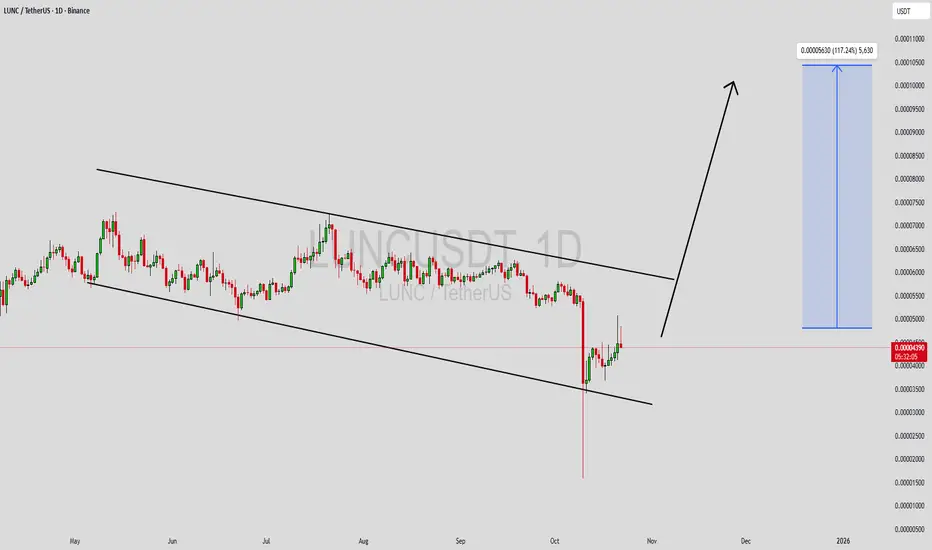
LUNCUSDT Forming Falling WedgeLUNCUSDT is currently forming a falling wedge pattern, one of the most reliable bullish reversal setups in technical analysis. This pattern indicates that the asset may be nearing the end of its downtrend, preparing for a breakout to the upside. The narrowing price range suggests that selling pressure is weakening while buyers are gradually stepping in, supported by good trading volume. This combination often signals an imminent price reversal and potential for a strong bullish move.
With an expected gain of 90% to 100%+, LUNCUSDT could be setting up for a significant recovery phase as market sentiment begins to shift in favor of buyers. A confirmed breakout above the wedge resistance could trigger renewed momentum, attracting fresh investors and traders looking to capitalize on the move. The overall structure points to a healthy technical setup, with indicators aligning for a possible sustained rally if volume continues to build.
Investor interest in LUNCUSDT has been increasing, reflecting growing optimism around the project’s fundamentals and its potential to regain market strength. This renewed attention adds confidence to the bullish setup, as higher participation often amplifies price movements after breakout confirmation. Traders are closely monitoring this pattern, anticipating a breakout that could deliver solid short-term returns and reestablish positive momentum in the broader trend.
✅ Show your support by hitting the like button and
✅ Leaving a comment below! (What is You opinion about this Coin)
Your feedback and engagement keep me inspired to share more insightful market analysis with you!
Luncusdtlong
LUNCUSDT — Accumulation at Demand Zone, Breakout or Breakdown?📝 Overview
The pair LUNC/USDT on the weekly (1W) timeframe is showing a long and extended consolidation phase since mid-2024 until now. Price has been moving sideways within the demand zone (0.00004665 – 0.00005990), marked by the yellow box on the chart.
This area serves as the final defense for buyers, acting as an accumulation base before a potential breakout to the upside. On the other hand, if broken to the downside, it could flip into a supply zone that drives price even lower.
---
🔎 Pattern Explanation
1. Weekly Range Base
Price has been trapped in a range of ~22% from top to bottom.
This kind of range often represents institutional accumulation or distribution before a major directional move.
2. Repeated Rejections
Multiple weekly candles show long lower wicks around 0.00004665, indicating buyers are still defending this zone.
3. Layered Resistance
The dotted yellow lines represent stacked resistance levels, acting as step-by-step targets if a breakout occurs.
---
🚀 Bullish Scenario
If price manages to close weekly above 0.00005990 (top of the box), bullish continuation becomes the higher-probability scenario.
Bullish Trigger: Weekly close above 0.00005990.
Upside Targets (layered):
0.00006978 – 0.00007732 (first resistance & measured move of the range).
0.00009863
0.00012186
0.00016154
0.00019578
Ultimate extension: 0.00033110
Extra confirmation: A successful retest of 0.00005990 as support + strong volume breakout.
📌 Note: As long as price holds above the yellow demand zone, the long-term structure still favors bullish accumulation.
---
🩸 Bearish Scenario
If price fails to hold and closes weekly below 0.00004665, sellers may gain control.
Bearish Trigger: Weekly close below 0.00004665.
Downside Targets:
Measured move points to around 0.00003340.
Interim psychological level: 0.00003700.
Extra confirmation: Retest of 0.00004665 from below that rejects upward recovery (zone flip into supply).
📌 Note: A breakdown here may open the door to new lower historical supports, demanding caution.
---
🎯 Key Technical Levels
Demand Zone (Main Support): 0.00004665 – 0.00005990
Resistance/Target Levels:
1. 0.00006978 – 0.00007732
2. 0.00009863
3. 0.00012186
4. 0.00016154
5. 0.00019578
6. 0.00033110
---
📌 Risk Management
Weekly timeframe → always wait for candle close to validate signals.
The yellow box range is ~22% → position sizing is crucial.
Logical stop levels: below 0.00004665 for bullish bias, above 0.00005990 for bearish bias after breakdown.
---
📢 Conclusion
Bullish Case: Breakout above 0.00005990 → opens path toward 0.00007732, 0.00012186, and potentially higher.
Bearish Case: Breakdown below 0.00004665 → downside risk toward 0.00003700 and 0.00003340.
As long as price holds within the yellow demand zone, LUNC remains in an accumulation phase awaiting a strong directional move.
#LUNC #LUNCUSDT #TerraClassic #Crypto #Altcoins #PriceAction #WeeklyChart #SupportResistance #Breakout #BearishScenario #BullishScenario #Accumulation #TechnicalAnalysis

LUNCUSDT 1W Analysis LUNC ~ 1W Analysis
#LUNC This trade is very high risk
This is the lowest support for now. Buy gradually from here with a short term target of at least 20%++

LUNCUSDTLUNC ~ 1W
#LUNC Last time the price bounced from this demand zone.
If retesting occurs again,. might be a good time to buy back at least for the short term at least 20%+

"LUNC" Strategies Using Strong Selling PowerHello friends, nice to meet you. I hope you have a good day
#LUNC
It had hoped for a rebound after the big fall, but it continues to be resisted by the power of sell.
Currently, It was retested about fall in the zone, and It is dropping down.

LUNCUSDTBINANCE:LUNCUSDT Long idea
2 entry point
4 targets
❌every TP can act as a resistance and dump the price
⛔"Daily crypto market analyses I provide are personal opinions & not financial advice. Trading carries risks, so do your own research & seek advisor's help. #DYOR
Don't forget to 🚀 and comment


LUNCUSDTBINANCE:LUNCUSDT
⛔"Daily crypto market analyses I provide are personal opinions & not financial advice. Trading carries risks, so do your own research & seek advisor's help.#DYOR"
Don't forget to like and comment

This my projection for luncusdt in short term may be 2 weeksI don't know if we are in a real bull market or a trap. But we need to react to price movements. luncusdt has been getting stronger in the last few weeks and I think it will make a move again from here.

LUNCUSDTBINANCE:LUNCUSDT long idea
⛔"Daily crypto market analyses I provide are personal opinions & not financial advice. Trading carries risks, so do your own research & seek advisor's help.#DYOR"
Don't forget to like and comment

LUNC/USDT - Terra Luna Classic: BBand_Breakout◳◱ A Bollinger Band breakout has been identified on the CRYPTOCAP:LUNC / CRYPTOCAP:USDT chart. The price has moved outside of the upper Bollinger Band, indicating a potential bullish trend. The next resistance key levels are located at 0.00010973 | 0.00013191 | 0.00017099, and the major support zones can be found at 0.00007065 | 0.00005375 | 0.00001467. Consider buying at the current price zone of 0.00009931 and targeting higher levels.BBand_Squeeze
◰◲ General info :
▣ Name: Terra Luna Classic
▣ Rank: 63
▣ Exchanges: Binance, Kucoin, Huobipro, Gateio, Poloniex, Mexc
▣ Category/Sector: Infrastructure - Smart Contract Platforms
▣ Overview: Terra is an algorithmically-governed, seigniorage share style stablecoin platform to which a collection of fiat-pegged tokens and a stabilizing cryptoasset, Luna, are native.
◰◲ Technical Metrics :
▣ Mrkt Price: 0.00009931 ₮
▣ 24HVol: 15,546,978.483 ₮
▣ 24H Chng: 3.04%
▣ 7-Days Chng: 3.79%
▣ 1-Month Chng: 8.46%
▣ 3-Months Chng: -22.56%
◲◰ Pivot Points - Levels :
◥ Resistance: 0.00010973 | 0.00013191 | 0.00017099
◢ Support: 0.00007065 | 0.00005375 | 0.00001467
◱◳ Indicators recommendation :
▣ Oscillators: SELL
▣ Moving Averages: STRONG_BUY
◰◲ Technical Indicators Summary : BUY
◲◰ Sharpe Ratios :
▣ Last 30D: 1.32
▣ Last 90D: -0.97
▣ Last 1-Y: -1.18
▣ Last 3-Y: 0.24
◲◰ Volatility :
▣ Last 30D: 1.33
▣ Last 90D: 0.94
▣ Last 1-Y: 2.77
▣ Last 3-Y: 2.78
◳◰ Market Sentiment Index :
▣ News sentiment score is N/A
▣ Twitter sentiment score is N/A
▣ Reddit sentiment score is 0.80 - V. Bullish
▣ In-depth LUNCUSDT technical analysis on Tradingview TA page
▣ What do you think of this analysis? Share your insights and let's discuss in the comments below. Your like, follow and support would be greatly appreciated!
◲ Disclaimer
Please note that the information and publications provided are for informational purposes only and should not be construed as financial, investment, trading, or any other type of advice or recommendation. We encourage you to conduct your own research and consult with a qualified professional before making any financial decisions. The use of the information provided is solely at your own risk.
▣ Welcome to the home of charting big: TradingView
Benefit from a ton of financial analysis features, instruments and data. Have a look around, and if you do choose to go with an upgraded plan, you'll get up to $30.
Discover it here - affiliate link -

LUNC stuck in a wedge and trying to breakout!A 3-push (Wedge Bottom) has been formed and based on the buying pressure and strong support area I expect the price to rise from here.
Good entry point with a nice R/R ratio.
NFA
