Buy 9 shares of LYFT foe Every one share of XLULyft
SPDR Select Sector Fund
---
1- No stop loss.
-
2- for options is Excellent:
5 call option 3 months contract of SPDR Select Sector Fund for every One call option 3 months contrac of Lyft .
----
Happy Trading!
Lyft


LYFT continuing a BreakoutLYFT beat earnings by 4X this past week and so brokeout.
On the cloud indicator, the conversion line has diverged above
the baseline.
LYFT could be watched for breakout continuation.
The Awesome Oscillator and VWAP Oscillators validate the breakout,
Added to watchlist for Monday, Aug 8th
Plan to check UBER. NASDAQ:LYFT

LYFT ready to LIFT OFF!LYFT for a bounce $21-$25 in coming weeks. False bear flag, oscillator turning upward, oversold on many indicators and excessive shorted stock which will bring additional buyers on upward move

LYFT for a bouncey bounce!Oversold on several indicators looking for a bounce over $26.00. Purchased 200 June 3rd $20 calls when stock was around $19.88 this morning. GL

Lyft: You Gotta Know When to Fold'EmBear Market for Lyft started on November 26, 2021. How do I know? I simply look at the chart. If you heed my advice and exited at that time, you would have lost 50% less than if you exited today.
Trust the charts!
---
How to understand price action.
It is very easy to read price action if you have a reference point. These support/resistance lines are there to help you read where the buyers and sellers are likely to make a stand.
You can also think of these indicators as moving pivot points .
MasterChartsTrading Price Action Indicators show good price levels to enter or exit a trade.
The Blue indicator line serves as a Bullish Trend setter.
If your instrument closes above the Blue line, we think about going Long (buying).
For commodities and Forex, when your trading instrument closes below the Red line, we think about Shorting (selling).
For Stocks, I prefer to use the Yellow line as my Bearish Trend setter (on Daily charts ). A stock has to close below the Yellow line first, then rally towards the Red line and top out there. This is where I would short it.

LYFT Disappointing OutlookLYFT predicted Q2 revenue of $950 million to $1 billion vs $1.02 billion expected
adjusted Ebitda of $10-20 million vs $83 million analysts expectations.
With this type of slow growth for a $10.7Bil company, my buy area is between $15 and $20.
Looking forward to read your opinion about it.

Lyft (NASDAQ: $LYFT) Looks Like A Buy Over The Next Week! 🚐Lyft, Inc. operates a peer-to-peer marketplace for on-demand ridesharing in the United States and Canada. The company operates multimodal transportation networks that offer riders personalized and on-demand access to various mobility options. It provides Ridesharing Marketplace, which connects drivers with riders; Express Drive, a flexible car rentals program for drivers; Lyft Rentals that provides vehicles for long-distance trips; and a network of shared bikes and scooters in various cities to address the needs of riders for short trips. The company also integrates third-party public transit data into the Lyft app to offer riders various transportation options. In addition, it offers access to autonomous vehicles; centralized tools and enterprise transportation solutions, such as concierge transportation solutions for organizations; Lyft Pink subscription plans; Lyft Pass commuter programs; first-mile and last-mile services; and university safe rides programs. The company was formerly known as Zimride, Inc. and changed its name to Lyft, Inc. in April 2013. Lyft, Inc. was incorporated in 2007 and is headquartered in San Francisco, California.

LYFT try to retag, a good location to shortHello everyone,
Today i want to share which you my idea on LYFT.
The price is going to hit the previsous support, and now it's a resistance. We can open a short at 44.87 and see if the price get reject.
The target is AB=CD, but for the most carefully of us you can take profit on the gap

UBERUber is building a falling wedge. Looks like it'll make a bullish move to the upside with time. Definitely a good value play iMO. Best of luck with this one but I'd recommend to grab shares.

Break below 50% fibo will see lower.
If 50% fibo give way,
Eye next support at 38.2% = $38
Watch the video to know the meaning of different arrow.

LYFT, Inc. SHORT POSITIONLyft Inc. is an on-demand transportation-as-a-service provider. The company is the second-largest ride-sharing service provider in the U.S., connecting riders and drivers over the Lyft app that has also entered the bike- and scooter-share market to bring multimodal transportation options to users.
Daily RSI is still bullish but we can spot a bearish divergence, pointing at a possible pullback and re-test of previous supports. In fact, on 4 hours time frame, we can see how the prices already hit the upper level of the Keltner Channel and is now re-tracing, with a decreasing RSI. Using the Williams Fractals, we can see the bullish fractal already appeared. Due to these findings, all indicators are going at the bearish momentum, therefore a short signal is generated.
Position: SHORT
Entry price: $ 52.05
Target price: $ 44.76
NO FINANCIAL ADVICE

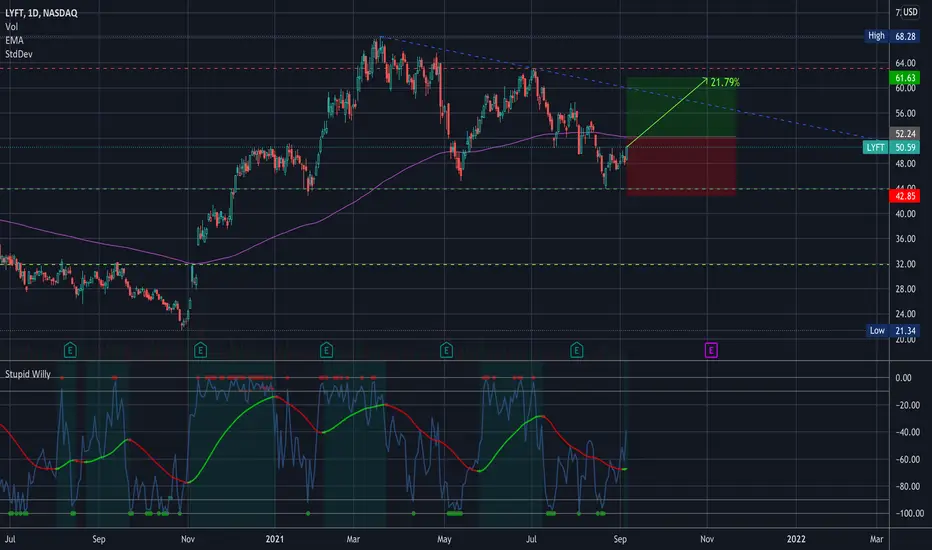
WATCHING $LYFT Analysis & Key LevelsWATCHING $LYFT Analysis & Key Levels
This looks like it might be setting up for a nice swing…
Red = Resistance
Green = Support
Blue = trend lines
180 EMA = Purple
I am not your financial advisor. Anything can happen… I’m just posting what I see… but the risk is on you if you decide to trade the setup with me.
I certainly don’t win them all so be mindful of your position sizes and do your due diligence. I’m happy to answer questions to the best of my ability.
LYFT⬆ BULLISH
MktCap $16.16B
Price $49.86
Price target $57.75/ 66.20
Stop loss $46.96
In my opinion.

TrendyTrades: Bullish LYFT AnalysisLooking for a close above 54.80. If we can close above, it can serve as confirmation.
PT.1: 58
PT.2: 60

LYFT: Potential shortUpsloping H&S pattern.
Weak rebound from neckline.
Possible area to start shorting at $58-$59.50
Target profit 1 area at neckline/ up trendline i.e around $52.50-$52
Target profit 2 area at next support around $48.50-$50
Disclaimer: I'm not giving any trading and investing advice. I'm just sharing my chart observations.
If you have any symbols that you'd like me to analyze, feel free to drop me a comment.

TUTORIAL - Finding Better Entries Finding Better Entries
Ok, y’all, I’m losing my voice a little bit… but I also just got a new microphone so that is why this video happened. So be nice about my hoarse voice.
Let me know if this is helpful and If I should do more like this
ENTRIES
PYPL - 225.30
DKNG - 43.01
CVS - 81.19
UBER - 42.97
LYFT - 48.27
ETSY - 163.08
I will most definitely be making more videos on entry targets. Leave me a comment if there's a symbol you want me to analyze in the next video. I'll try to do them every couple of days (And definitely on sunday nights)
EEducation

Keep an eye on this pivot point! 👁 👍Lyft is doing a nice pullback right now, in the 30min chart. The 20 is pretty close, but since the BB are so spread open, I believe it’ll move sideways for some time.
The 60.26 is a pivot, and if Lyft breaks it, it’ll do something good.
The problem is the RSI in the 4h chart, showing a bearish divergence + false breakout from the top area at 59s. This is another indicator that Lyft is not ready yet, but it can be in the future. It is one of the stocks that are on my radar, but it is not doing anything impressive for now.
Let’s watch the pivot in the 30min chart closely!
If you liked this trading idea, remember to click on the “Follow” button to get more trading ideas like this, and if you agree with me, click on the “Agree” button 😉.
See you soon,
Melissa.

UBER - Buy The Dip Hi, this is my update for UBER. In the last 3 days UBER has fallen more than 20%, we have lost the SMA50 and SMA100, but I think we have now reached the bottom, since we have support level around $45.90, SMA200 (46.74) and RSI is now under 30 so that means that UBER is oversold and it is time for shorts to cover in. So be prepared and don't PANIC ;)

LYFT looking very strong after holding 58-59 support last weekLYFT looking very strong after holding 58-59 support last week. Would like to see consolidation under 65 to enter otherwise will watch that 68 area if we gap above tomorrow.

LYFTThese are the levels that I'll be keeping an eye on when dealing with Lyft, and I'll revise as price action progresses.
I adapt to the change in money flow.

$UBER Break of trend near $60 will help us retest ATH near $64$UBER Break of trend near $60 will help us retest ATH near $64. With many events and locations opening back up, I'd expect a lot more people relying on $UBER and $LYFT

Long | LYFTNASDAQ:LYFT
Possible Scenario: LONG
Evidence: Price Action
This is my idea and could be wrong 100%,
