PATH - 14.90 – The Line That MattersPATH - CURRENT PRICE : 17.42
UiPATH (PATH) – Previous Targets Achieved, Buy-on-Dips Setup After Healthy Pullback
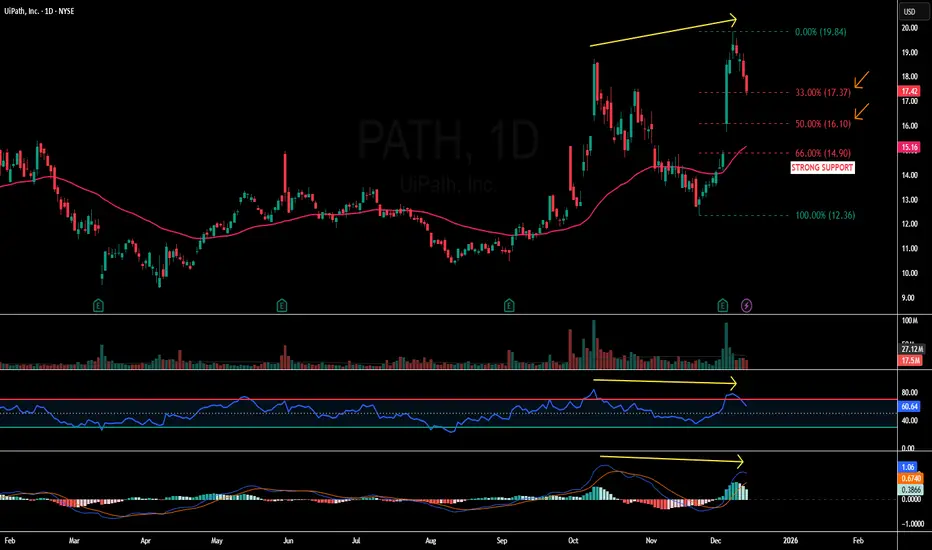
The previous technical buy call on UiPATH has successfully achieved all stated upside targets (refer to the earlier analysis via the shared link for reading context). Following this strong rally, the stock has now entered a pullback phase, which is technically expected after an extended upside move.
The current retracement is accompanied by a bearish divergence between price and momentum indicators (RSI & MACD) , as highlighted by the yellow arrows on the chart. Bearish divergence occurs when price makes a higher high while momentum indicators fail to confirm with higher highs, often signaling short-term exhaustion and a corrective move rather than a trend reversal. This explains the ongoing pullback and supports the view that the decline is corrective in nature.
From a structural perspective, the pullback remains constructive and healthy. Price has retraced approximately 33% of the prior advance, which aligns well with Dow Theory, where strong trends commonly retrace one-third or one-half before resuming the primary trend. Importantly, price continues to trade above the 50-day EMA, while both RSI and MACD remain in bullish territory, indicating that the broader bullish momentum is still intact despite near-term consolidation.
A critical level to watch is 14.90, which serves as STRONG SUPPORT. This level represents a two-thirds (≈66%) retracement under Dow Theory, coincides with a previous gap-up demand zone, and is located near the rising 50-day EMA, creating a strong confluence of technical support.
Trading Plan (Buy-on-Dips Approach):
At current levels, traders may consider initiating HALF of the intended position.
If price retraces further toward the 50% retracement level, the remaining half position may be added, as this remains a healthy pullback within an uptrend.
A decisive break below 14.90 (66% level) would invalidate the setup and should be treated as a cut-loss level.
As long as price holds above this support zone, the pullback can be viewed as a buy-the-dip opportunity, with the potential for the primary uptrend to resume.
FIRST TARGET : 18.50
SECOND TARGET : 19.80
SUPPORT : 14.90
Macdbullish
CRM - Minor Downtrend Line Broken!CRM - CURRENT PRICE : 260.57
CRM previously entered a downtrend following a double-top reversal , which pushed the stock into a prolonged bearish trend. However, current price action shows early signs of trend change as CRM successfully breaks above the minor downtrend line with strong momentum.
Momentum indicators are confirming the shift:
⚡RSI has turned bullish and moved decisively above 50
⚡MACD shows a bullish crossover with improving histogram
With improving trend structure and bullish indicators, CRM may continue its upward recovery. Price may extend toward 278.00 and 296.00 as long as it stays above 242.00 (near EMA 50).
ENTRY PRICE : 260.57
FIRST TARGET : 278.00
SECOND TARGET : 296.00
SUPPORT : 242.00

DOCU - Trendline Resistance in FocusDOCU - CURRENT PRICE : 71.87
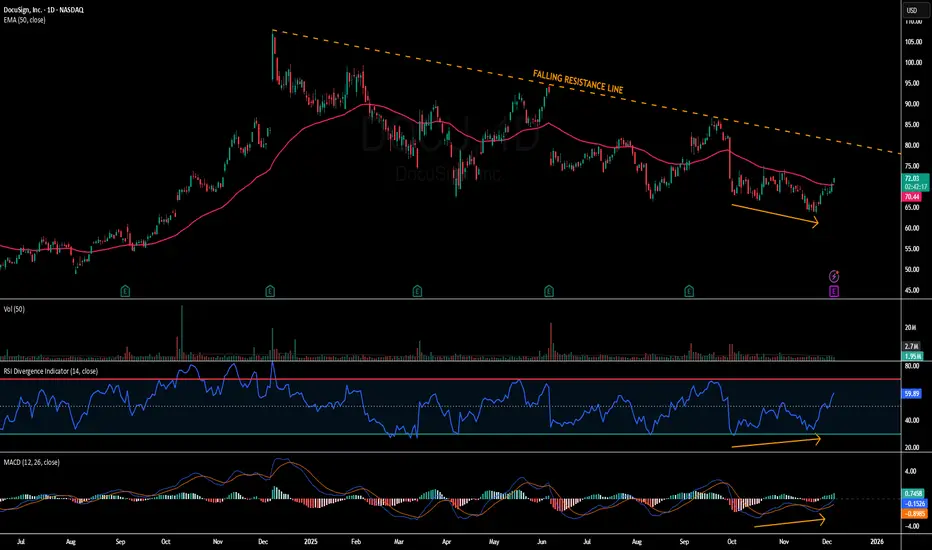
Short-term outlook for DOCU is bullish as price moves above the EMA50, supported by RSI holding above 50 and bullish divergence in both RSI and MACD (look at orange arrows). Momentum continues to improve with a MACD bullish crossover, positioning DOCU for a move toward the long-term downtrend line. First target is $79 near trendline resistance, with a potential extension to $85, while $65 remains the key support and invalidation level.
ENTRY PRICE : 70.00 - 71.87
FIRST TARGET : 79.00
SECOND TARGET : 85.00
SUPPORT : 65.00
PATH - Price Reclaims 50-EMA and 200-EMAPATH - CURRENT PRICE : 14.50 - 14.70
PATH is gaining traction after reclaiming both the 50-EMA and 200-EMA, signalling a shift back into short-term bullish momentum 📈. Price strength is supported by rising RSI and an improving MACD cross, suggesting buyers are regaining control.
🔥 Bullish Points
Price reclaimed 50-EMA and 200-EMA
RSI trending above 50 → bullish momentum returning
MACD turning positive with increasing histogram
Volume uptick on recent green candles = buyers active
ENTRY PRICE : 14.50 - 14.70
FIRST TARGET : 16.00
SECOND TARGET : 17.30
SUPPORT : 13.00

VRT – Mini Downtrend Break & Momentum Turning UpVRT - CURRENT PRICE : 179.73
VRT breaks out from a minor down channel while holding strongly within the long-term ascending trend channel. 📊 The breakout candle shows renewed buying interest, supported by RSI turning higher from the mid-zone and MACD showing early bullish improvement. 💪 With momentum improving and the long-term trend intact, the setup supports a buy-on-breakout strategy toward the upper channel.
ENTRY PRICE : 176.00 - 179.73
FIRST TARGET : 195.00
SECOND TARGET : 215.00
SUPPORT : 160.00

MRVL - RSI Back Above 50, Eyes Fibonacci Targets at 99 and 112MRVL - CURRENT PRICE : 86.00 - 88.00
MRVL is showing early signs of bullish continuation after finding support near the 50-day EMA and rebounding with positive momentum. The price structure remains healthy as it trades above the EMA 50, suggesting the medium-term trend is still intact.
Key Technical Highlights :
1) Price Above EMA 50
The stock price is holding above the EMA 50, showing that the uptrend remains valid and buyers are still in control.
2) RSI Above 50 and Not Overbought
RSI has crossed back above the 50 level, confirming improving momentum while staying below overbought territory, leaving more room for upside.
3) MACD Structure
Although the MACD line is still below the signal line, both are positioned above the zero level, indicating the overall market tone remains positive with potential for a new bullish crossover.
Based on Fibonacci extension, potential upside targets are at :
1st Target: USD 99.00 (0.618 level)
2nd Target: USD 112.00 (1.000 level)
ENTRY PRICE : 86.00 - 89.00
FIRST TARGET : 99.00
SECOND TARGET : 112.00
SUPPORT : 80.50

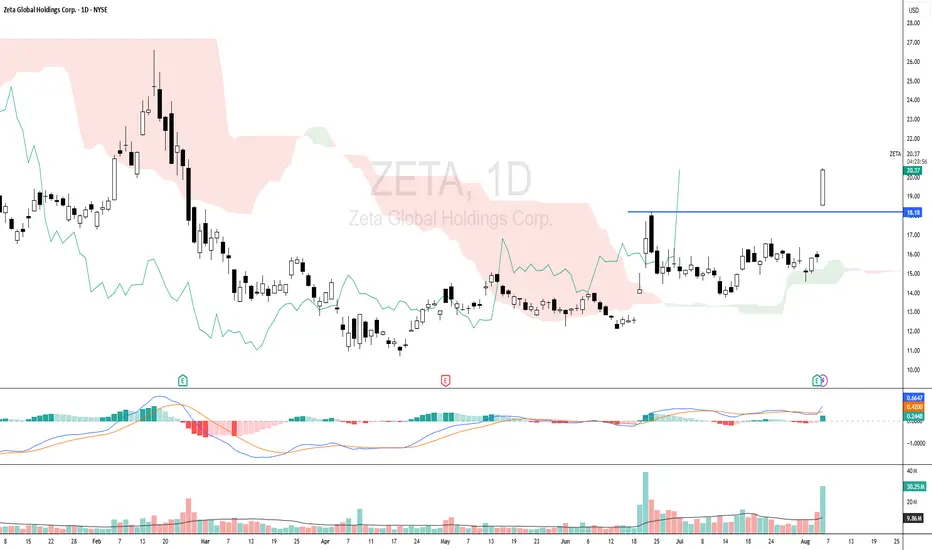
ZETA - BREAKOUT NEAREST RESISTANCEZETA - CURRENT PRICE : 20.10 - 20.25
ZETA broke out its nearest resistance 18.18 after the company announced its Quarter Earnings. For more details regarding earnings, investors/traders may visit company's website.
This bullish price action is supported by high trading volume - indicating strong buying interest from investors/traders. MACD is bullish. For ICHIMOKU CHARTS TRADERS, take note that CHIKOU SPAN is moving above candlestick which give a bullish outlook.
ENTRY PRICE : 20.00 - 20.30
TARGET : 21.50 , 23.00 and 24.50
SUPPORT : Below 18.18 (CUT LOSS below 18.18 on closing basis)
DRBHCOM - The LOW is getting HIGHER !DRBHCOM - CURRENT PRICE : RM0.815
The stock made a HIGHER LOW recently - this may consider as a half portion of new uptrend is completed. A breakout above RM0.930 will form the higher high structure - which confirm the new uptrend phase.
For short term trading purposes, short term traders may anticipate to buy if the stock breakout nearest resistance of RM0.830 - which will give an entry point at RM0.835. So this is a pending breakout stock. Nearest target will be RM0.870 and RM0.910. While support will be RM0.795. Take note also that MACD give a bullish hint.
ENTRY PRICE : RM0.835
TARGET : RM0.870 and RM0.910
SUPPORT : RM0.795
Notes : If the stock breakout RM0.930 in the future, it is a sign of strong bullish momentum (strong uptrend). So at that particular time, trend follower traders may anticipate to buy at RM0.935 - RM0.940.

LUNA has not finished its bullish journey yetLUNA has not finished its bullish journey yet, although on the weekly chart it is already well advanced, on the daily chart it still has a long way to go, so by the beginning of November we hope it will be able to overcome its All Time High.
