WOOW! Great news BTC-holders! Hi again, my beloved fans!
Even though D4rkEnergY doesnt celebrate The Chinese New Year, he will still provide his fans with presents. Its time to smile!
We are looking at the 4h BTCUSD chart. As you can see we have in a long period been in a down trending channel. D4rkEnergY already predicted 8 days ago, that we finally would break out of it, when he saw an inverse HS pattern slowly take form. To be fair D4 thought we would break through in the first attempt, but another bounce was needed before the bears got exhausted.
We are at this moment close to 10k. We always have to be aware of the big even numbers. There will always be huge resistance or support at these numbers.
Right now we are witnessing a crazy battle between the bulls and the bears. The bulls are trying to penetrate 10k, but its even harder because of the EMA200 is the same place.
D4rkEnergY will tell you one thing. The bulls will NOT win right now and here. Look at the incoming bearish MACD cross. This battle will probably take a day or two. Expect that we will range within the pink triangle!
But wait... The clever fan out there has already noticed, that the pink triangle I drew, is not just a normal triangle but an ascending triangle. That basically means that even though it will be hard for the bulls to go through 10k, on the other hand will the bears not be able to make lower lows.
And we all know what that means. The bears must give up and we will finally break through!
OUT
D4rkEnergy is everywhere, D4rkEnergY predicts everything
Macdcross

BTCUSDT 3 Chart Case StudyWe are going to study over the weekend how this pair moves.
We have a 4H - 30m - 5m chart opened.
We are going to study how price moves around our 50/100 sma
We are going to watch how the macd moves around the macd 0 level line and
the stoch 20/80 levels - blue dotted lines
The 4H is in-between the 50 and 100 sma. This I call an inner range. it has no real direction or momentum. When price breaks out of the inner range it will have direction and momentum. Watch this pair over the weekend and make copies of your chart with the camera in the lower right corner.
The 4H macd is above the 80 level. Price can go half way across to the 100 sma and fall back to the 50 sma because the macd is above the 80 level. Let's watch and see if it does.
Price may just go across to the 100 sma so let's watch if that happens and what the macd looks like during that.
If price does come back to the 50 sma two things can happen. It can break below the 50 sma and retest the swing low on the 4H. or price will try a second time to make it across to the 100 sma. Watch how the macd looks like during all of this and make sceenshots. We are not trading here we are just studing and educating ourselves how to use this indicator. As the 4H is doing all of this you want to be watching and documenting how the 1H and 5m charts look and how they are acting in these different situations. This is a great pair to teach you all of the ebb and flow of price and how the indicator reacts to it.
You are watching on the 30m and 5m how price moves around the 50/100 sma and how the macd is moving around the 80/20 levels and the 0 level line.

BTC: Strongest Average Volume tradedOnly 12 hours into the today's candles, highest volume trader by far since early 2016.
This high volume trade validates the support zone for days to come if the still holds of-course. Head and shoulder bear pressure is off has reaches its destination.
Potential reversal/consolidation is possible ahead of us. Daily chart shows RSI has enter OS level, historical data shows daily chart RSI has a major influence on bulls attacks.
End of the day candles will decides the future direction of BTC.

SPY: Bearish Chart Indicators Show a ~4% Pullback Feb-March 2018Another attempt at a call, since my last Bitcoin bearish call to short (or at least not buy) at the end of December 2017 came correct (See My Last "Idea" Below). This time, I've been slowly looking back at a historical analysis in 2017 (and even beyond) of times that the bullish market had very bearish indicators flashing. Earlier this year in April 2017 and October 2017, when the SPY Relative Strength Index (RSI) and Commodity Channel Index (CCI) were all way overbought & started to correct AND simultaneously the MACD indicator crossed over from positive to negative, there was a short-term correction. Each and every time! There are multiple examples if you look back historically that this has happened when the confluence of RSI/CCI Overbought => Correction AND MACD Crossover have led to a selloff (e.g. July 2015, September 2015, December 2015, etc.). Notably, though, the large sell-offs in SPY during August 2015 and June 2016 were ONLY preceded by a CCI Overbought => Correction AND MACD Crossover without RSI Overbought => Correction, so perhaps not all are needed to signify an extremely bearish trend ahead. And as people will note, some sell-off weren't preceded by ANY of this indicators at all.
These pull-back/dips historically have been anywhere from about ~3-5% range (I think, I didn't actually calculate it out). Given that these 3 indicators (RSI/CCI Overbought => Correction, MACD Crossover) are ALL flashing again in SPY at the end of January 2017, especially after the sell-off of the last 2 days on January 29, 2017 and January 30, 2017, I'm hypothesizing that this is the beginning of AT LEAST a ~3-5% range minor correction/pullback. If there is a confluence of other problems (e.g. negative news, negative tech earnings reports (from AAPL, FB, GOOG, AMZN, etc), rising interest rates, flat yield curve, I believe this could be a much bigger selloff than 5%, and could reach even the 10% LARGER Correction. My belief is that the market is at risk of this for potentially the rest of February 2018 and maybe even into March 2018. The increasing volatility in the VIX after being so flat for so long is also worrisome for a pull-back, in my mind.
I'm therefore taking steps to hedge my market positions, pull-back into mostly cash, and potentially buy some puts/make some short plays against SPY, DIA, QQQ and other indexes that I believe will follow the general market downwards in February and March 2018. Good luck to all, whatever your view is!
(DISCLAIMER: I have recently sold most or all my LT call positions in QQQ, SPY, DIA...after making a large profit from these between 9/2017-1/2018. I may enter a short position against QQQ, SPY, DIA in the near future as well, although I do not have any current positions in them as of yet)

BTC Important Levels to WatchBitcoin broke out of a strong downtrend line and is attempting to start a breakout. However, it still has to break out of the ascending triangle and the 11.7k resistance level within the next day or so. If it does, Bitcoin could see a pump to the 13k region or more. If it does not, Bitcoin will likely test the 10.8k region and likely the 9k region.
Now, let's take a look at the big picture to see how the short term price action will affect the big picture.
(Weekly) The RSI is approaching a key support level around 53 that has always held since the Bitcoin hype started a year and a half ago. The MACD is close to crossover, but in the past, the MACD always leveled off and the bearish crossover has never happened. Based off a key trend line, BTC has strong support in the 9k-ish region.
The weekly chart is indicating that Bitcoin has found strong support, and the correction phase is almost over. However, it'll extremely bad if Bitcoin tumbles below 8.5k and breaks 50 RSI, breaks the trend line, experiences a crossover. If that happens, key support levels are broken, and it could mean that this correction will be different from previous corrections.
On the daily chart, it seems that Bitcoin is not quite done correcting. In the past, Bitcoin has bounced off the 30 RSI level during corrections, and it could easily test that level again. In addition, a falling wedge is forming, and Bitcoin may see another touch on the lower support line. On the bright side, the MACD is close to a crossover.
The 4 hour chart isn't looking so great either. Bitcoin has some strong resistance in the 11.7k to 15k area. A price spike upwards could easily be a bull trap. The RSI is wedging; a break below the support line will send the price tumbling towards 10 or 9k, and break above will likely sustain a short-term up trend. However, the MACD is bullish as a key resistance level is broken and has found a strong support line.

EURJPY 4H MACD CROSSOVER SHORT TRADEWatch that Macd Blue line crosses below red dotted 0 level line for confirmation
Enter Short with Sell Stop @ 135.11
Exit trade @ 134.55
If Macd crosses above red dotted line exit

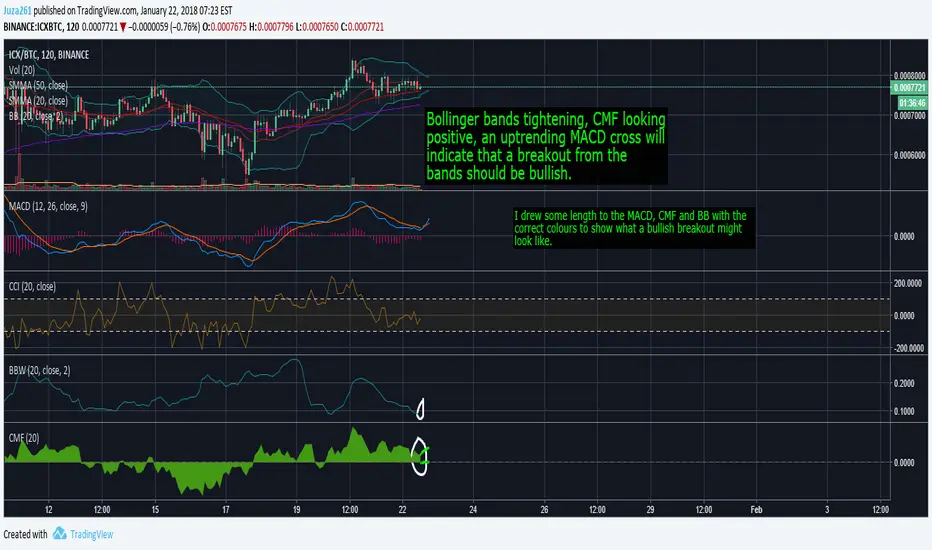
ICX/BTC breakout scenarioA demonstration of a few indicators showing that a breakout is possibly on the way, most likely happening today if the following hours show a decent trend upwards. Please leave a comment and feel free to share your opinions on the situation! I'm new so please do criticize in a friendly manner to help me chart better.
BTC -90% ? MAJOR CORRECTION IS COMING. Hello guys, a lot of analyst (me including) are too often focus on the 1h/4h or at the best 1day chart, which is good for traders but don't really show us where we are going.
First of all I would like to call back that correction and especially the biggest are HEALTHY and are a good opportunity to invest or strengthen a position.
This chart is really simple, and in fact it's only a possibility, but days after days this possibility looks more and more likely for me. If you dezoom and look at the weekly chart you can see more or less the same pattern of the crash of 2013 end and 2014. For the first time in near 4 years, the chart looks to flirt with bearish woods : RSI (Relative Strength index) is at the border (blue line is our crucial RSI support to hope for a new rise). For the first time since 2014 both MACD lines just touch what is a very bearish signal.
And the weekly chart is almost identical at the one of 2013/2014 : bullrun during 2 years with no real correction and then a weekly decline to -90% of the ATH.
We actually achieve -50% of the ATH and then maybe only half our actually correction...
BUT, because there is a but, IT WOULD NOT BE A CRASH OR THE END OF THE CRYPTO WORLD. After correct during 1 year in 2014 BTC jump from 100$ to 20000$ so we could see the beginning of new parabolic cycle in the comings months/years to 100 000$...
As quickly show with my basic Elliot Wave ABC correction, in this scenario my target would be around 2500 and 3000$. Further correction are possible, but i don't expect the price go very more low than 2000 so buy at 2500 and hold some weeks/months looks reasonable, and in the best case you just buy the perfect price :).
Goodluck everyone and have a nice day.
Feel free to post your minds, agreements and disagreements are always welcome when they are supported by arguments.
I'm not a financial advisor, i only do it for my personal entertainment, do your own research.

BTCUSD - WARNING! Not for the faint-hearted!As I was analyzing the price history of BTCUSD pair, I come across the Weekly chart of 2014-2015 time table.
As you can see in the chart presented, when the MACD crossed, all hell broke loose! FOR A YEAR!
It took a WHOLE YEAR before it recovered and then went parabolic AGAIN in 2017.
Now, we're here HOPING that the uptrend continues!
But truth be told, we are going to suffer the same fate!
If you do not want to lose money, you sell into fiat or hold on tight within AT LEAST A YEAR.
For me, I'm gonna have to switch back to forex.
At least I can sell short there. Or BitMex so that I can sell short the hell of this thing.
Anyway, may the odds be in our favor! *crossesfingers*

RDD MACD x and ichimoku basicsWe have the beginning of a macd x on the 4 hr. Tenkan Sen, about to cross Kijun Sen on the Ichimoku. Chikou Span crossing above previous the price line, and price breaking out of cloud will be another bullish confirmation. RDD is giving us more and more signs. As always be careful, set stop losses and/or alerts, never panic.
Happy trading!
Ichimoku Lines explained here.
d.stockcharts.com

BTC/USDT - Big Movement AheadThe NOV/17 bull run has bounced from the Fib 0.618 key retracement level and now follow a sidway trend within a triangle pattern . The current Support Line proves significant strenght as it already rejected the sellers for a total of four times, which prevented any further drop.
We can expect the price level to bounce from this strong Support Line and to stay within the triangle pattern. The end of this pattern will require the market to make decision. A bearish scenario could cause a drop to the long term Support Line (9.000 USD) whereas a bullish breakout that is supportet by a possible MACD Cross is going to signal a continuation of the bull run.
BASIC, PLAIN and SIMPLE.
Liked this technical analysis? Follow me for more free technical analysis and high-quality content.
Telegram: t.me/@hodlgang_germany
Twitter: twitter.com
Steemit: steemit.com

TRX Possible BreakoutTRX is forming a falling wedge and could potentially break out. The MACD crossed over and the RSI is showing a strong uptrend support line.

EURUSD 4H FLAPJACK TRADEFlapjack is a pancake. You have to flip it over to finish cooking it.
Flapjack means price chooses which side you put your jam on to eat
Let Macd fade back to center line
Bear trade Macd falls and crosses below Red line
Bull trade macd crosses above center line and stays above it
You have the option to scalp current price back to 50 or 100 sma

BTC Short Term Bounce?Whenever, the price goes up or down too fast, the price almost always retraces. Bitcoin has gone down 20% over the last two days, and is looking to make a short term bounce. A quick glance at the RSI and we see that it has broken the former trend line, which now is the support line. The RSI is no longer in a downtrend, but starting a uptrend. There also a cross over on the MACD, indicating the bears are losing momentum and can't drive the prices lower.
At the bottom, we see a long doji candle. These type of candles are often a powerful reversal signal. In addition, Bitcoin failed to made a higher low, which could mean that the downtrend is over.
Possible Trade Setup:
Stop Loss: 13700 (Slightly lower than the current low)
Target: 15740 (upper trend line in descending triangle)
What is a cross over?
www.google.com
What is a doji candle?
www.google.com

Low volume LTC - possible entry pointLTC hasn't been able to keep up with BTC and ETH in the last few days, but that may be due to it's low volume when compared to December.
Entry point under 0.015, after waiting to see if the 0.0145 support holds.
Possible MACD bullish crossing.

ETPUSD 15m Short ScalpMacd is over extended
Macd is crossing below Red Signal line
Price breaking resistance line
Price stretched away from 50 sma

LET'S HAVE SOME YEN!USDJPY 4H
Macd crossed above Red Signal line
First week of the month
First month of the year
Expecting price to move back to a neutral position by the end of the week.
Price should return to the 50 sma and 50% fib

RANGE WITHIN A RANGE WITHIN A RANGEBest Range Trading Strategy is...?
My preference is find the support/resistance levels and enter their breakouts with the break-hook-go strategy on the 15m chart.
I also watch the Macd for direction, pullbacks, & momentum moves.
What is your Range Trading Strategy - share with us in the comments below.

EURO TO FALL LONDON SESSION15M chart price has been stretched away from the 50 sma for awhile.
Macd over extended ready to cross below Red signal line

JUMP ON THE TRAINTake a short scenic route to some profits.
Why a long trade?
Higher lows developed.
Price has been away from the 50 sma for awhile.
Macd has crossed above the red signal line.
Watch pullback back to between 38.2% and 61.8% fibs then long.
Take Profit at the 50 sma. Confluence with 127.2% fib line.
Tell us how you would trade this pair!

SUSHI ON SALE 100 PIPSYou see here on the 4H the EURJPY is consolidating sideways.
The buyers and sellers are indecisive but I think the sellers will have Sushi Dinner because...
Price is stretched far away from ma's.
MACD is stretched far away from 0 level line.
MACD has crossed below Red signal line indicating possible new direction.
Close trade if MACD crosses above Red signal line.
Let us know what you think in the comments.
P.S. Waiting for our Big Three Indicator to turn Red based on a proven strategy we have been testing may be a good bearish confirmation.
I will keep you posted . Thanks!


GBPNZD 4H Macd Cross Over 0 LineMy brokers 4H close is not the same as TradingView 4H close. MT4 cross over was 2 closed candles ago so I have just entered long for 50 pips
