#MAGIC/USDT Bullish Reversal in MAGICUSDT Accumulation Zone#MAGIC
The price is moving within a descending channel on the hourly timeframe. It has reached the upper boundary and is heading towards breaking it. A retest of this boundary is expected.
The Relative Strength Index (RSI) is showing an upward trend, as it has approached the upper boundary. A bearish reversal is expected.
There is a key support zone in green at 0.1020. The price has bounced from this zone several times and is expected to bounce again.
A consolidation trend is observed above the 100-period moving average, which we are approaching. This trend supports a decline towards this level.
Entry Price: 0.1050
Target 1: 0.1060
Target 2: 0.1088
Target 3: 0.1122
Stop Loss: Above the green support zone.
Remember this simple thing: Money management.
For any questions, please leave a comment.
Thank you.
Magic

#MAGIC/USDT Bullish Reversal in MAGICUSDT Accumulation Zone#MAGIC
The price is moving in a descending channel on the 1-hour timeframe. It has reached the lower boundary and is heading towards a breakout, with a retest of the upper boundary expected.
We are seeing a bearish trend in the Relative Strength Index (RSI), which has reached near the lower boundary, and an upward bounce is expected.
There is a key support zone in green at 0.1090, and the price has bounced from this level several times. Another bounce is expected.
We are seeing a trend towards stabilizing above the 100-period moving average, which we are approaching, supporting the upward trend.
Entry Price: 0.1122
First Target: 0.1149
Second Target: 0.1180
Third Target: 0.1216
Remember a simple principle: Money Management.
Place your stop-loss order below the green support zone.
For any questions, please leave a comment.
Thank you.

#MAGIC/USDT Bullish Reversal in MAGICUSDT Accumulation Zone#MAGIC
The price is moving in a descending channel on the 1-hour timeframe. It has reached the lower boundary and is heading towards breaking above it, with a retest of the upper boundary expected.
We have a downtrend on the RSI indicator, which has reached near the lower boundary, and an upward rebound is expected.
There is a key support zone in green at 0.0928. The price has bounced from this level multiple times and is expected to bounce again.
We have a trend towards stability above the 100-period moving average, as we are moving close to it, which supports the upward movement.
Entry price: 0.0939
First target: 0.0961
Second target: 0.0984
Third target: 0.1010
Stop loss: Below the support zone in green.
Don't forget a simple thing: capital management.
For inquiries, please leave a comment.
Thank you.

MAGICUSDT – Long Trade Setup (4H)MAGICUSDT – Long Trade Setup (4H)
Price compressing inside a falling wedge
Breakout above resistance with MA support → bullish bias
Entry: ~0.097–0.098 zone
Targets: 0.102 ➝ 0.106+ (projection shown)
Stop-loss: below 0.0925 (wedge invalidation)
Falling wedge + higher lows = upside continuation.
Trade with confirmation & proper risk management.
DYOR | NFA

#MAGIC/USDT Bullish Reversal in MAGICUSDT Accumulation Zone in#MAGIC
The price is moving in a descending channel on the 1-hour timeframe. It has reached the lower boundary and is heading towards breaking above it, with a retest of the upper boundary expected.
We have a downtrend on the RSI indicator, which has reached near the lower boundary, and an upward rebound is expected.
There is a key support zone in green at 0.0920. The price has bounced from this level multiple times and is expected to bounce again.
We have a trend towards consolidation above the 100-period moving average, as we are moving close to it, which supports the upward movement.
Entry price: 0.0939
First target: 0.0961
Second target: 0.0997
Third target: 0.1040
Don't forget a simple principle: money management.
Place your stop-loss below the support zone in green.
For any questions, please leave a comment.
Thank you.

#MAGIC/USDT Bullish Reversal in MAGICUSDT Accumulation Zone in#MAGIC
The price is moving within an ascending channel on the 1-hour timeframe and is adhering to it well. It is poised to break out strongly and retest the channel.
We have a downtrend line on the RSI indicator that is about to break and retest, which supports the upward move.
There is a key support zone in green at 0.1111, representing a strong support point.
We have a trend of consolidation above the 100-period moving average.
Entry price: 0.1146
First target: 0.1194
Second target: 0.1268
Third target: 0.1343
Don't forget a simple money management rule:
Place your stop-loss order below the green support zone.
Once you reach the first target, save some money and then change your stop-loss order to an entry order.
For any questions, please leave a comment.
Thank you.

#MAGIC/USDT Bullish Reversal in MAGICUSDT Accumulation Zone #MAGIC
The price is moving in a descending channel on the 1-hour timeframe. It has reached the lower boundary and is heading towards breaking above it, with a retest of the upper boundary expected.
We have a downtrend on the RSI indicator, which has reached near the lower boundary, and an upward rebound is expected.
There is a key support zone in green at 0.0950. The price has bounced from this level multiple times and is expected to bounce again.
We have a trend towards stability above the 100-period moving average, as we are moving close to it, which supports the upward movement.
Entry price: 0.0961
First target: 0.0978
Second target: 0.1005
Third target: 0.1039
Don't forget a simple principle: money management.
Place your stop-loss below the support zone in green.
For any questions, please leave a comment.
Thank you.

#MAGIC/USDT Bullish Reversal in MAGICUSDT Accumulation Zone in
#MAGIC
The price is moving within an ascending channel on the 1-hour timeframe and is holding well. It is poised to break out strongly and retest the channel.
We have a downtrend line on the RSI indicator that is about to break and retest, which supports the upward move.
There is a key support zone in green at 0.1250, representing a strong support point.
We have a trend of consolidation above the 100-period moving average.
Entry price: 0.1270
First target: 0.1320
Second target: 0.1378
Third target: 0.1444
Don't forget a simple money management rule:
Place your stop-loss order below the green support zone.
Once you reach the first target, save some money and then change your stop-loss order to an entry order.
For any questions, please leave a comment.
Thank you.

#MAGIC/USDT Bullish Reversal in MAGICUSDT Accumulation Zone in#MAGIC
The price is moving within an ascending channel on the 1-hour timeframe and is adhering to it well. It is poised to break out strongly and retest the channel.
We have a downtrend line on the RSI indicator that is about to break and retest, which supports the upward move.
There is a key support zone in green at 0.1225, representing a strong support point.
We have a trend of consolidation above the 100-period moving average.
Entry price: 0.1265
First target: 0.1310
Second target: 0.1365
Third target: 0.1430
Don't forget a simple money management rule:
Place your stop-loss order below the green support zone.
Once you reach the first target, save some money and then change your stop-loss order to an entry order.
For any questions, please leave a comment.
Thank you.

#MAGIC/USDT Forming Falling Wedge#MAGIC
The price is moving within a descending channel on the 1-hour frame, adhering well to it, and is heading for a strong breakout and retest.
We have a bearish trend on the RSI indicator that is about to be broken and retested, which supports the upward breakout.
There is a major support area in green at 0.1445, which represents a strong support point.
We are heading for consolidation above the 100 moving average.
Entry price: 0.1464
First target: 0.1474
Second target: 0.1506
Third target: 0.1543
Don't forget a simple matter: capital management.
When you reach the first target, save some money and then change your stop-loss order to an entry order.
For inquiries, please leave a comment.
Thank you.

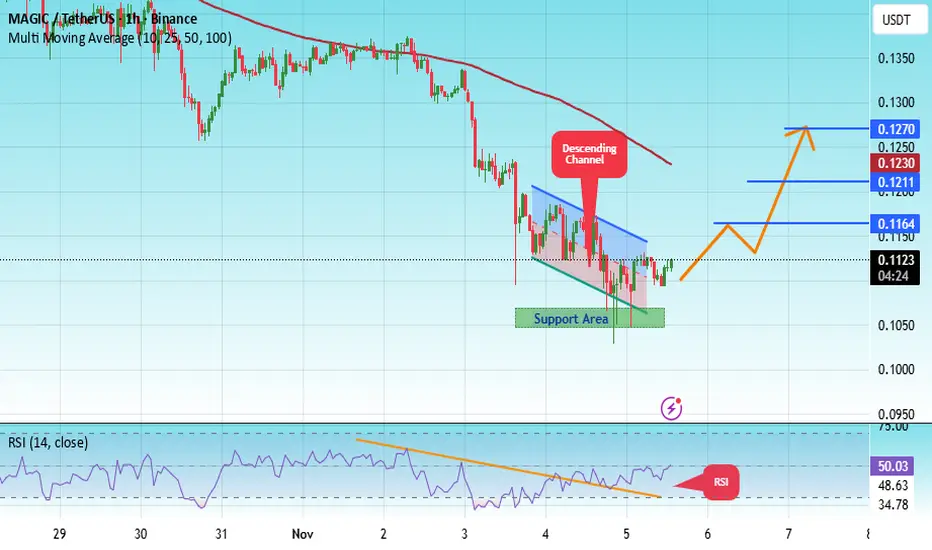
#MAGIC/USDT Forming Falling Wedge#MAGIC
The price is moving within an ascending channel on the 1-hour timeframe and is adhering to it well. It is poised to break out strongly and retest the channel.
We have a downtrend line on the RSI indicator that is about to break and retest, which supports the upward move.
There is a key support zone in green at 0.1055, representing a strong support point.
We have a trend of consolidation above the 100-period moving average.
Entry price: 0.1123
First target: 0.1164
Second target: 0.1211
Third target: 0.1270
Don't forget a simple money management rule:
Place your stop-loss order below the green support zone.
Once you reach the first target, save some money and then change your stop-loss order to an entry order.
For any questions, please leave a comment.
Thank you.
Fibonacci Beyond the ObviousFibonacci Beyond the Obvious
The Professional Approach — WerkTrader Edition 🎯
1️⃣ Introduction – More Than Just a Sequence
Fibonacci is not magic, myth, or a decorative tool for colorful charts.
It is a mathematical ratio that appears in nature, architecture, music – and yes, in markets.
If you only know Fibonacci as the 61.8 retracement, you understand the concept,
but not the depth.
A true analyst doesn’t use Fibonacci to draw lines –
he uses it to measure structure,
to see where the market stands in relation to itself.
2️⃣ The Principle of Self-Similarity
Markets are fractal.
They move in repeating proportions, regardless of timeframe.
A 38.2 pullback on the 15-minute chart can have the same character
as a 61.8 retracement on the daily.
Professionals call this Fractal Alignment –
multiple timeframes reacting to the same ratio,
and that’s exactly where the decisive moves occur.
3️⃣ Fibonacci Timing – The Invisible Factor
Most traders measure price, not time.
But Fibonacci also works horizontally.
13, 21, 34, 55 – not as price levels,
but as candle intervals between significant highs and lows.
These Fibonacci Time Projections reveal
when market cycles overlap –
often the moment before price reacts to a known zone.
Institutional models use this quietly,
while retail traders almost always overlook it.
4️⃣ Fibonacci in Orderflow
Fibonacci zones are not magical support lines –
they are points of liquidity interaction.
At 61.8 %, three groups often collide:
1️⃣ Retail shorts fading the retracement,
2️⃣ Smart-money algorithms collecting liquidity,
3️⃣ Position builders using the pullback for entry.
Fibonacci is not a signal – it’s a trigger area,
a place where energy releases.
5️⃣ Asymmetry and Precision
The famous ratio φ ≈ 1.618 is mathematically perfect,
but markets are not.
A professional observes the deviation from the ideal –
often just 1–2 %.
Those small over- or undershoots reveal who dominates:
reaction or manipulation.
This is called Fibonacci Deviation Bias –
a subtle detail that shows whether a zone was merely tested
or truly broken.
6️⃣ Cluster Theory – The Art of Overlap
A single level is coincidence.
But when multiple retracements or extensions
align within the same price area,
a cluster is formed.
This overlap of different swings is called Confluence.
The more Fibonacci relationships converge,
the stronger the reaction.
A professional doesn’t look for the “perfect number” –
he looks for the connection of proportions.
Mathematics confirms itself where ratios intersect.
7️⃣ Fibonacci & Harmonic Patterns – Geometry of Confirmation
Harmonic patterns are the advanced geometry of Fibonacci relationships.
They consist of several precisely measured retracements and extensions,
forming a geometric reversal structure –
like the Gartley, Bat, Butterfly, or Crab.
Each one is built on the same base ratios:
XA → AB = 61.8 %,
BC = 38.2–88.6 %,
CD = 127–161.8 %.
When these measurements meet at a single point,
they create the PRZ (Potential Reversal Zone) –
the mathematical intersection between order and chaos.
The more Fibonacci connections overlap,
the stronger the confirmation.
That’s not coincidence – that’s confluence in its purest form.
8️⃣ Fibonacci as a Language
Fibonacci is not a strategy – it’s a language of proportion.
It doesn’t tell you where to buy,
it tells you where to listen.
The market doesn’t speak in words,
it speaks in ratios.
Those who understand them see structure
where others see only lines.
9️⃣ Conclusion – The Silence of Numbers
Fibonacci is not a myth.
It is the quietest form of truth in the market.
Numbers themselves do not speak –
but they show you where the market reacts,
where mathematics meets psychology,
and where patience becomes power.
Fewer lines.
More meaning.
This is Fibonacci – beyond the obvious.
WerkTrader 🎯

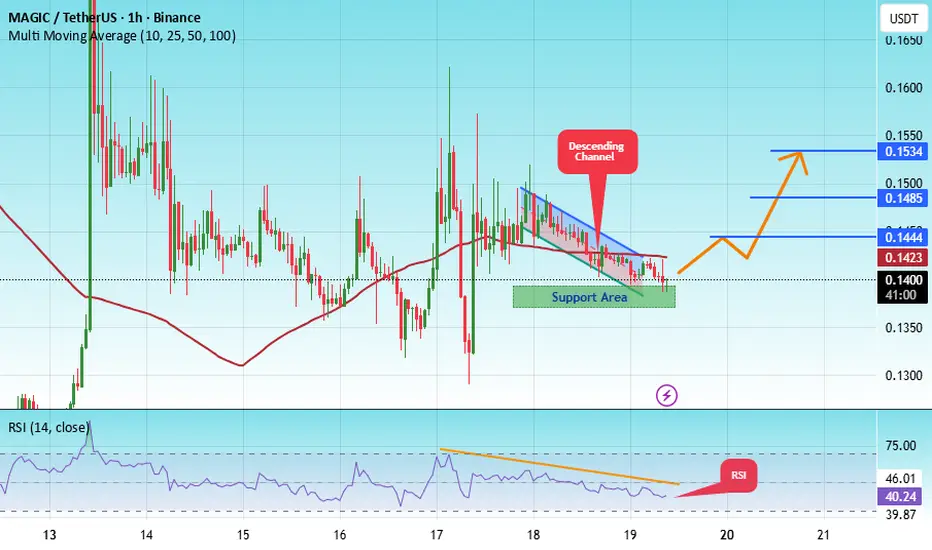
#MAGIC/USDT Forming Falling Wedge#MAGIC
The price is moving within a descending channel on the 1-hour frame, adhering well to it, and is heading for a strong breakout and retest.
We have a bearish trend on the RSI indicator that is about to be broken and retested, which supports the upward breakout.
There is a major support area in green at 0.1370, which represents a strong support point.
We are heading for stability above the 100 moving average.
Entry price: 0.1400
First target: 0.1444
Second target: 0.1485
Third target: 0.1534
Don't forget a simple matter: capital management.
When you reach the first target, save some money and then change your stop-loss order to an entry order.
For inquiries, please leave a comment.
Thank you.
MAGICUSDT Forming Falling WedgeMAGICUSDT is currently displaying a strong falling wedge pattern a classic bullish reversal setup that often precedes significant upward momentum. After a period of consistent consolidation and price compression, the pattern indicates that sellers are losing control while buying pressure quietly builds up. The volume remains strong, showing growing interest from traders and investors alike. With the wedge nearing its breakout point, a powerful rally could be on the horizon, with potential gains between 190% and 200%+ if momentum accelerates as expected.
The current technical structure of MAGICUSDT reflects a period of accumulation, where smart investors are positioning early in anticipation of a trend reversal. Once the upper resistance of the wedge is broken with convincing volume, it may trigger a surge in bullish momentum, driving prices sharply higher. This potential breakout could mark the start of a long-awaited recovery phase, making it a key setup to watch closely for medium to long-term traders.
Market sentiment around MAGICUSDT is turning increasingly positive as investor confidence strengthens across the crypto market. Technical indicators show early signs of a momentum shift, supported by higher trading volume and renewed interest from whales and institutional players. If confirmed, the breakout could open doors for a sustained rally, creating one of the most exciting setups currently forming in the altcoin market.
✅ Show your support by hitting the like button and
✅ Leaving a comment below! (What is You opinion about this Coin)
Your feedback and engagement keep me inspired to share more insightful market analysis with you!

MAGICUSDT UPDATE#MAGIC
UPDATE
MAGIC Technical Setup
Pattern: Bullish falling wedge pattern
Current Price: $0.143
Target Price: $0.291
Target % Gain: 103.1%
OMXTSE:MAGIC is forming a bullish falling wedge on the 1D timeframe, suggesting potential for an upside breakout. With the current price at $0.143 and a projected target around $0.291, there’s a possible 103% gain ahead if momentum continues.
Time Frame: 1D
Risk Management Tip: Always use proper risk management.

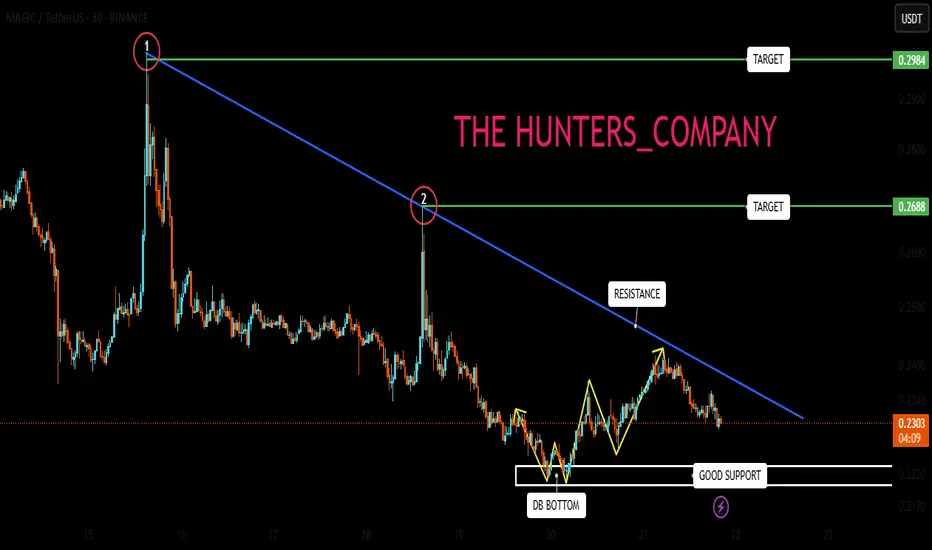
Important resistance blocking the way to the ascent...Hello friends
Well, we have a downtrend, and you can see that we have drawn a resistance for it, and the price has hit this resistance twice.
After the second hit, the price has fallen to the specified support area, and in that area a double bottom pattern has formed, and the price has been supported. Now, considering the support in this price area, we need to see if the buyers can break the specified resistance or not?
If the resistance is broken, the price can move up to the two specified areas, but if the price falls, we need to see if the support that once supported the price and caused the price to grow can support it again or not?
So, follow capital and risk management
*Trade safely with us*
Breakout Above Resistance Could Fuel Strong Rally$MAGIC/USDT has been moving inside a clear structure where buyers and sellers are battling for control.
The major resistance line above has acted as a strong barrier multiple times, and a clean breakout here could open the door for a much stronger bullish move.
On the flip side, the ascending support line has been holding well, showing steady higher lows and signaling that buyers are still active. The mid support–resistance zone has also been a key pivot area, with price bouncing off it several times.
As long as price continues to respect this support and manages to push through the resistance trendline, the bias remains bullish.
If it fails to hold the support, though, the structure weakens and further downside becomes possible.
More updates coming soon, stay tuned.
DYOR, NFA

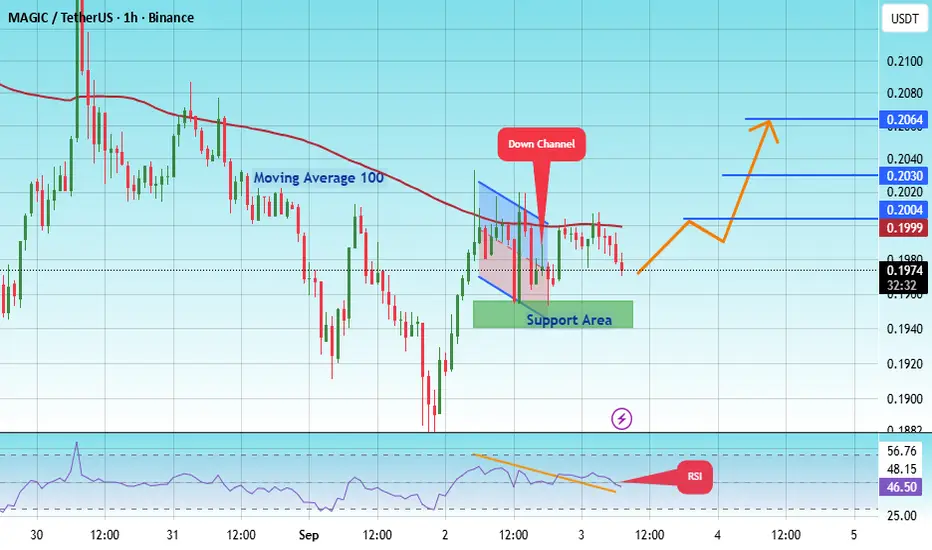
#MAGIC/USDT Reversal in MAGICUSDT Accumulation Zone in Focus #MAGIC
The price is moving within a descending channel on the 1-hour frame, adhering well to it, and is heading for a strong breakout and retest.
We have a bearish trend on the RSI indicator that is about to be broken and retested, which supports the upward breakout.
There is a major support area in green at 0.1950, which represents a strong support point.
For inquiries, please leave a comment.
We are in a consolidation trend above the 100 Moving Average.
Entry price: 0.1974
First target: 0.2000
Second target: 0.2030
Third target: 0.2064
Don't forget a simple matter: capital management.
When you reach the first target, save some money and then change your stop-loss order to an entry order.
For inquiries, please leave a comment.
Thank you.
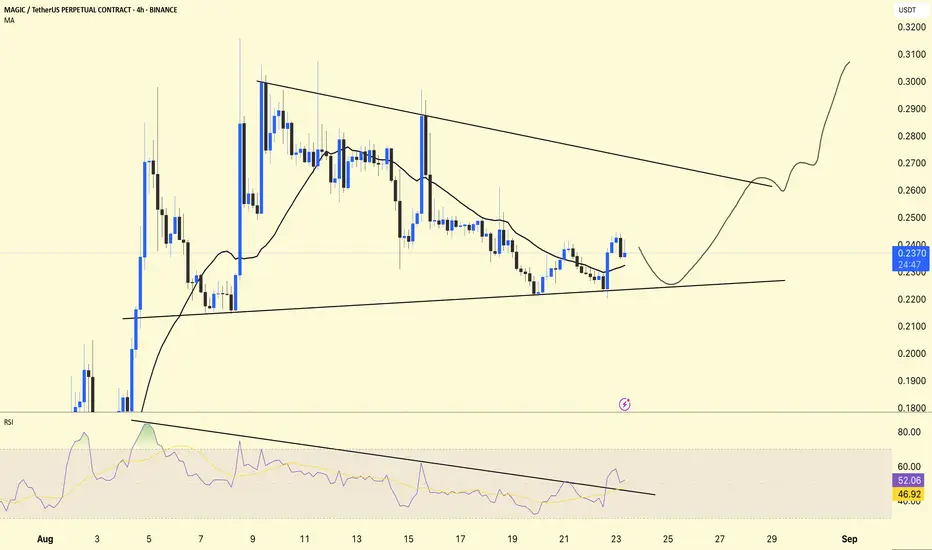
MAGIC/USDT 4H Analysis !!
MAGIC is currently trading at $0.2376, showing a falling wedge structure with RSI breakout confirmation.
📊 Chart Overview:
Falling Wedge Pattern
The price is consolidating between a lower high and a higher low.
If it breaks to the upside, it is a bullish reversal pattern.
Support Area
Strong support (trendline support) near $0.22–0.225.
As long as this level holds, downside looks limited.
RSI Indicator
RSI = 52.64, above its MA (46.96).
RSI broke its downtrend line → early sign of bullish momentum building.
Moving Average (MA 25)
The price is slightly above the moving average (0.2324), which is a sign of short-term correction.
DYOR | NFA
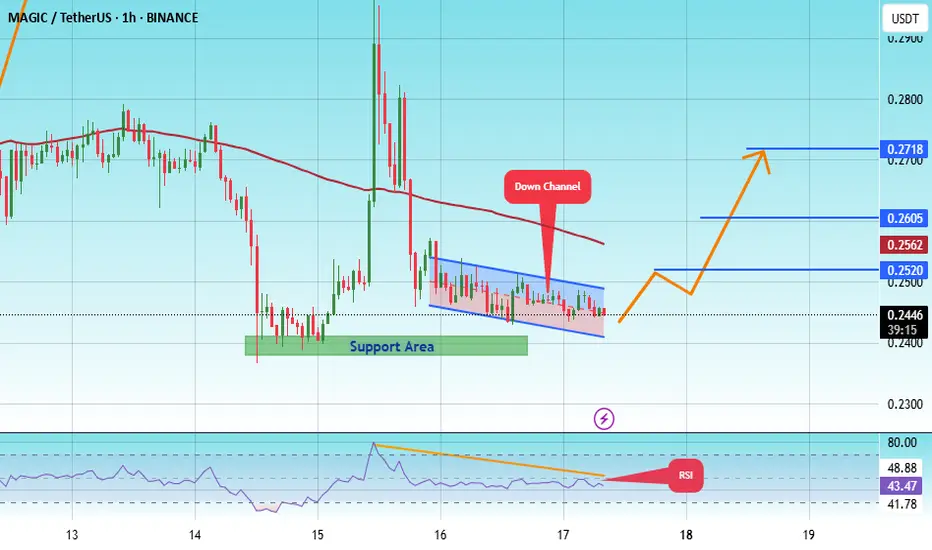
#MAGIC/USDT Reversal in MAGICUSDT Accumulation Zone in Focus !#MAGIC
The price is moving within an ascending channel on the 1-hour frame, adhering well to it, and is on its way to breaking strongly upwards and retesting it.
We have support from the lower boundary of the ascending channel, at 0.2419.
We have a downtrend on the RSI indicator that is about to break and retest, supporting the upside.
There is a major support area in green at 0.2390, which represents a strong basis for the upside.
Don't forget a simple thing: ease and capital.
When you reach the first target, save some money and then change your stop-loss order to an entry order.
For inquiries, please leave a comment.
We have a trend to hold above the 100 Moving Average.
Entry price: 0.2445.
First target: 0.2520.
Second target: 0.2605.
Third target: 0.2718.
Don't forget a simple thing: ease and capital.
When you reach the first target, save some money and then change your stop-loss order to an entry order.
For inquiries, please leave a comment.
Thank you.
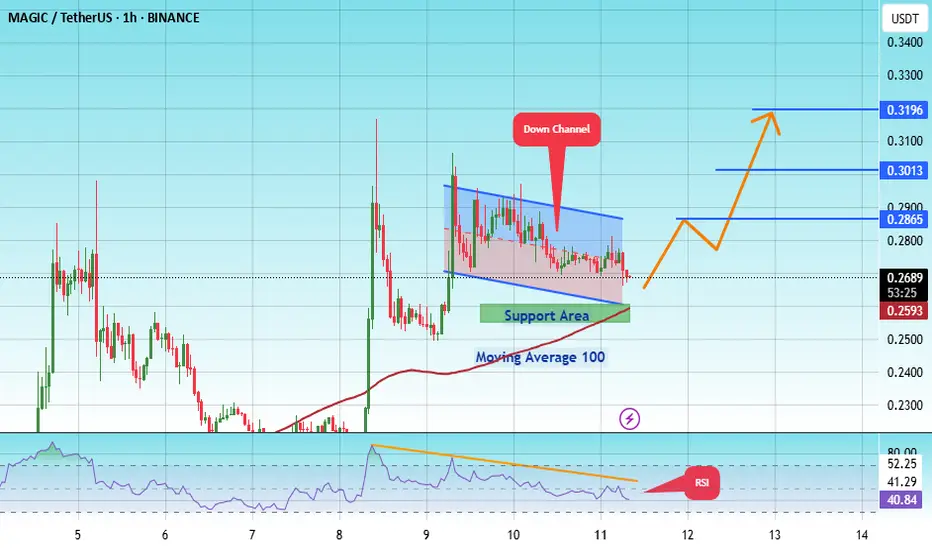
#MAGIC/USDT Reversal in MAGICUSDT Accumulation Zone in Focus !#MAGIC
The price is moving within an ascending channel on the 1-hour frame, adhering well to it, and is on its way to breaking strongly upwards and retesting it.
We have support from the lower boundary of the ascending channel, at 0.2630.
We have a downtrend on the RSI indicator that is about to be broken and retested, supporting the upside.
There is a major support area in green at 0.2565, which represents a strong basis for the upside.
Don't forget a simple thing: ease and capital.
When you reach the first target, save some money and then change your stop-loss order to an entry order.
For inquiries, please leave a comment.
We have a trend to hold above the 100 Moving Average.
Entry price: 0.2690.
First target: 0.2865.
Second target: 0.3013.
Third target: 0.3196.
Don't forget a simple thing: ease and capital.
When you reach your first target, save some money and then change your stop-loss order to an entry order.
For inquiries, please leave a comment.
Thank you.
MAGIC (SPOT)BINANCE:MAGICUSDT
#MAGIC / USDT
Entry range (0.240- 0.260)
SL 4H close below 0.230
T1 0.33
T2 0.39
T3 0.42
Extra Targets
T1 0.48
_______________________________________________________
Golden Advices.
********************
* collect the coin slowly in the entry range.
* Please calculate your losses before the entry.
* Do not enter any trade you find it not suitable for you.
* No FOMO - No Rush , it is a long journey.

MAGIC Buy/Long Setup (1D)On the chart, an important trigger line has been broken. A strong bullish CH (Change of Character) is also visible on the chart.
The green zone is a low-risk area for a rebuy.
Targets are marked on the chart.
A daily candle close below the invalidation level will invalidate this analysis.
For risk management, please don't forget stop loss and capital management
Comment if you have any questions
Thank You
