#MAGIC/USDT Bullish Reversal in MAGICUSDT Accumulation Zone#MAGIC
The price is moving within a descending channel on the hourly timeframe. It has reached the lower boundary and is heading towards a breakout, with a retest of the upper boundary expected.
The Relative Strength Index (RSI) is showing a downward trend, approaching the lower boundary, and an upward bounce is anticipated.
There is a key support zone in green at 0.0650, and the price has bounced from this level several times. Another bounce is expected.
The RSI is showing a trend towards consolidation above the 100-period moving average, which we are approaching, supporting the upward move.
Entry Price: 0.0683
Target 1: 0.0703
Target 2: 0.0729
Target 3: 0.0760
Stop Loss: Below the green support zone.
Remember this simple thing: Money management.
For any questions, please leave a comment.
Thank you.
MAGICBTC

#MAGIC/USDT Bullish Reversal in MAGICUSDT Accumulation Zone#MAGIC
The price is moving within a descending channel on the hourly timeframe. It has reached the lower boundary and is heading towards a breakout, with a retest of the upper boundary expected.
The Relative Strength Index (RSI) is showing a downward trend, approaching the lower boundary, and an upward bounce is anticipated.
There is a key support zone in green at 0.0855, and the price has bounced from this level several times. Another bounce is expected.
The RSI is showing a trend towards consolidation above the 100-period moving average, which we are approaching, supporting the upward move.
Entry Price: 0.0890
Target 1: 0.0913
Target 2: 0.0948
Target 3: 0.0989
Stop Loss: Below the green support zone.
Remember this simple thing: Money management.
For any questions, please leave a comment.
Thank you.

#MAGIC/USDT Bullish Reversal in MAGICUSDT Accumulation Zone#MAGIC
The price is moving within a descending channel on the hourly timeframe. It has reached the upper boundary and is heading towards breaking it. A retest of this boundary is expected.
The Relative Strength Index (RSI) is showing an upward trend, as it has approached the upper boundary. A bearish reversal is expected.
There is a key support zone in green at 0.1020. The price has bounced from this zone several times and is expected to bounce again.
A consolidation trend is observed above the 100-period moving average, which we are approaching. This trend supports a decline towards this level.
Entry Price: 0.1050
Target 1: 0.1060
Target 2: 0.1088
Target 3: 0.1122
Stop Loss: Above the green support zone.
Remember this simple thing: Money management.
For any questions, please leave a comment.
Thank you.

MAGICUSDT UPDATEMAGIC
UPDATE
MAGIC Technical Setup
Pattern: Falling Wedge Pattern
Current Price: $0.10 USDT
Target Price: $0.2500 USDT
Target % Gain: 145.74%
Technical Analysis: MAGIC (Treasure token) is positioned as breaking out of a potential falling wedge pattern on the 1D chart, signaling possible bullish momentum if the breakout sustains. Price is currently consolidating near a key breakout area, and reclaiming above the descending trendline with follow-through could validate a larger move toward the highlighted target near $0.2500. At current levels around $0.10, this projected move represents significant upside if structure holds and volume supports the breakout.
Time Frame: 1D
Risk Management Tip: Always use proper risk management.

#MAGIC/USDT Bullish Reversal in MAGICUSDT Accumulation Zone#MAGIC
The price is moving in a descending channel on the 1-hour timeframe. It has reached the lower boundary and is heading towards a breakout, with a retest of the upper boundary expected.
We are seeing a bearish trend in the Relative Strength Index (RSI), which has reached near the lower boundary, and an upward bounce is expected.
There is a key support zone in green at 0.1090, and the price has bounced from this level several times. Another bounce is expected.
We are seeing a trend towards stabilizing above the 100-period moving average, which we are approaching, supporting the upward trend.
Entry Price: 0.1122
First Target: 0.1149
Second Target: 0.1180
Third Target: 0.1216
Remember a simple principle: Money Management.
Place your stop-loss order below the green support zone.
For any questions, please leave a comment.
Thank you.

#MAGIC/USDT Bullish Reversal in MAGICUSDT Accumulation Zone#MAGIC
The price is moving in a descending channel on the 1-hour timeframe. It has reached the lower boundary and is heading towards breaking above it, with a retest of the upper boundary expected.
We have a downtrend on the RSI indicator, which has reached near the lower boundary, and an upward rebound is expected.
There is a key support zone in green at 0.0928. The price has bounced from this level multiple times and is expected to bounce again.
We have a trend towards stability above the 100-period moving average, as we are moving close to it, which supports the upward movement.
Entry price: 0.0939
First target: 0.0961
Second target: 0.0984
Third target: 0.1010
Stop loss: Below the support zone in green.
Don't forget a simple thing: capital management.
For inquiries, please leave a comment.
Thank you.

MAGICUSDT – Long Trade Setup (4H)MAGICUSDT – Long Trade Setup (4H)
Price compressing inside a falling wedge
Breakout above resistance with MA support → bullish bias
Entry: ~0.097–0.098 zone
Targets: 0.102 ➝ 0.106+ (projection shown)
Stop-loss: below 0.0925 (wedge invalidation)
Falling wedge + higher lows = upside continuation.
Trade with confirmation & proper risk management.
DYOR | NFA

#MAGIC/USDT Bullish Reversal in MAGICUSDT Accumulation Zone in#MAGIC
The price is moving in a descending channel on the 1-hour timeframe. It has reached the lower boundary and is heading towards breaking above it, with a retest of the upper boundary expected.
We have a downtrend on the RSI indicator, which has reached near the lower boundary, and an upward rebound is expected.
There is a key support zone in green at 0.0920. The price has bounced from this level multiple times and is expected to bounce again.
We have a trend towards consolidation above the 100-period moving average, as we are moving close to it, which supports the upward movement.
Entry price: 0.0939
First target: 0.0961
Second target: 0.0997
Third target: 0.1040
Don't forget a simple principle: money management.
Place your stop-loss below the support zone in green.
For any questions, please leave a comment.
Thank you.

#MAGIC/USDT Bullish Reversal in MAGICUSDT Accumulation Zone in#MAGIC
The price is moving within an ascending channel on the 1-hour timeframe and is adhering to it well. It is poised to break out strongly and retest the channel.
We have a downtrend line on the RSI indicator that is about to break and retest, which supports the upward move.
There is a key support zone in green at 0.1111, representing a strong support point.
We have a trend of consolidation above the 100-period moving average.
Entry price: 0.1146
First target: 0.1194
Second target: 0.1268
Third target: 0.1343
Don't forget a simple money management rule:
Place your stop-loss order below the green support zone.
Once you reach the first target, save some money and then change your stop-loss order to an entry order.
For any questions, please leave a comment.
Thank you.

#MAGIC/USDT Bullish Reversal in MAGICUSDT Accumulation Zone #MAGIC
The price is moving in a descending channel on the 1-hour timeframe. It has reached the lower boundary and is heading towards breaking above it, with a retest of the upper boundary expected.
We have a downtrend on the RSI indicator, which has reached near the lower boundary, and an upward rebound is expected.
There is a key support zone in green at 0.0950. The price has bounced from this level multiple times and is expected to bounce again.
We have a trend towards stability above the 100-period moving average, as we are moving close to it, which supports the upward movement.
Entry price: 0.0961
First target: 0.0978
Second target: 0.1005
Third target: 0.1039
Don't forget a simple principle: money management.
Place your stop-loss below the support zone in green.
For any questions, please leave a comment.
Thank you.

#MAGIC/USDT Bullish Reversal in MAGICUSDT Accumulation Zone in
#MAGIC
The price is moving within an ascending channel on the 1-hour timeframe and is holding well. It is poised to break out strongly and retest the channel.
We have a downtrend line on the RSI indicator that is about to break and retest, which supports the upward move.
There is a key support zone in green at 0.1250, representing a strong support point.
We have a trend of consolidation above the 100-period moving average.
Entry price: 0.1270
First target: 0.1320
Second target: 0.1378
Third target: 0.1444
Don't forget a simple money management rule:
Place your stop-loss order below the green support zone.
Once you reach the first target, save some money and then change your stop-loss order to an entry order.
For any questions, please leave a comment.
Thank you.

#MAGIC/USDT Bullish Reversal in MAGICUSDT Accumulation Zone in#MAGIC
The price is moving within an ascending channel on the 1-hour timeframe and is adhering to it well. It is poised to break out strongly and retest the channel.
We have a downtrend line on the RSI indicator that is about to break and retest, which supports the upward move.
There is a key support zone in green at 0.1225, representing a strong support point.
We have a trend of consolidation above the 100-period moving average.
Entry price: 0.1265
First target: 0.1310
Second target: 0.1365
Third target: 0.1430
Don't forget a simple money management rule:
Place your stop-loss order below the green support zone.
Once you reach the first target, save some money and then change your stop-loss order to an entry order.
For any questions, please leave a comment.
Thank you.

#MAGIC/USDT Forming Falling Wedge#MAGIC
The price is moving within a descending channel on the 1-hour frame, adhering well to it, and is heading for a strong breakout and retest.
We have a bearish trend on the RSI indicator that is about to be broken and retested, which supports the upward breakout.
There is a major support area in green at 0.1445, which represents a strong support point.
We are heading for consolidation above the 100 moving average.
Entry price: 0.1464
First target: 0.1474
Second target: 0.1506
Third target: 0.1543
Don't forget a simple matter: capital management.
When you reach the first target, save some money and then change your stop-loss order to an entry order.
For inquiries, please leave a comment.
Thank you.

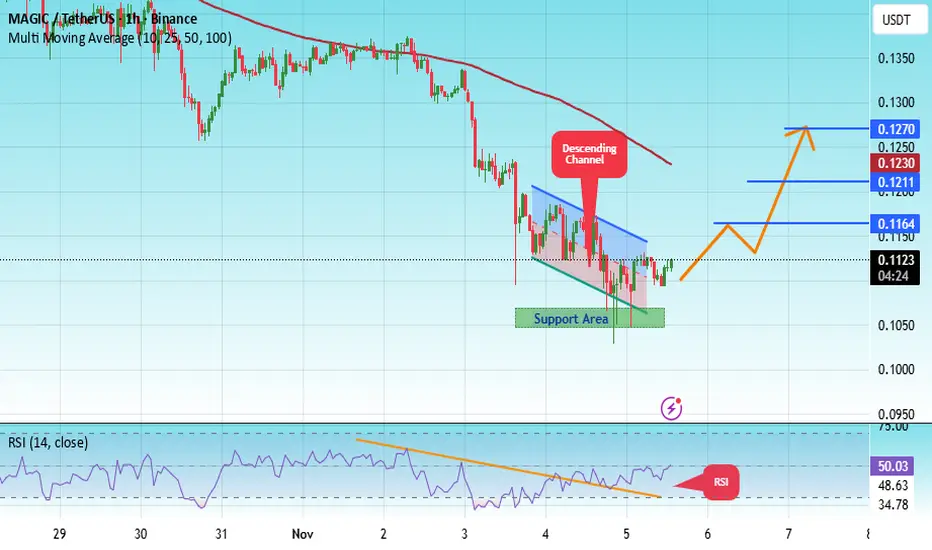
#MAGIC/USDT Forming Falling Wedge#MAGIC
The price is moving within an ascending channel on the 1-hour timeframe and is adhering to it well. It is poised to break out strongly and retest the channel.
We have a downtrend line on the RSI indicator that is about to break and retest, which supports the upward move.
There is a key support zone in green at 0.1055, representing a strong support point.
We have a trend of consolidation above the 100-period moving average.
Entry price: 0.1123
First target: 0.1164
Second target: 0.1211
Third target: 0.1270
Don't forget a simple money management rule:
Place your stop-loss order below the green support zone.
Once you reach the first target, save some money and then change your stop-loss order to an entry order.
For any questions, please leave a comment.
Thank you.
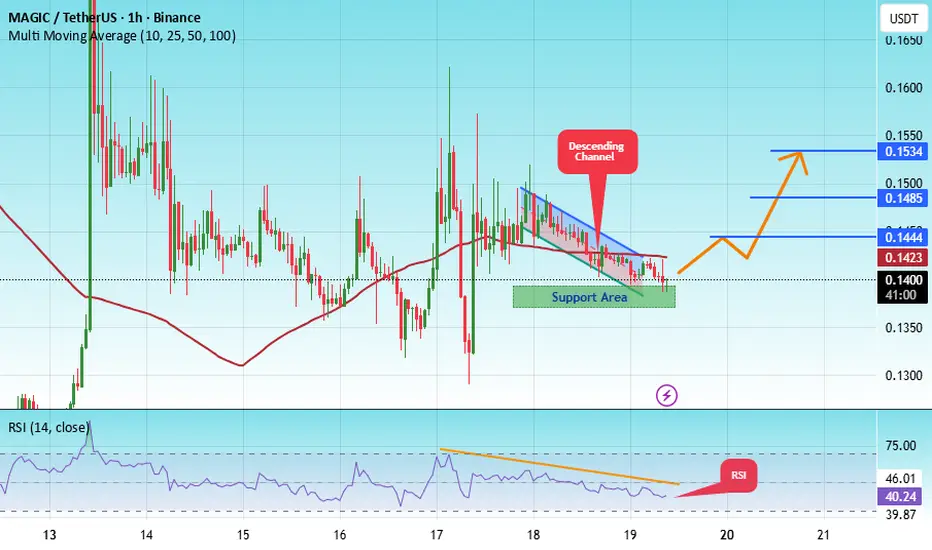
#MAGIC/USDT Forming Falling Wedge#MAGIC
The price is moving within a descending channel on the 1-hour frame, adhering well to it, and is heading for a strong breakout and retest.
We have a bearish trend on the RSI indicator that is about to be broken and retested, which supports the upward breakout.
There is a major support area in green at 0.1370, which represents a strong support point.
We are heading for stability above the 100 moving average.
Entry price: 0.1400
First target: 0.1444
Second target: 0.1485
Third target: 0.1534
Don't forget a simple matter: capital management.
When you reach the first target, save some money and then change your stop-loss order to an entry order.
For inquiries, please leave a comment.
Thank you.
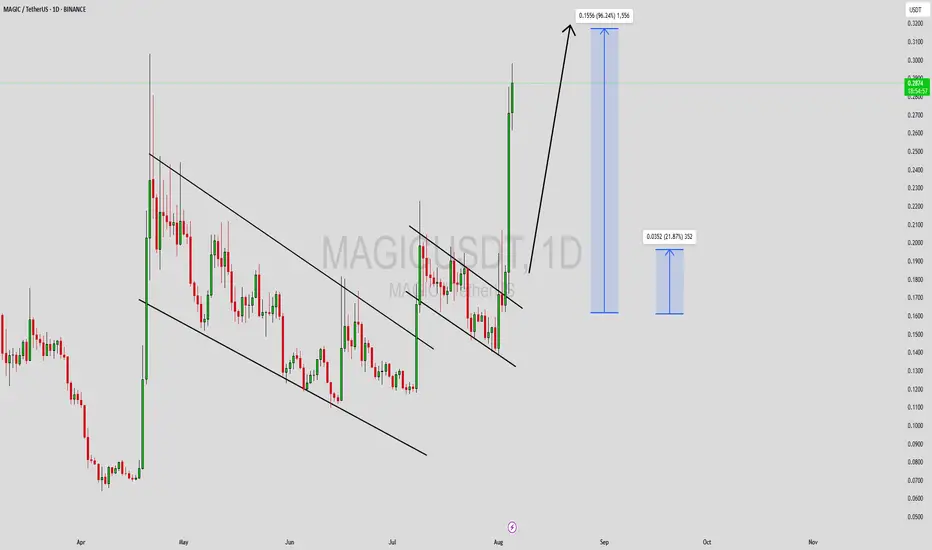
MAGICUSDT Forming Falling WedgeMAGICUSDT is currently displaying a strong falling wedge pattern a classic bullish reversal setup that often precedes significant upward momentum. After a period of consistent consolidation and price compression, the pattern indicates that sellers are losing control while buying pressure quietly builds up. The volume remains strong, showing growing interest from traders and investors alike. With the wedge nearing its breakout point, a powerful rally could be on the horizon, with potential gains between 190% and 200%+ if momentum accelerates as expected.
The current technical structure of MAGICUSDT reflects a period of accumulation, where smart investors are positioning early in anticipation of a trend reversal. Once the upper resistance of the wedge is broken with convincing volume, it may trigger a surge in bullish momentum, driving prices sharply higher. This potential breakout could mark the start of a long-awaited recovery phase, making it a key setup to watch closely for medium to long-term traders.
Market sentiment around MAGICUSDT is turning increasingly positive as investor confidence strengthens across the crypto market. Technical indicators show early signs of a momentum shift, supported by higher trading volume and renewed interest from whales and institutional players. If confirmed, the breakout could open doors for a sustained rally, creating one of the most exciting setups currently forming in the altcoin market.
✅ Show your support by hitting the like button and
✅ Leaving a comment below! (What is You opinion about this Coin)
Your feedback and engagement keep me inspired to share more insightful market analysis with you!

MAGICUSDT UPDATE#MAGIC
UPDATE
MAGIC Technical Setup
Pattern: Bullish falling wedge pattern
Current Price: $0.143
Target Price: $0.291
Target % Gain: 103.1%
OMXTSE:MAGIC is forming a bullish falling wedge on the 1D timeframe, suggesting potential for an upside breakout. With the current price at $0.143 and a projected target around $0.291, there’s a possible 103% gain ahead if momentum continues.
Time Frame: 1D
Risk Management Tip: Always use proper risk management.

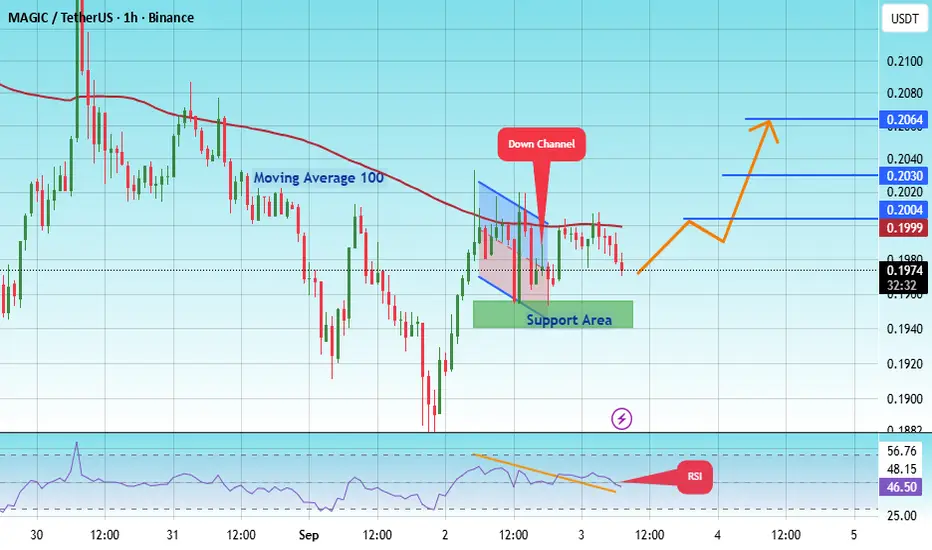
#MAGIC/USDT Reversal in MAGICUSDT Accumulation Zone in Focus #MAGIC
The price is moving within a descending channel on the 1-hour frame, adhering well to it, and is heading for a strong breakout and retest.
We have a bearish trend on the RSI indicator that is about to be broken and retested, which supports the upward breakout.
There is a major support area in green at 0.1950, which represents a strong support point.
For inquiries, please leave a comment.
We are in a consolidation trend above the 100 Moving Average.
Entry price: 0.1974
First target: 0.2000
Second target: 0.2030
Third target: 0.2064
Don't forget a simple matter: capital management.
When you reach the first target, save some money and then change your stop-loss order to an entry order.
For inquiries, please leave a comment.
Thank you.
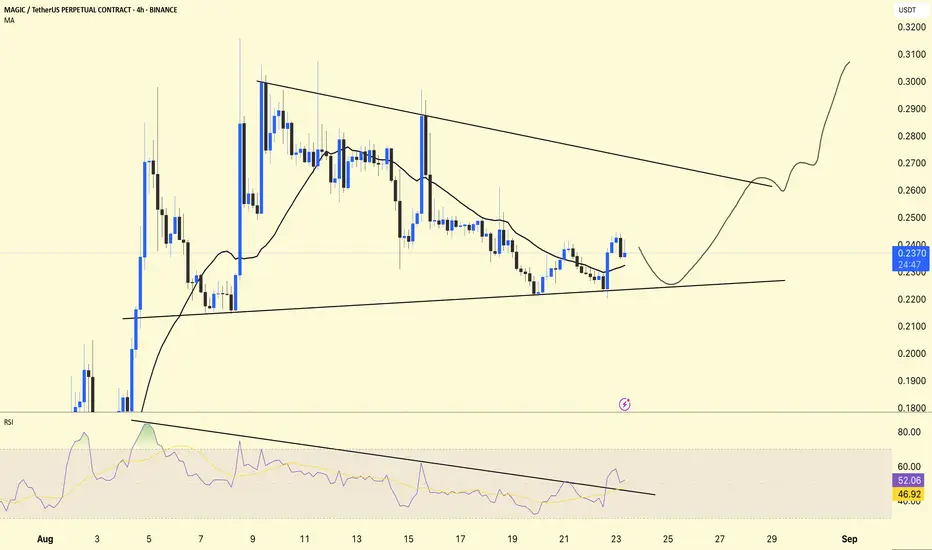
MAGIC/USDT 4H Analysis !!
MAGIC is currently trading at $0.2376, showing a falling wedge structure with RSI breakout confirmation.
📊 Chart Overview:
Falling Wedge Pattern
The price is consolidating between a lower high and a higher low.
If it breaks to the upside, it is a bullish reversal pattern.
Support Area
Strong support (trendline support) near $0.22–0.225.
As long as this level holds, downside looks limited.
RSI Indicator
RSI = 52.64, above its MA (46.96).
RSI broke its downtrend line → early sign of bullish momentum building.
Moving Average (MA 25)
The price is slightly above the moving average (0.2324), which is a sign of short-term correction.
DYOR | NFA
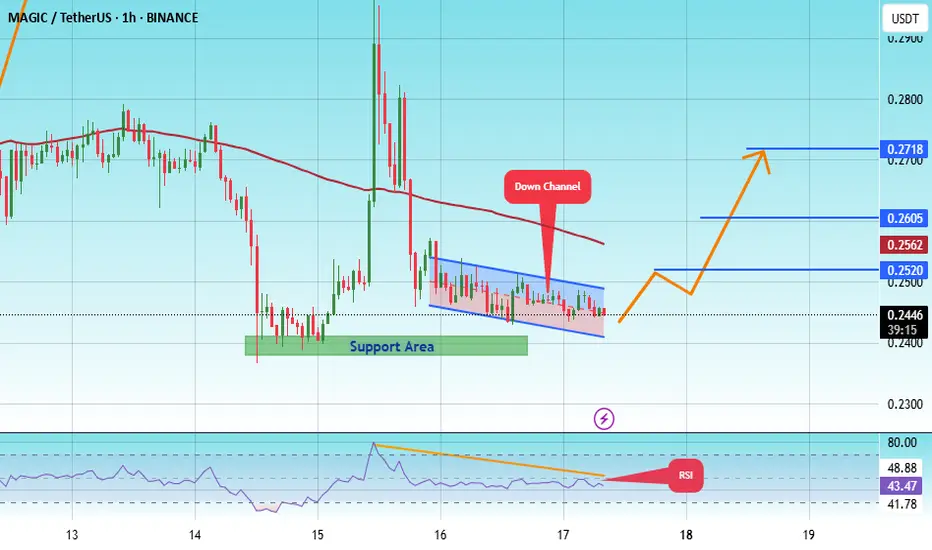
#MAGIC/USDT Reversal in MAGICUSDT Accumulation Zone in Focus !#MAGIC
The price is moving within an ascending channel on the 1-hour frame, adhering well to it, and is on its way to breaking strongly upwards and retesting it.
We have support from the lower boundary of the ascending channel, at 0.2419.
We have a downtrend on the RSI indicator that is about to break and retest, supporting the upside.
There is a major support area in green at 0.2390, which represents a strong basis for the upside.
Don't forget a simple thing: ease and capital.
When you reach the first target, save some money and then change your stop-loss order to an entry order.
For inquiries, please leave a comment.
We have a trend to hold above the 100 Moving Average.
Entry price: 0.2445.
First target: 0.2520.
Second target: 0.2605.
Third target: 0.2718.
Don't forget a simple thing: ease and capital.
When you reach the first target, save some money and then change your stop-loss order to an entry order.
For inquiries, please leave a comment.
Thank you.
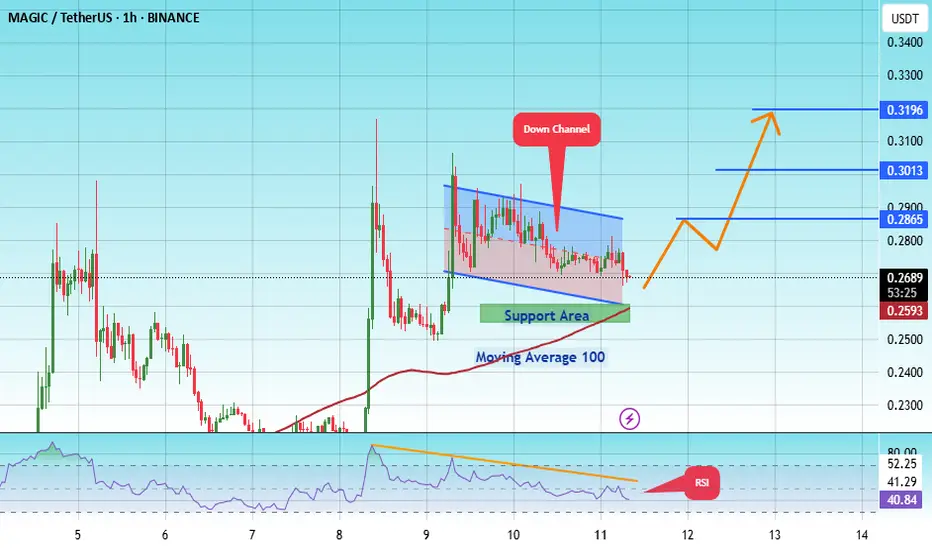
#MAGIC/USDT Reversal in MAGICUSDT Accumulation Zone in Focus !#MAGIC
The price is moving within an ascending channel on the 1-hour frame, adhering well to it, and is on its way to breaking strongly upwards and retesting it.
We have support from the lower boundary of the ascending channel, at 0.2630.
We have a downtrend on the RSI indicator that is about to be broken and retested, supporting the upside.
There is a major support area in green at 0.2565, which represents a strong basis for the upside.
Don't forget a simple thing: ease and capital.
When you reach the first target, save some money and then change your stop-loss order to an entry order.
For inquiries, please leave a comment.
We have a trend to hold above the 100 Moving Average.
Entry price: 0.2690.
First target: 0.2865.
Second target: 0.3013.
Third target: 0.3196.
Don't forget a simple thing: ease and capital.
When you reach your first target, save some money and then change your stop-loss order to an entry order.
For inquiries, please leave a comment.
Thank you.
MAGIC Buy/Long Setup (1D)On the chart, an important trigger line has been broken. A strong bullish CH (Change of Character) is also visible on the chart.
The green zone is a low-risk area for a rebuy.
Targets are marked on the chart.
A daily candle close below the invalidation level will invalidate this analysis.
For risk management, please don't forget stop loss and capital management
Comment if you have any questions
Thank You

MAGICUSDT Forming Falling WedgeMAGICUSDT is currently forming a classic Falling Wedge Pattern, a bullish reversal setup that often indicates a trend shift from bearish to bullish. This pattern is characterized by converging trendlines that slope downward, with declining volume throughout its formation—a sign that selling pressure is gradually decreasing. The breakout from this structure is typically explosive, making this setup highly attractive to traders looking for high-reward opportunities.
Volume on MAGICUSDT remains strong, a vital confirmation for the validity of the wedge pattern. Sustained buying volume after a breakout often signals the beginning of a substantial rally. As of now, MAGIC appears poised to challenge resistance levels, and if the breakout occurs, we could see a price surge of 90% to 100% or more, aligning with historical wedge breakouts in crypto markets.
The broader sentiment around the MAGIC ecosystem is also showing positive momentum. As a key player in the decentralized gaming and NFT infrastructure space, MAGIC has consistently drawn attention from investors who believe in the long-term potential of Web3 gaming. Its integration with various metaverse projects and innovative use cases continues to attract both developers and traders.
This combination of bullish technical structure, growing trading interest, and strong fundamentals makes MAGICUSDT one of the more promising setups in the current market cycle. Keep an eye on key breakout levels, as the next leg up could come with swift and significant price movement.
✅ Show your support by hitting the like button and
✅ Leaving a comment below! (What is You opinion about this Coin)
Your feedback and engagement keep me inspired to share more insightful market analysis with you!