MAGIC/USDT LAST SCENARIOI would like to share the latest status of our chart and explain why I didn't enter at the previous levels of $0.76-$0.77.
Since my target for this coin is over 30%, my priority is to enter positions with minimal risk to safely carry the position. What caught my attention, thanks to my alerts, was the consistent approach to our initial levels without breaking through. Currently, it has established that region as a support level.
A break below that region would mean taking more than a 10% risk for me. Considering the target we have in mind, this isn't ideal. Those who wish can still enter from these levels gradually.
However, for me, entering from the green area starting at $0.65, as you can see in the chart, seems much safer.
With my alerts active, placing orders when it reaches that point and waiting for the targets to be achieved is the most prudent strategy. I hope we achieve maximum gains with minimum risk.
Magicusdtperp

Second MagicUSDT ScenarioPresenting my second analysis for MAGICUSDT. In this assessment, I'm taking into account the potential impact of a Bitcoin correction. If such a correction occurs, I believe this analysis holds merit. Please refer to the attached photo for the primary trend line.

MAGIC/USDT AnalysisI'm excited to share an analysis on MAGICUSDT that appears quite promising. Currently on a bullish trend with consistent buy signals, Magic seems poised for an intriguing move. Taking into account recent Bitcoin movements, our projection places Magic in the highlighted zone captured in the attached photo, roughly ranging between $0.76 to $0.77.
Trade Plan:
Target Price: $0.76 - $0.77
Expected Gain: 30%+
Risk Management: 5%
The risk-reward ratio is meticulously set at 5% risk for a potential gain exceeding 30%, a risk deemed acceptable given the current market conditions. For a detailed look at the potential stop scenario, please refer to the attached photo.
It's important to clarify that this isn't financial advice but an analysis we believe deserves consideration. As always, your individual decision-making is crucial. Whether you choose to join the position or not, it should align with your own assessment of the market.
Wishing everyone a profitable trade!

MAGIC target 0.734h time frame
-
MAGIC just broke out the downtrend line. It is creating a bottom structure and retesting the support zone around 0.55. If MAGIC is doing the potential symmetrical, we can see it reach 0.73 soon, and there are higher targets.
TP: 0.73 / 0.8 /0.9
SL: 0.525

MAGICUSDT - Double Bottom Pattern!MAGICUSDT (1D Chart) Technical analysis
MAGICUSDT (1D Chart) Currently trading at $0.594
Buy level: Above $0.595
Stop loss: Below $0.5
TP1: $0.65
TP2: $0.75
TP3: $0.88
TP4: $1
Max Leverage 3x
Always keep Stop loss
Follow Our Tradingview Account for More Technical Analysis Updates, | Like, Share and Comment Your thoughts

MAGICUSDTTime to rebuy BINANCE:MAGICUSDT
"Daily crypto market analyses I provide are personal opinions & not financial advice. Trading carries risks, so do your own research & seek advisor's help."
Don't forget to like and comment

$MAGIC Falling WedgeOMXTSE:MAGIC Falling Wedge Breakout has Confirmed on the Daily timeframe Chart..!!

MAGICUSDT may head up for resistance around 0.8336-0.8520The price is trading in a zone where it experienced free fall on the recent drop a few day ago. The next resistance for the price is 4h resistance 4HR1 as marked on the chart. This resistance zone sits around 0.8336-0.8520. The probability of the price to aim for this 4h resistance is high. Therefore a long is favorable here. However, there is a reasonable probability of the price to revisit the support zone below specially 4h support 4HS1 and probably 4HS2. Therefore, a better entry for the long would be those levels.

MAGICUSDT.P Bullish 1H TFThis script shows high probability of bullishness at 1H TF. No divergence found.

MY BIAS ON MAGICUSDT FOR SHORTMagicusdt 15M TF Analysis , For This TF My Bias Is Short As It Tested 15M Supply Zone And Got Rejected Creating Fair Value Gap And Created Divergence On 5M TF RSI.Break Of Stracture Happened On 5M TF,Before Breaking Grabbed Multiple Liquidity.Support Got Broken And Later Acting As Resistance ,Resistance Acted As Support For A Short Time But Eventually Got Broken.I Am Gonna Focus On Premium Zone For Entry.And There Are Some Liquidity Resting On Upside Thats why I Am Thinking it will go up and take them and tap into my entry.
i am gonna have two entry
FIRST ENTRY
ENTRY - 0.9241
SL - 0.9375
TP- 0.8923
RR - 1:2.37
SECOND ENTRY
ENTRY - 0.9294
SL - 0.9400
TP- 0.8923
RR - 1:3.5 MEXC:MAGICUSDT.P

Magic Levels To Watch Magicusdt
Price trading in triangle pattern I am expecting bounce from this support but we have to wait for confirmation incase of breakout expecting maasive bullesh rally , on the otherside if price lose this support there will be 15-20% drop most probably

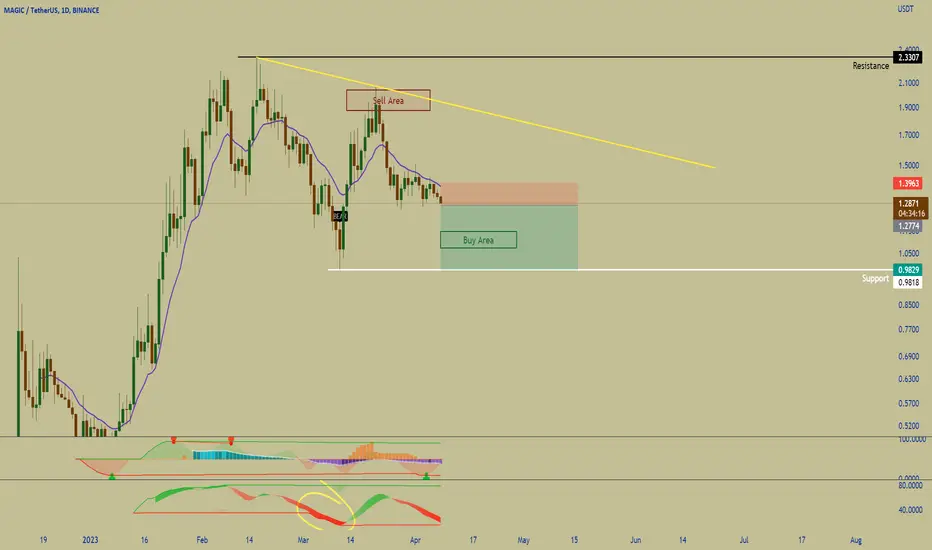
MAGIC/USDT short ideaThis is a short idea for MAGIC on the short term scenario. Stop loss if we end up above the red box or go above 1.40.
This is a mid term short call.
Magic Most Probably Magicusdt
Most probably magic price will touch uooer trendline resistance incoming days
Risk Under Your Control always trade with your own research

MAGIC token formed bullish Gartley for upto 10.50Hi dear friends, hope you are well and welcome to the new trade setup of MAGIC token with US Dollar pair.
Our last successful trade of MAGIC was as below:
Now on a 4-hr time frame, MAGIC has formed a bullish Gartley move for another price reversal.
Note: Above idea is for educational purpose only. It is advised to diversify and strictly follow the stop loss, and don't get stuck with trade

MAGICUSDTMagic lost an important support and the support turned into resistance. It showed a reaction to the resistance and continues the downward trend. In my opinion, the price will soon reach 1 dollar and maybe even lower.
⚠️This is not a financial advice and only My personal opinion

MAGIC : UPCOMING TRENDThe upcoming trend for MAgic, the trend will show it this coin is able to gain the next levels as the chart shows the coming time.
For day traders it's always good to take TP in steps when the trade is into green
Some levels are for the long term.


Short-term Magic/USDT PredictionI think this one has more power to go up. I keep on watching this coin very carefully with some hope
maybe it could be the next AXS.

Magic Buy TradeHere is My Study on Magic. According to my study. Magic has just now Finshed the Retracement. And Ready to Jump Up.
Welcome to my channel! Here you'll find daily technical analysis of the latest trends in the crypto market. From Bitcoin to altcoins, I'll be sharing my insights and predictions to help you make informed decisions about your investments. Follow me for the latest updates and join the conversation in the comments!
Crypto technical analysis uses past price history to predict future price. It's not a guarantee and shouldn't be relied on solely for investment decisions. Consider other factors such as market trends, economic strength and information dissemination. Use with caution.

MAGICUSDT setup for longIn general, Magic is in an upward trend. After a correction, the upward trend has started again and the rest of the story is clear in the chart. But this is not an Financial advice and it is only my personal opinion and it may be wrong. #DYOR

MAGICUSDT Resistance Breakout!MAGICUSDT (4h Chart) Technical analysis
MAGICUSDT (4h Chart) Currently trading at $2.17
Buy level: Above $2.16
Stop loss: Below $1.66
TP1: $2.6
TP2: $2.9
TP3: $3.2
TP4: $3.8
Max Leverage 2x
Always keep Stop loss
Follow Our Tradingview Account for More Technical Analysis Updates, | Like, Share and Comment Your thoughts
