M&M good for booking profit is short run
M&M good for booking profit is short run. I think Nifty profit booking started today, so all the big guys will see profit booking.
Mahindraandmahindra

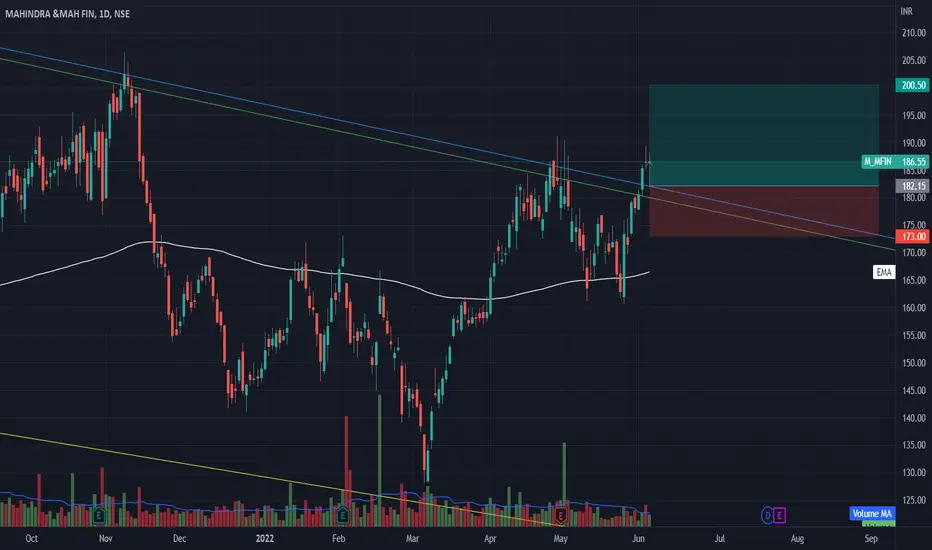
M_MFIN - 1 MONTH TIME FRAMEThe Structure looks good to us, waiting for this instrument to correct and then give us these opportunities as shown on this instrument (Price Chart).
Note: Its my view only and its for educational purpose only. Only who has got knowledge about this strategy, will understand what to be done on this setup. its purely based on my technical analysis only (strategies). we don't focus on the short term moves, we look for only for Bullish or Bearish Impulsive moves on the setups after a good price action is formed as per the strategy. we never get into corrective moves. because it will test our patience and also it will be a bullish or a bearish trap. and try trade the big moves.
we do not get into bullish or bearish traps. We anticipate and get into only big bullish or bearish moves (Impulsive Moves). Just ride the Bullish or Bearish Impulsive Move. Learn & Know the Complete Market Cycle.
Buy Low and Sell High Concept. Buy at Cheaper Price and Sell at Expensive Price.
Keep it simple, keep it Unique.
please keep your comments useful & respectful.
Thanks for your support....
Tradelikemee Academy


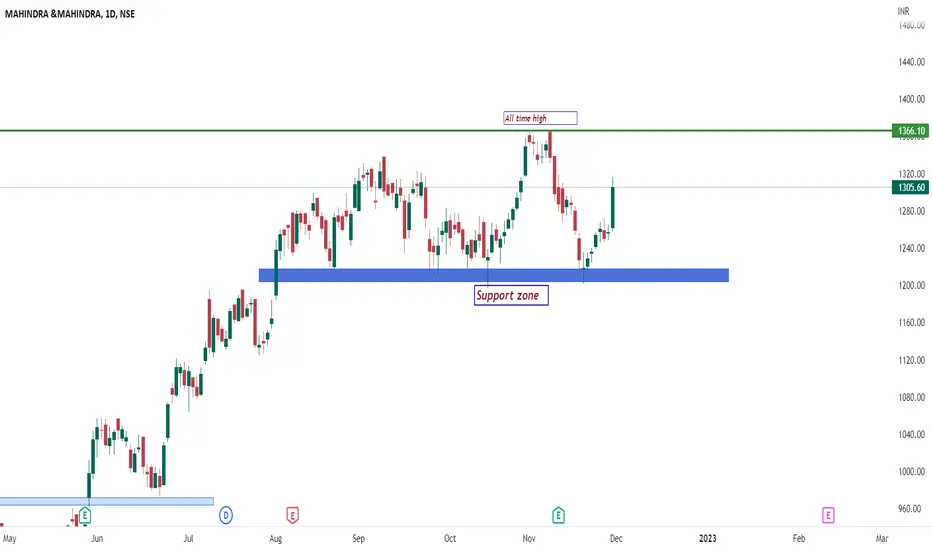
M_M near the SUPPORT LEVELWe have seen 20% correction from the All Time High level of 1397 level and now Price near the support zone of 1120 -- 1145. If price consolidate between the range of 1150--1185 and than breaks the 1185 level than we can see upmove towards the upside and target will be 1215/1250+
If price breaks the level of 1120 and closes than target will be 1080/1060+
Traders, if you liked this idea or if you have your own opinion about it, write in the comments. I will be glad.

MAHINDRA&MAHINDRAStock is uptrend and the pattren is side ways in 1h time fame its time to breake in any direction hope it is usefull...

Mahindra & Mahindra (#M_M) entered in Stage-4Mahindra & Mahindra (#M_M):
⚡️Looks like entered in Stage-4
⚡️Can go towards 1055 & 960
⚡️Strong confirmation if retest 200DMA and fails to sustain above that level.
View invalid above 1150

RSI BULLISH DIVERGENCE ON WEEKLY CHART !!!!Hello to everyone
The price perfectly fulfills my last idea. The market was trading at all time high level of 1397 and fell from all--time high price because of RSI Bearish Divergence on weekly timeframe. The price hit the target of 1228. Now the price is near the strong weekly support zone. The level of 1200--1230 is strong demand zone and there is RSI Bullish Divergence on daily timeframe. Near the support level RSI Bullish Divergence can play a crucial role for swing reversal. The price can take support at the mentioned support level and may go upside for the initial upper targets. My first initial target is 1290 & 1330- 1360.
Traders, if you liked this idea or if you have your own opinion about it, write in the comments. I will be glad.

M_M Bearish Divergence!!!The Price perfectly respecting the ascending parallel channel. Monthly chart showing 4 bar RSI Bearish Divergence as well as weekly chart also showing bearish divergence between price & its RSI momentum. Good opportunity to sell here as price also trading near all time high price.My target will be 1328---1267 & 1228 in coming day's.

Mahindra and Mahindra view for 16th FebMahindra and Mahindra view for 16th Feb
ATH breakout expectation
Please follow strict risk reward and stop loss...
Charts for Educaitonal purposes only.
Thanks,
V Trade Point

BREAKOUT Good potential if sustainable this level because m and m are looking good fundamentally as well as technically

M&MM&M-Descending triangle pattern forming. The trend will be short expected. Wait and take trade once the breakout happens on either side. Upside target will 1360 and downside upto 1100.
Disc- Only for learning purpose and not a trading recommendation

Preparing for Breakdown The scrip is getting ready for a breakdown after forming a HnS pattern on Daily TF. keep this in radar.

M&M BTST & IntradayM&M Live market analysis
Look for breakout at 1285 this level also has a pivot which is acting as a resistance
Intraday target 1300 If we break 1300 then 1315 second target
For more details refer to the image.
Comment if you have any queries.
Happy Trading !

M&M LONG TRADE (INTRADAY DEC 12)Hello TradingView community and my followers, please if you like the ideas, don't forget to support them with likes and comments, thank you very much and here we go.
.
M&M
Daily : Stock is in uptrend.
15 min : It has broken Descending triangle and IT has currently also given breakout of Descending Trendline.
*Wait for opportunity at retest level and we could see an upside movement.
THANK YOU !!!!

M&M SCALPINGMm footprint order trigger
go long with defined risk
all levels shared for educational purpose only.we are not sebi registered

Mahindra and mahindraday chart of mahindra and mahindra in which strong support zone is 1210-1220 and resistance is all time high 1366 zone
Mahindra & Mahindra - short term tradeBuy M&M @/above 1190
Intraday/Short term Target 1233
Stop Loss 1182
Profit approx. 4%

Tech mahindra (swing trade )tech mahindra likely to give breakout for up side and just wait for smart money to come and give a high probability trade

Reversal from 52 Week highM&M showing signs of trend reversal here..
Signals -
1. RSI divergence
2. Overbought
3. Bearish Engulf Candle
Targets on the right in black.
This chart is for study/educational purpose only.
Please DYOR.
I won't be liable for any P/L made by using above chart.

Will Mahindra & Mahindra keep the uptrend?In the analysis of this stock we have noticed the format of two curves from September 2018 to February 2021 and from February 2021 to October 2021.
Until this period, we have a resistance at 956, and we have a huge drop of the stock due to the COVID phase but it was consolidated.
Then from March 2022 we notice a huge bullish trend, so to verify whether this will follow or not, we drew two trend lines and we opted for the Fibonacci Extensions in order to see at what point should we exit the trend.
What we can expect is that the price will reach the line at 1308 then will drop to follow the trend line and continues the raise

M&MIf it opens below the marked area there is high probability that it will go down after retesting.
As nifty moving down!!

M&M Buy ideaStock as retraced to its Breakout zone and also is at 38.2& fib level from its last. Buy trade with SL 975. Target 1200

M&M Finance BreakoutThe stock has broken out and retested, therefore may undergo a reversal rally. Trade is supported by Supports Nearby.
Risk Reward Ratio - 2:1
SL is placed below the support zone & the lower trendline. The target is placed near resistance.