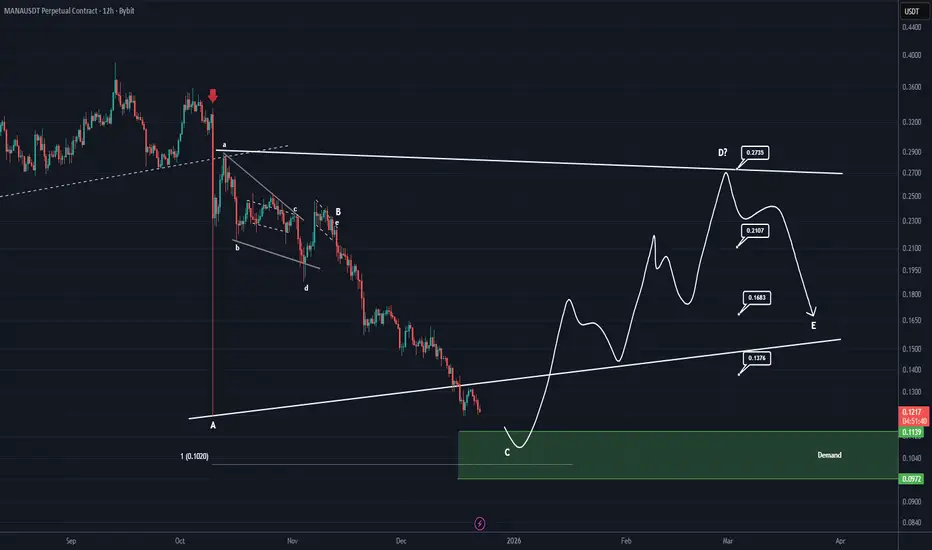
MANA Analysis (12H)The area marked with the red arrow was where the entire market crashed.
Now, in the futures market, this area has been filled with a shadow. The price can potentially rebound from below the shadow, i.e., the green box, and make a strong recovery because the scenario we’re watching is a triangle. Currently, wave C, which is a corrective wave, is coming to an end, and wave D, a bullish wave, will start soon.
The market is low-volume and weak, and market makers are easily manipulating it, so plan your entries using DCA.
Targets are marked on the chart.
For risk management, please don't forget stop loss and capital management
When we reach the first target, save some profit and then change the stop to entry
Comment if you have any questions
Thank You
MANABTC
MANA Ready for a Big Breakout! (4H)📈 MANA Price Analysis | Bullish Structure & Smart Money Perspective
The overall power and primary market direction of MANA (Decentraland) remain clearly bullish, indicating strong underlying demand and positive market sentiment. Recently, the price has experienced a sharp and aggressive corrective move, which is considered a healthy pullback within a larger bullish trend rather than a trend reversal.
It is important to note that buyers are actively waiting at two key demand zones marked on the chart. These levels represent high-probability entry areas, where institutional and smart money participants are likely to step in. Their buying pressure can act as a catalyst to push the price of MANA higher and resume the bullish momentum.
From a market structure and Smart Money Concept (SMC) perspective, we can observe multiple consecutive CH (Change of Character) and BOS (Break of Structure) formations. These signals confirm that the market structure remains bullish and that the recent correction is part of liquidity engineering, allowing the market to collect orders before the next impulsive move.
Additionally, the formation of liquidity pools below and above key levels suggests that the market is preparing for a strong upward displacement. As liquidity gets absorbed, the probability of a bullish jump (impulsive move) to the upside significantly increases.
To manage risk efficiently, two specific entry points have been identified where traders can enter the position using a DCA (Dollar Cost Averaging) strategy. This approach allows for better position management and reduces exposure to short-term volatility while aligning with the dominant bullish trend of MANA.
🎯 Profit targets are clearly marked on the chart, based on key resistance levels, liquidity zones, and previous highs. As long as the price respects the identified bullish structure, these targets remain valid.
🔍 Summary:
Asset: MANA (Decentraland)
Market Bias: Bullish
Structure: CH & BOS confirmation
Strategy: DCA entries at key demand zones
Expectation: Bullish continuation & upward impulse
Targets: Marked on the chart
If you would like us to analyze a coin or altcoin for you, first like this post, then comment the name of your altcoin below.

#MANA/USDT Forming Bullish Momentum#MANA
The price is moving within an ascending channel on the 1-hour timeframe and is adhering to it well. It is poised to break out strongly and retest the channel.
We have a downtrend line on the RSI indicator that is about to break and retest, which supports the upward move.
There is a key support zone in green at 0.1615, representing a strong support point.
We have a trend of consolidation above the 100-period moving average.
Entry price: 0.1632
First target: 0.1662
Second target: 0.1711
Third target: 0.1760
Don't forget a simple money management rule:
Place your stop-loss order below the green support zone.
Once you reach the first target, save some money and then change your stop-loss order to an entry order.
For any questions, please leave a comment.
Thank you.

MANAUSDT Forming Bullish MomentumMANAUSDT is currently displaying a strong bullish momentum pattern, indicating that buyers are gradually taking control of the market. This shift in sentiment suggests that the coin may be entering a new uptrend phase, with steady accumulation happening around key support levels. The presence of good trading volume further confirms that this momentum is backed by active participation from investors, making the current move more reliable.
Technical indicators point toward a continuation of this bullish phase, where MANA could potentially deliver a gain of around 40% to 50% in the short to medium term. Such momentum patterns often act as early signals of extended rallies, especially when supported by healthy volume. Traders are closely watching breakout zones, as once price clears resistance levels, a strong surge could follow.
Investor confidence in MANA is also growing, adding to the bullish sentiment. With the metaverse narrative still holding long-term potential, many market participants see MANA as a project with strong upside prospects. If current momentum continues, the pair could quickly test higher resistance levels and attract even more buying pressure.
✅ Show your support by hitting the like button and
✅ Leaving a comment below! (What is You opinion about this Coin)
Your feedback and engagement keep me inspired to share more insightful market analysis with you!

#MANA/USDT –> Symmetrical Triangle Breakout#MANA
The price is moving within a descending channel on the 1-hour frame, adhering well to it, and is heading for a strong breakout and retest.
We have a bearish trend on the RSI indicator that is about to be broken and retested, which supports the upward breakout.
There is a major support area in green at 0.3250, representing a strong support point.
We are heading for consolidation above the 100 moving average.
Entry price: 0.3391
First target: 0.3458
Second target: 0.3560
Third target: 0.3668
Don't forget a simple matter: capital management.
When you reach the first target, save some money and then change your stop-loss order to an entry order.
For inquiries, please leave a comment.
Thank you.

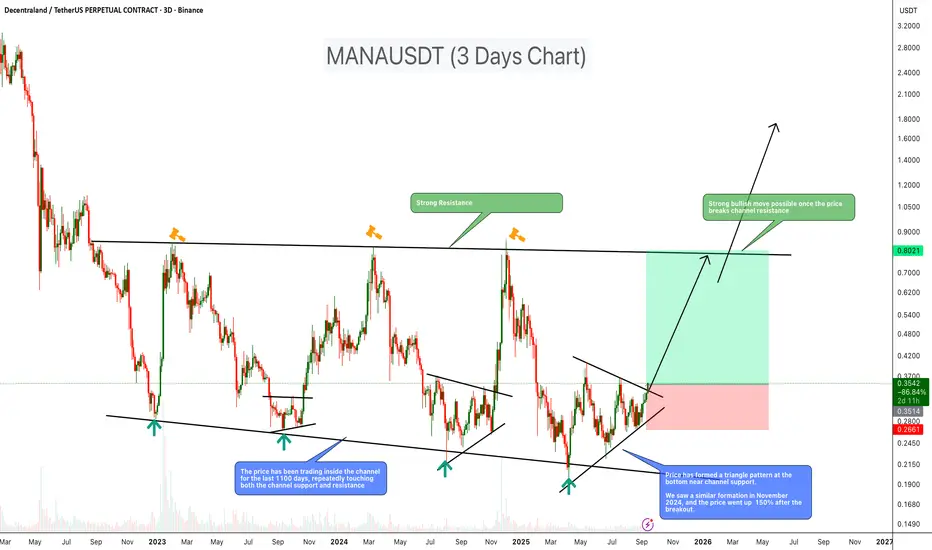
MANA About to Explode? 3-Year Channel Breakout Ahead!MANA has been consolidating inside a large descending channel for over 1100 days, consistently respecting both support and resistance levels. Recently, price formed a triangle pattern near channel support, a setup similar to Nov 2024, when MANA rallied over 150% after a breakout. This suggests a potential strong bullish move if resistance breaks.
Key Points
- Price has traded inside the channel for ~3 years
- Strong resistance around $0.80
- Triangle pattern formed near the channel bottom support
- A previous similar setup led to a sharp rally
- Breakout could open doors for a mid-term bullish trend
Trade Setup
Entry: $0.35
Stop-loss: Below $0.26
Targets:
First target: $0.75
Second target: $1.60
Cheers
Hexa
#MANA/USDT Situation, A Comprehensive Analysis !!!#MANA
The price is moving within a descending channel on the 1-hour frame, adhering well to it, and is heading for a strong breakout and retest.
We have a bearish trend on the RSI indicator that is about to be broken and retested, supporting the upside.
There is a major support area (in green) at 0.2617, which represents a strong basis for the upside.
For inquiries, please leave a comment.
We are in a consolidation trend above the 100 moving average.
Entry price: 0.2823
First target: 0.3000
Second target: 0.3133
Third target: 0.3331
Don't forget a simple matter: capital management.
When you reach the first target, save some money and then change your stop-loss order to an entry order.
For inquiries, please leave a comment.
Thank you.

MANA 1D Analysis | Key Triggers Ahead💀 Hey , how's it going ? Come over here — Satoshi got something for you !
⏰ We’re analyzing MKR on the 1-Day timeframe timeframe .
👀 On the daily timeframe of MANA, we can see that the coin is inside a compression with a triangle pattern. With the daily candle open, it is moving upward, and the reason for this is the clearing of sellers’ orders. MANA currently has a very important resistance at the $0.2995 area, which is considered a major resistance in the multi-timeframe view.
⚙️ Looking at MANA’s volatility, on the daily timeframe it is positioned above the 50 level and has a key resistance at the 54.25 area. If the oscillator crosses this level, MANA can build a higher low compared to its previous lows.
🕯 The number and size of red candles inside this triangle are much greater than the green ones, and to break out of this pattern and compression, we need more green candles in the multi-timeframe, especially on the 4-hour chart. If you zoom in on the chart, the 4-hour candles and patterns will display more clearly.
💰 On the daily timeframe of MANABTC, we can see that in the past 3 days, its trading volume and volatility have increased. A Fibonacci has been drawn from the breakout area to the corrective bottom, and with a breakout of the 0.38 Fib level, it can once again move upward.
🔔 The alert zones we have considered are the $0.274 area and the $0.3015 area. Based on price action in these zones, we can make the best trading decisions. Note that MANA has an important chart compared to Bitcoin, so be sure to check that chart as well.
❤️ Disclaimer : This analysis is purely based on my personal opinion and I only trade if the stated triggers are activated .

MANAUSDT Huge Bounce Incoming?MANA is currently testing a long-term descending support trendline on the weekly chart. This level has acted as a reliable bounce zone multiple times in the past (highlighted with arrows).
-Price is holding above a major support level (~$0.21), showing signs of demand.
-Weekly RSI is forming a bullish divergence, with higher lows on RSI vs. lower lows on price — often a precursor to trend reversals.
-Previous touches on this trendline have led to significant rallies.

MANA Roadmap (1W)From the point where we placed the red arrow on the chart, it seems that the correction of MANA has begun.
It appears to be forming an ABC pattern, where wave B is a diametric.
Currently, we seem to be at the end of wave f of B.
The price is expected to drop to the green zone, where wave C will be completed.
After wave C is completed, we anticipate a strong upward move in price.
For risk management, please don't forget stop loss and capital management
Comment if you have any questions
Thank You

Important Update on MANA (3D)First and foremost, pay attention to the timeframe. It is a 3-day timeframe and requires patience.
By analyzing the waves of MANA and considering that it has been oscillating within a range for an extended period, it can be inferred that MANA is forming a diametric or symmetrical pattern within wave B.
It appears that wave E of this diametric has concluded, and the price is currently in wave F.
The green zone is a low-risk area for buying, as wave G could start from this range.
Wave G is a bullish wave.
A daily candle closing below the invalidation level would invalidate this analysis.
For risk management, please don't forget stop loss and capital management
Comment if you have any questions
Thank You

#MANA/USDT Ready to go higher#MANA
The price is moving in a descending channel on the 1-hour frame and sticking to it well
We have a bounce from the lower limit of the descending channel, this support is at 0.5516
We have a downtrend on the RSI indicator that is about to be broken, which supports the rise
We have a trend to stabilize above the 100 moving average
Entry price 0.5593
First target 0.5732
Second target 0.5862
Third target 0.6016

Decentraland at Pivotal Level: Can Bulls Push Above $0.59? MANA/USDT (Decentraland) chart shows the price trading just below the key support zone of $0.55-$0.59.
This area is crucial for determining the next directional move, as a reclaim of this zone could trigger bullish momentum, while a failure to regain it may lead to further downside.
DYOR, NFA

MANTA Breaking Out: On Track for $10 and Beyond!OMXHEX:MANTA USDT: Long Position 🚀
MANTA is breaking out from a falling wedge pattern, a classic bullish reversal setup. The price has recently breached the key resistance trendline and is trading above the 100 MA, suggesting a strong upward momentum. If the breakout sustains, significant upside potential lies ahead as indicated in the chart.
📌 Entry Point: Current Market Price (CMP) around $0.80
📈 Additional Positions: Consider adding on retests near $0.74–$0.64 for a safer entry.
🎯 Targets:
$1.40
$1.90
$2.50
$3.20
$10.50 (Final Target)
⛔️ Stop Loss (SL): $0.64 to manage downside risk.
⚖️ Leverage Advice: Use leverage cautiously, between 2x and 5x, depending on your risk tolerance.
#Crypto

MANAUSDT Set for Channel Breakout!MANAUSDt Technical analysis update
BINANCE:MANAUSDT price has formed a descending channel on the weekly chart, which has been developing over the past 930 days. The price is now approaching the channel's resistance line, with rising volume observed in recent weeks. Additionally, the price is trading above the 100 EMA. Once the breakout is confirmed on the weekly chart, a strong bullish move can be anticipated.

Decentraland / MANA Decentraland price today is $0.58 with a 24hour trading volume of half a billion dollar. MANA price is up 96% in the last two weeks
Decentraland is a decentralized, traversable, three-dimensional, virtual reality platform being built on the Ethereum blockchain. The platform focuses on the ownership of parcels of digital land where users can create unique environments in a virtual world. Content creators will be able to prove ownership of, and capture value from, their contributions to the platform. Users will be able to traverse unique areas of content, which can be clustered into districts, giving content creators targeted traffic and allow for spatial discovery of new content by users. Currently, users gather, interact, share content, and play games primarily on large proprietary platforms like Facebook. The team believes that a decentralized model will allow participants to realize several benefits over current centralized services. Users and contributors will be able to benefit from transactions that occur on the platform, instead of allowing some or all of the revenue to flow to a single party. Furthermore, a decentralized platform will reduce the risk of censorship and vulnerabilities due to infrastructure failures or security breaches. Decentraland uses two tokens, LAND and MANA, which allow users to interact with the platform. Individual ownership of land parcels are represented by non-fungible LAND tokens containing the coordinates of a single point on the grid and a reference to the details of each parcel. Ownership details are managed through a ledger on a smart contract. To acquire LAND users must burn ERC20 based MANA tokens. MANA tokens are also used for the purchase of in-game goods and services.
Mana first big resistance is 0.9$ and 0.4-0.5 is a good dip zone. monthly MACD and RSI giving positive and buy signal too

#MANA/USDT#MANA
We have a bearish channel on a 4-hour frame, the price moves within it and adheres to its borders well at this price.
We have a higher stability moving average of 100
We have a downtrend on the RSI that is about to break higher
Entry price is 0.5858
The first target is 0.6526
The second goal is 0.7243
the third goal is 0.8046

#MANA/USDT#MANA
The price is moving in a descending channel on the 1-hour frame and is sticking to it well
We have a bounce from the lower limit of the descending channel and we are now touching this support at 0.2980
We have a downtrend on the RSI indicator that is about to be broken, which supports the rise
We have a trend to stabilize above the 100 moving average
Entry price 0.2988
First target 0.3045
Second target 0.3121
Third target 0.3200

The medium term of MANA is super bearishMedium term MANA is super bearish
According to the waves that formed in these last two months, the scenario of MANA has become clearer.
It looks like we have a big ABC, and wave B is a triangle.
The last triangle wave of wave B could end in the red range and then we could see another bearish trend for MANA in the medium term.
This is the vision we now have for MANA.
Closing a weekly candle above the invalidation level will violate the analysis
For risk management, please don't forget stop loss and capital management
Comment if you have any questions
Thank You

MANA looks bullishIt looks like we have an ABC on the chart that wave C is ending.
By maintaining the green range, it can move towards the target.
The short-term target can be the red box
Closing a daily candle below the invalidation level will violate the analysis
For risk management, please don't forget stop loss and capital management
Comment if you have any questions
Thank You

Will MANA Support hold ? Get ready for both scenariosBINANCE:MANAUSDT (1W CHART) Technical Analysis Update
MANA is currently trading at $0.331 and price is trading around its support zone, we are not sure if this support will hold and price bounce back from this support zone. We need to consider both scenario for entering the trade here, for long trade we will enter only after a green weekly candle above the support zone. For short trade we will enter if the candle closes below the support zone.
-- LONG Trade --
Entry level: Green Weekly candle above support zone
Stop Loss Level: $ 0.2526
TakeProfit 1: $ 0.4561
TakeProfit 2: $ 0.5931
TakeProfit 3: $ 0.7804
-- SHORT Trade --
Entry level: Candle close below support zone
Stop Loss Level: $ 0.3487
TakeProfit 1: $ 0.2038
TakeProfit 2: $ 0.1644
TakeProfit 3: $ 0.1198
Max Leverage: 2x
Position Size: 1% of capital
Remember to set your stop loss.
Follow our TradingView account for more technical analysis updates. | Like, share, and comment your thoughts.
Cheers
GreenCrypto

#MANA/USDT LONG#MANA
Price moves in a head and shoulders pattern
And now we're at the shoulder, where a breakout will be a strong upside support.
Current Price0.5312
First Goal 0.8300
Second goal 1.1000

Mana Long Term Setup (Also short term)Decentraland (Mana) is about to go to the clouds once more again.
Everything's set and ready;
According to Elliot Wave Theory, phase 2 on weekly time frame has ended. We are ready for Wave 3, which is the wave you'd wanna be in for.
In 3 day chart zone, RSI is strong. Also in 12H time frame as well. I checked it's on chain data as well, looks okay.
Only Buy "Spot" and Hold until the target price is hit.
No stoploss will be given.
Short Term targets: 0,8217 - 0,8860
Long Term targets (for gigachads): 0,959 - 0,1267
