MANA\USDT 📐ASCENDING TRIANGLE📐🇺🇸Hello friends👋.
📈Long: 5-10% of deposit (pending order at $1.0248)
🔴SL:0.9192$
🟢TP: 1.3302$
Another squeeze in the form of an Ascending Triangle, the price broke through the upper border of the triangle and fixed, I expect a retest and then a long!📈
MANABTC

MANABTC - Longterm IdeaI do see a possibility of a short (daily) run upwards. But this will not be the big rally. It's more a final top out and then we will go into a long consolidation phase to reach Wave 4 target zone.
But there is definitely a good chance to have afterwards in 2025 (not exactly) a huge big rally coming in for Mana again.
The big new bull market in around 2025 depends a lot when we go into a general crypto bull run again. Therefore also the weekly chart from BTC will help me to understand better the market cycles.

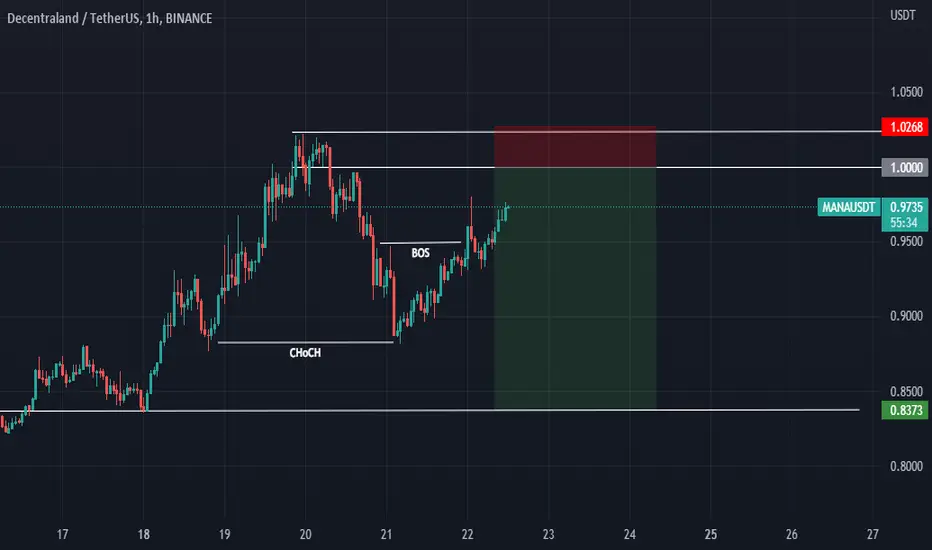
DecentralandMANA/USDT we are watching on this coin we have Order Blok on 1h TF chart which i make one Sell LIMIT on this coin for swing trade into our Demand Zone
Disclamer:
We are not financial advisors. The content that we share on this website are for educational purposes and are our own personal opinions
MANA can break the triangleMANA is one of the good projects in the metaverse which still havent pumped like the rest of the market. i think we can see a rise after succesful break of the triangle.

MANA (decentraland) printed PI CYCLE TOP : BEARISH scenarioMarket is highly uncertain right now but MANA printed PI CYCLE TOP which is a super BEARISH signal.
DMA24 is at 2.8802 and DMA50 is at 2.8945; and both these lies b/w DECISIVE candle body.
SO, ZONE to watch right now is from $2.9800 to $2.7531.
BREAK below $2.7531 lead to massive BEARISH crash which may broke $1.705 and wick can reach upto $1.1067.
MANA is a long term project but right now has to maintain above $2.98 for BULL world.
www.tradingview.com
TRADE LESS,TRADE SMART.
INDICATORS used in analysis are made by TOP LEGENDS of TRADINGVIEW.

DecentralandMANA/USDT waiting to come on Supply Zone lets see how will be this move on Decentraland
Disclamer:
We are not financial advisors. The content that we share on this website are for educational purposes and are our own personal opinions.
Comment Below


DecentralandMANA/USDT waiting for mana to make this move for one more Fake Breakout on this Zone and To SELL IT

Decentraland Next Bullish Wave MappedFor Decentraland (MANABTC), we have a higher low long-term and prices moving above EMA300 and EMA100 today.
The last barrier for MANABTC is set around 0.00004510.
Once this level is taken out we can expect strong growth (green arrow).
Closing below this level would signal additional consolidation before the next bullish wave...
Additional details on the chart.
Thank you for reading.
Namaste.

MANA$MANA breakout Descending channel pattern. in 1h timeframe valid breakout and has retesting on resistance become support line.
we can setup entry nor or wait for valid breakout and retest at 4H timeframe
Buy zone : 0.884 - 0.837 - 0.795
Target : 2.543 - 2.673 - 2.839 - 3.012 - 3.239
Stop : 0.775

MANA path to sucessHeres the short term MANA path to success.
Looking for a break overhead and then a retest.
The 1 hour ichimoku looks ranging and price action/cloud/lagging strand all intertwined.
The 4 hour ichimoku looks like price action is on the verge of breaking above the cloud.
Get 1hr price action and lagging strand above the cloud (and price action), and the 4hour breaking above = a decent rally.
Just some patience right now is need though.

MANA pump 17% How to make money on the forecast?💎🔥Subscribe to the channel, get notifications about signals!🔥
#MANA
▪️At the moment, I see upside potential of 17% to $0.98 no more, then we will fall again and be liquidated.

Decentraland (MANA) - June 20hello?
Traders, welcome.
If you "follow", you can always get new information quickly.
Please also click "Like".
Have a good day.
-------------------------------------
(MANAUSDT 1W chart)
The decline below 1.2150 can be seen as a transition to a downtrend from a long-term perspective.
Below 0.6787 is likely a mid- to long-term investment area, so careful trading is required.
(1D chart)
A move outside the 0.6787-1.2150 zone is expected to form a trend.
------------------------------------------------------------ -----------------------------------------------------
** All indicators are lagging indicators.
Therefore, it is important to be aware that the indicator moves accordingly with the movement of price and volume.
However, for convenience, we are talking in reverse for the interpretation of the indicator.
** The MRHAB-T indicator used in the chart is an indicator of our channel that has not been released yet.
** The OBV indicator was re-created by applying a formula to the DepthHouse Trading indicator, an indicator disclosed by oh92. (Thanks for this.)
** Support or resistance is based on the closing price of the 1D chart.
** All descriptions are for reference only and do not guarantee a profit or loss in investment.
(Short-term Stop Loss can be said to be a point where profit and loss can be preserved or additional entry can be made through split trading. It is a short-term investment perspective.)
---------------------------------

Decentraland (MANA) formed bearish BAT for upto 18.50% bear moveHi dear friends, hope you are well and welcome to the new trade setup of Decentraland (MANA) with BTC pair.
Recently I shared a long-term trade setup for MANA, which is still in play:
Now on a 4-hr time frame, MANA has formed a bearish BAT pattern.
Note: Above idea is for educational purpose only. It is advised to diversify and strictly follow the stop loss, and don't get stuck with trade

MANAUSDT Mana is technically worth investing in the demand area exactly 3.6 for the medium term considering the risk to Rivard.

MANA (LONG)If this coin value falls anything below $0.50 it will be a great opportunity to go long and hold. A lot of investors made some good returns in 2021, this is another chance for you as a patient holder to strengthen your portfolio.

#MANA/USDT 4HOUR UPDATE BY CRYPTOSANDERS !Hello dear traders, we here new so we ask you to support our ideas with your LIKE and COMMENT, also be free to ask any question in the comments, and we will try to answer for all, thank you, guys.
MANA breaks the resistance line and slowly moves up. Our long position is in profit of 8% increase your stop loss to breakeven price. Let's see how the price reacts to the resistance of the $1.10-$1.15 area.
Remember:-This is not a piece of financial advice. All investment made by me is at my own risk and I am held responsible for my own profit and losses. So, do your own research before investing in this trade.
Thanks for your time, we hope our work is good for you, and you are satisfied, we wish you a good day and big profits.
THANK YOU.

DecentralandMANA/USDT update im waiting for mana to take 1.0350-1.0500 and to take sell for any new update i will post another analysis

MANA/USDT BUYING SETUP (SWING)MANA rejection after hit resistance and then going back to retest support, we can see any inverted head and shoulders pattern now correction to make right shoulders IHNS
Buy zone : 0.985 - 0.95 - 0.9
Target : 1.1117 - 1.2212 - 1.3364 - 1.4709 - 1.6668
Stop : 0.88

Decentraland (MANA) formed Gartley for upto 738% big moveHi dear friends, hope you are well and welcome to the new trade setup of Decentraland (MANA).
On a monthly time frame chart, MANA has formed a huge bullish Gartley pattern.
Note: Above idea is for educational purpose only. It is advised to diversify and strictly follow the stop loss, and don't get stuck with trade

MANA/USDT BUYING SETUPMANA Look's like make a Descending triangle pattern and also any Double bottom pattern . we can see in support always make a strong rejection candle
in lower time frame potential make a IHNS pattern
Indicator like RSI and stochastic showing oversold , we can setup entry now or wait in buy zone
Buy zone : 1.017 - 0.983 - 0.945
Target : 1.0751 - 1.1073 - 1.1418 - 1.2202 - 1.33 - 1.5
Stop : 0.93

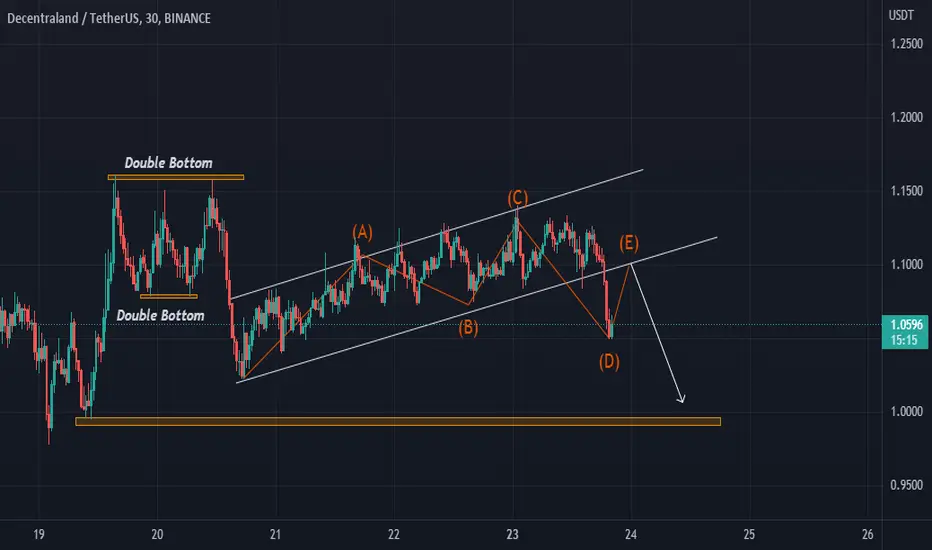
DecentralandMANA/USDT chart is on 30min making Rising Wedge Pattern im waiting for full breakout and i will take SHORT POSITION
#MANA/USDT 2HOUR UPDATE BY CRYPTOSANDERS !Hello members welcome to MANA/USDT 2hr chart update by CRYPTOSANDERS.
I have tried my best to bring the best possible outcome in this chart.
As we can see from the above-mentioned chart that MANA/USDT brack the inverse head and shoulder pattern create and broke the neckline and retested the green zone and the current scenario we are expecting that get will go up all the way to $2.50 means almost 130%.
So if it moves to the green zone again then it will be the zone to go long on MANA/USDT
entry:-$1.0732,$1.1308
target:-130%
stop-loss:-$1.0061
with leverage 5x to 10x
Sorry for my English it is not my native language.
Remember:-This is not a piece of financial advice. All investment made by me is at my own risk and I am held responsible for my own profit and losses. So, do your own research before investing in this trade.
Do hit the like button if you like it and share your charts in the comments section.
Thank you.
