Mana is looking to recover a bit (8H)Mana is approaching a key origin of movement, a zone that previously delivered a significant impulsive move, which we have clearly identified and labeled with a BOS (Break of Structure). This highlights the importance of this area from a market structure perspective.
Additionally, there is a major key level in this region that aligns and overlaps with the movement origin, adding further confluence and increasing the probability of a reaction from this zone.
It is important to note that the recent bearish move has retraced the entire previous bullish leg in a much shorter time, which signals strong bearish pressure. Because of this, risk management is critical. From this area, we are primarily looking for a bullish reaction or corrective bounce, rather than immediately expecting a full trend reversal.
We have identified two entry zones, and positions should be built using a DCA (Dollar-Cost Averaging) approach to reduce risk and improve average entry price.
There are two upside targets defined. At Target 1, it is recommended to move the position to break even and secure partial profits. The remaining position can be held toward the higher target as long as structure remains valid.
⚠️ Invalidation:
A daily candle close below the invalidation level will invalidate this bullish scenario and indicate that further downside is likely.
If you have a coin or altcoin you want analyzed, first hit the like button and then comment its name so I can review it for you.
This is not a trade setup, as it has no precise stop-loss, stop, or target. I do not publish my trade setups here.
MANAUSDT

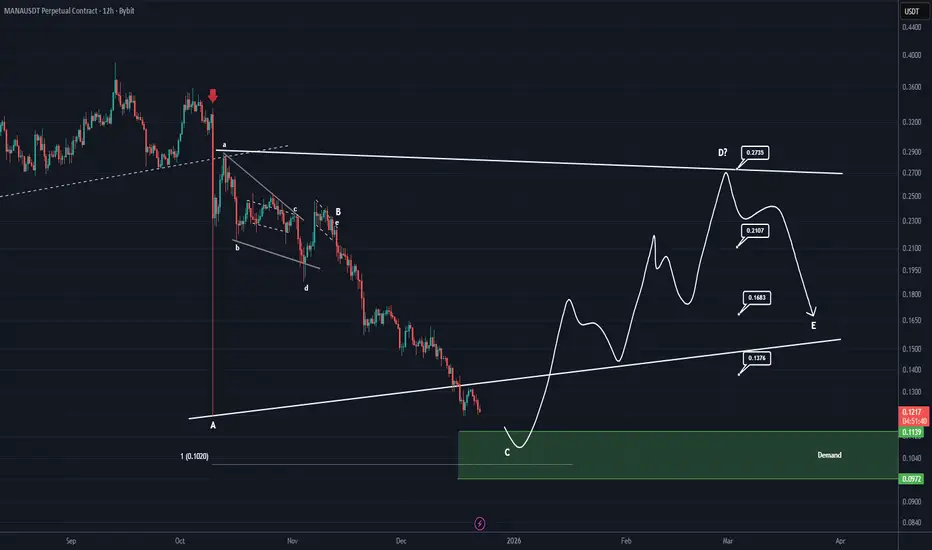
MANA Analysis (12H)The area marked with the red arrow was where the entire market crashed.
Now, in the futures market, this area has been filled with a shadow. The price can potentially rebound from below the shadow, i.e., the green box, and make a strong recovery because the scenario we’re watching is a triangle. Currently, wave C, which is a corrective wave, is coming to an end, and wave D, a bullish wave, will start soon.
The market is low-volume and weak, and market makers are easily manipulating it, so plan your entries using DCA.
Targets are marked on the chart.
For risk management, please don't forget stop loss and capital management
When we reach the first target, save some profit and then change the stop to entry
Comment if you have any questions
Thank You
MANA Ready for a Big Breakout! (4H)📈 MANA Price Analysis | Bullish Structure & Smart Money Perspective
The overall power and primary market direction of MANA (Decentraland) remain clearly bullish, indicating strong underlying demand and positive market sentiment. Recently, the price has experienced a sharp and aggressive corrective move, which is considered a healthy pullback within a larger bullish trend rather than a trend reversal.
It is important to note that buyers are actively waiting at two key demand zones marked on the chart. These levels represent high-probability entry areas, where institutional and smart money participants are likely to step in. Their buying pressure can act as a catalyst to push the price of MANA higher and resume the bullish momentum.
From a market structure and Smart Money Concept (SMC) perspective, we can observe multiple consecutive CH (Change of Character) and BOS (Break of Structure) formations. These signals confirm that the market structure remains bullish and that the recent correction is part of liquidity engineering, allowing the market to collect orders before the next impulsive move.
Additionally, the formation of liquidity pools below and above key levels suggests that the market is preparing for a strong upward displacement. As liquidity gets absorbed, the probability of a bullish jump (impulsive move) to the upside significantly increases.
To manage risk efficiently, two specific entry points have been identified where traders can enter the position using a DCA (Dollar Cost Averaging) strategy. This approach allows for better position management and reduces exposure to short-term volatility while aligning with the dominant bullish trend of MANA.
🎯 Profit targets are clearly marked on the chart, based on key resistance levels, liquidity zones, and previous highs. As long as the price respects the identified bullish structure, these targets remain valid.
🔍 Summary:
Asset: MANA (Decentraland)
Market Bias: Bullish
Structure: CH & BOS confirmation
Strategy: DCA entries at key demand zones
Expectation: Bullish continuation & upward impulse
Targets: Marked on the chart
If you would like us to analyze a coin or altcoin for you, first like this post, then comment the name of your altcoin below.

AXS OutlookGiven the current market conditions, I think AXS could move above $2 at any time with a single move.

#MANA/USDT Forming Bullish Momentum#MANA
The price is moving within an ascending channel on the 1-hour timeframe and is adhering to it well. It is poised to break out strongly and retest the channel.
We have a downtrend line on the RSI indicator that is about to break and retest, which supports the upward move.
There is a key support zone in green at 0.1615, representing a strong support point.
We have a trend of consolidation above the 100-period moving average.
Entry price: 0.1632
First target: 0.1662
Second target: 0.1711
Third target: 0.1760
Don't forget a simple money management rule:
Place your stop-loss order below the green support zone.
Once you reach the first target, save some money and then change your stop-loss order to an entry order.
For any questions, please leave a comment.
Thank you.

MANA/USDT — Demand Zone: Major Rebound or Breakdown?MANA is approaching one of the most important price zones in its entire history.
The yellow block at 0.095–0.07 isn’t just a support — it’s the origin demand, the very place where the 2021 macro bull run began.
Now, after years of decline, price is returning to this area.
The question is simple:
Does this zone still hold enough buyers… or will it become the doorway to new lows?
---
🎯 Key Chart Highlights
Weekly structure remains bearish, forming consistent lower highs and lower lows since 2022.
A massive liquidity sweep (wick into ~0.03) hints at institutional stop-hunting before recovering.
Price is now sliding back toward 0.095–0.07, a major historical accumulation base.
Below this zone, the next strong support is only around 0.03.
In other words: this is a multi-year decision point.
---
📌 Bullish Scenario — “Rebound From the Birthplace of the Last Bull Run”
If price taps the 0.095–0.07 zone and:
forms a weekly bullish engulfing,
prints a higher low,
or shows strong buy-side volume…
then MANA may enter a new accumulation phase, similar to early 2021.
Potential upside targets:
0.20 (local resistance)
0.35 (major supply zone)
0.60–1.00 if the broader crypto market turns bullish
This makes the zone a prime area for long-term accumulation.
---
📌 Bearish Scenario — “If the Historical Support Collapses”
If weekly closes below 0.07, then:
MANA forms a new macro lower low,
downtrend continues aggressively,
next strong support sits at 0.03.
A breakdown here typically triggers:
panic selling,
cascading stop losses,
strong short pressure,
accelerated downward momentum.
This is the scenario long holders must watch closely.
---
📌 Major Pattern Insight
Macro Downtrend since 2022
Liquidity Grab Wick showing smart-money activity
Retest of Origin Demand where the last bull cycle started
---
📣 Conclusion
MANA is standing at a multi-year crossroads.
The 0.095–0.07 zone isn’t just technical—it’s psychological.
It represents the thin line between a major reversal and a deeper breakdown.
Aggressive traders see it as a potential accumulation zone,
while conservative traders will wait for weekly confirmation.
Whatever happens next,
the next major move will likely begin right here.
#MANA #Decentraland #CryptoAnalysis #Altcoins
#DemandZone #SupportZone #PriceAction
#TechnicalAnalysis #CryptoMarket #AltcoinOutlook
Bloktopia OutlookNobody is talking about #BLOK, so it's the best time to rise. It's like #SAND and #MANA when nobody knew them. 700X possible!

Decentraland (mana) Decentraland token
Mana usdt daily analysis
Time frame 4hours
Risk rewards ratio >3 👈👌
Target
Mana has unacceptable behaviour in crypto market and couldn't break it's resistance line for months.
I don't like this token but I guess here is a good place to open a position and take a good benefit
MANAUSDT Forming Bullish MomentumMANAUSDT is currently displaying a strong bullish momentum pattern, indicating that buyers are gradually taking control of the market. This shift in sentiment suggests that the coin may be entering a new uptrend phase, with steady accumulation happening around key support levels. The presence of good trading volume further confirms that this momentum is backed by active participation from investors, making the current move more reliable.
Technical indicators point toward a continuation of this bullish phase, where MANA could potentially deliver a gain of around 40% to 50% in the short to medium term. Such momentum patterns often act as early signals of extended rallies, especially when supported by healthy volume. Traders are closely watching breakout zones, as once price clears resistance levels, a strong surge could follow.
Investor confidence in MANA is also growing, adding to the bullish sentiment. With the metaverse narrative still holding long-term potential, many market participants see MANA as a project with strong upside prospects. If current momentum continues, the pair could quickly test higher resistance levels and attract even more buying pressure.
✅ Show your support by hitting the like button and
✅ Leaving a comment below! (What is You opinion about this Coin)
Your feedback and engagement keep me inspired to share more insightful market analysis with you!

MANA is Ready for 120 % Up Move MANA is making a Triangle pattern at Support zone and It is Ready for Breakout from that pattern . and at the same time Altcoin Season Index is at 74 , when it is >75 it is sign of very bullish in altcoins and Breakouts will have very high potential to give a big move .
and at the same time Bitcoin dominance is decreasing and altcoins dominance is started increasing , so look on all the altcoins
and follow proper risk management , it has very good chances to move UP side but first we have to protect the down side , where risk management comes into game .
Follow for more Ideas and potential coins/ Stocks .

#MANA/USDT –> Symmetrical Triangle Breakout#MANA
The price is moving within a descending channel on the 1-hour frame, adhering well to it, and is heading for a strong breakout and retest.
We have a bearish trend on the RSI indicator that is about to be broken and retested, which supports the upward breakout.
There is a major support area in green at 0.3250, representing a strong support point.
We are heading for consolidation above the 100 moving average.
Entry price: 0.3391
First target: 0.3458
Second target: 0.3560
Third target: 0.3668
Don't forget a simple matter: capital management.
When you reach the first target, save some money and then change your stop-loss order to an entry order.
For inquiries, please leave a comment.
Thank you.

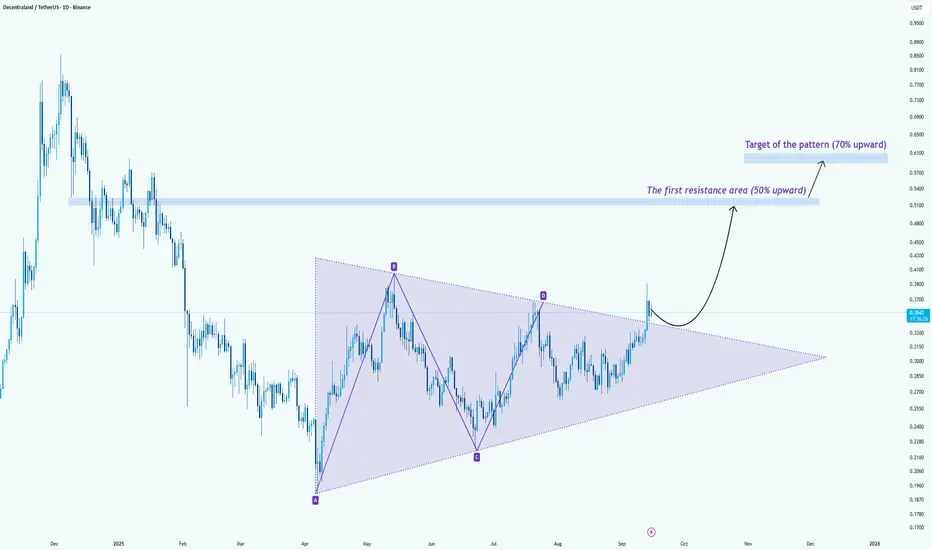
MANA/USDT –> Symmetrical Triangle BreakoutHello guys!
MANA has been consolidating inside a large symmetrical triangle for months, and now it looks like the price is finally breaking out to the upside. This could be the beginning of a strong bullish leg.
Key Points:
The breakout happened with solid momentum, confirming bulls are stepping back in.
The first resistance level is expected to be around $0.50–$0.52, which represents a roughly 50% increase from current levels.
If the price clears that zone, the measured move of the pattern points toward $0.60–$0.62, approximately 70% higher than the breakout.
Bullish Scenario:
As long as the price stays above the breakout level (~$0.26–$0.24), the bias remains bullish. Buyers could look for continuation toward the targets mentioned.
💥 Invalidation:
A drop back inside the triangle below $0.24 would invalidate the breakout and put the bullish setup at risk.
Conclusion:
MANA has finally broken out of its long consolidation. If momentum holds, there’s room for a 50–70% rally in the coming weeks.
MANA Eyes 0.75 After Strong Bounce$MANA/USDT is bouncing from a strong confluence zone, where the support area lines up with the rising trendline. This reaction shows buyers are stepping in to defend the structure.
If momentum continues, price has room to push higher toward the 0.75 level and possibly beyond, as long as it holds above support.
In simple terms: the confluence bounce is a bullish signal, and upside targets remain in play if momentum stays intact.
DYOR, NFA
#PEACE
Stay tuned for more update - follow us on Trading View

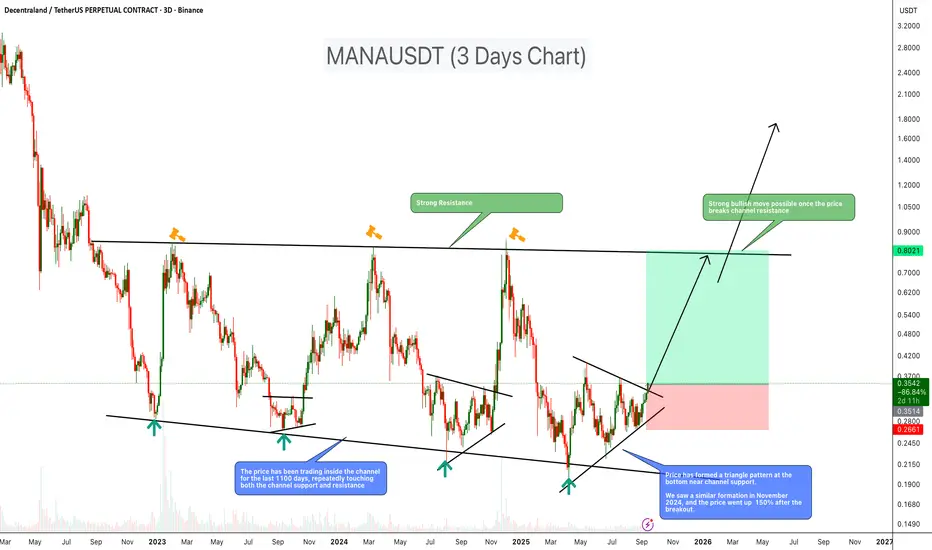
MANA About to Explode? 3-Year Channel Breakout Ahead!MANA has been consolidating inside a large descending channel for over 1100 days, consistently respecting both support and resistance levels. Recently, price formed a triangle pattern near channel support, a setup similar to Nov 2024, when MANA rallied over 150% after a breakout. This suggests a potential strong bullish move if resistance breaks.
Key Points
- Price has traded inside the channel for ~3 years
- Strong resistance around $0.80
- Triangle pattern formed near the channel bottom support
- A previous similar setup led to a sharp rally
- Breakout could open doors for a mid-term bullish trend
Trade Setup
Entry: $0.35
Stop-loss: Below $0.26
Targets:
First target: $0.75
Second target: $1.60
Cheers
Hexa
#MANA/USDT Situation, A Comprehensive Analysis !!!#MANA
The price is moving within a descending channel on the 1-hour frame, adhering well to it, and is heading for a strong breakout and retest.
We have a bearish trend on the RSI indicator that is about to be broken and retested, supporting the upside.
There is a major support area (in green) at 0.2617, which represents a strong basis for the upside.
For inquiries, please leave a comment.
We are in a consolidation trend above the 100 moving average.
Entry price: 0.2823
First target: 0.3000
Second target: 0.3133
Third target: 0.3331
Don't forget a simple matter: capital management.
When you reach the first target, save some money and then change your stop-loss order to an entry order.
For inquiries, please leave a comment.
Thank you.

MANA (SPOT)BINANCE:MANAUSDT
#MANA / USDT
Entry range (0.2770- 0.3200)
SL 1D close below 0.2670
T1 0.42
T2 0.55
T1 0.72
T2 1.00
Extra Target is optional 1.30
_______________________________________________________
Golden Advices.
********************
* collect the coin slowly in the entry range.
* Please calculate your losses before the entry.
* Do not enter any trade you find it not suitable for you.
* No FOMO - No Rush , it is a long journey.

MANAUSDT UPDATE#MANA
UPDATE
MANA Technical Setup
Pattern : Bullish Falling Wedge Pattern
Current Price: $0.3139
Target Price: $0.63
Target % Gain: 105.71%
Technical Analysis: MANA has broken out of a long-term falling wedge on the 1D chart, signaling strong bullish reversal potential. Price action shows breakout confirmation, and momentum suggests buyers stepping in for a move toward $0.63.
Time Frame: 1D
Risk Management Tip: Always use proper risk management.

MANA 1D Analysis | Key Triggers Ahead💀 Hey , how's it going ? Come over here — Satoshi got something for you !
⏰ We’re analyzing MKR on the 1-Day timeframe timeframe .
👀 On the daily timeframe of MANA, we can see that the coin is inside a compression with a triangle pattern. With the daily candle open, it is moving upward, and the reason for this is the clearing of sellers’ orders. MANA currently has a very important resistance at the $0.2995 area, which is considered a major resistance in the multi-timeframe view.
⚙️ Looking at MANA’s volatility, on the daily timeframe it is positioned above the 50 level and has a key resistance at the 54.25 area. If the oscillator crosses this level, MANA can build a higher low compared to its previous lows.
🕯 The number and size of red candles inside this triangle are much greater than the green ones, and to break out of this pattern and compression, we need more green candles in the multi-timeframe, especially on the 4-hour chart. If you zoom in on the chart, the 4-hour candles and patterns will display more clearly.
💰 On the daily timeframe of MANABTC, we can see that in the past 3 days, its trading volume and volatility have increased. A Fibonacci has been drawn from the breakout area to the corrective bottom, and with a breakout of the 0.38 Fib level, it can once again move upward.
🔔 The alert zones we have considered are the $0.274 area and the $0.3015 area. Based on price action in these zones, we can make the best trading decisions. Note that MANA has an important chart compared to Bitcoin, so be sure to check that chart as well.
❤️ Disclaimer : This analysis is purely based on my personal opinion and I only trade if the stated triggers are activated .

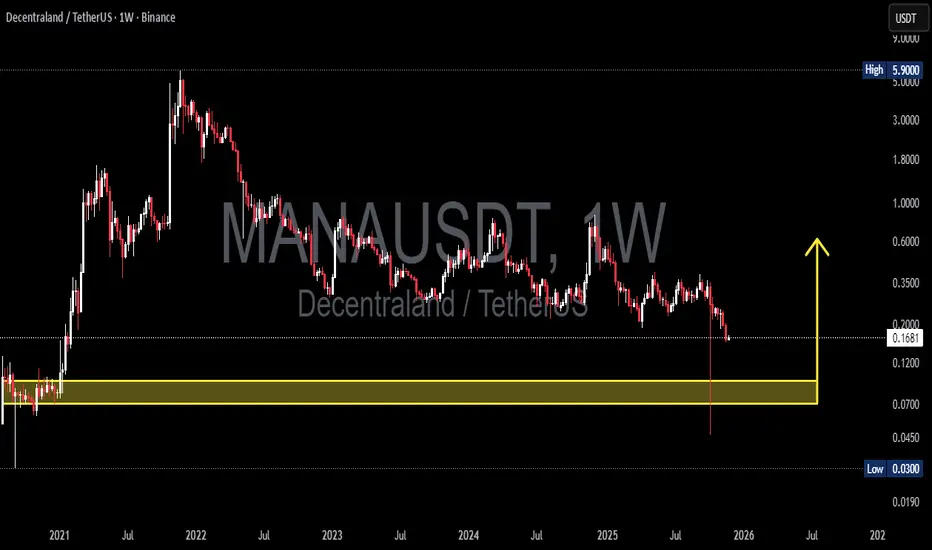
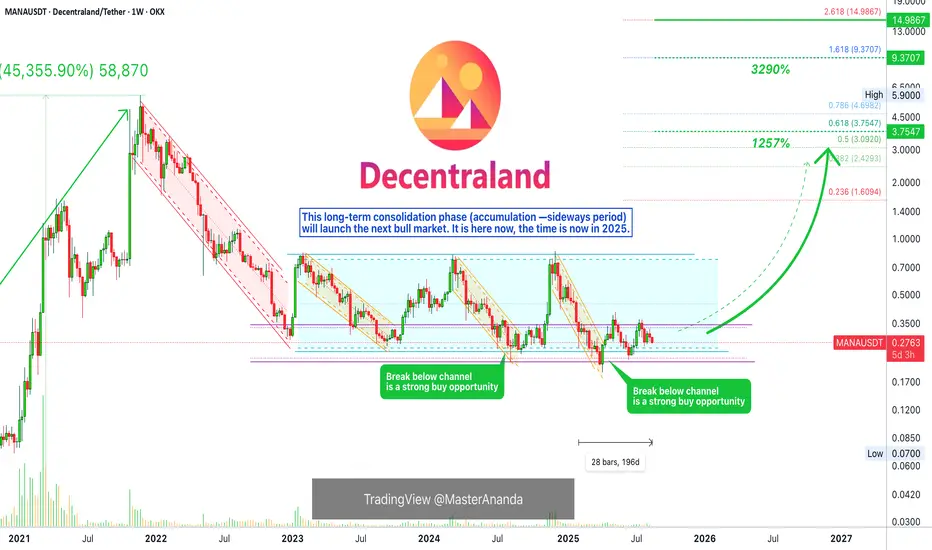
Decentraland · Hold Long-Term & Open 3,000% Profits PotentialYou will agree with me. Decentraland (MANA) is trading within a wide, long-term, sideways accumulation channel—this is the one light blue on the chart. And the action is happening right at the lower end of the channel, near support. This is great, let's get deep into the analysis.
The same support zone where MANAUSDT is trading now in 2025 was activated in 2024. The exact same range, say between 0.2222 and 0.3333—marked with purple lines.
This level was activated in December 2022 and it caused prices to jump. It was a small jump but please bear with me.
Then again between August and October 2023 MANAUSDT consolidated in this range and what followed was a bullish breakout.
Then again in 2024. August—notice the same month. Between July and November 2024 MANA entered the "opportunity buy zone" and responded with a bullish jump.
The zone has been activated again in 2025 since February. This support zone has been active for 196 days. This is the longest stretch ever. This means that the bull market that follows will have strong support, years of consolidation.
We know Decentraland is trading at bottom prices but in a range that tends to support bullish action. We know there is no bearish trend and volume is flat. The market will soon change.
MANAUSDT has strong bullish potential. This is a good hold long-term.
Namaste.
ManaDecentraland token
Mana usdt Daily analysis
Time frame daily
Risk rewards ratio =2 👈👌
Target = 0439 $
0.44$ - 0.46$ is strong resistance for mana
If price can break this resistance it will go to 0.6$

MANA/USDT Rebounding from Key Weekly Demand Zone – Path to $1?🔶 Strong Support Zone (Demand Zone):
MANA/USDT is currently testing a major weekly support area between $0.20 – $0.30, a zone that has historically acted as a strong demand level since 2021. Price has bounced off this region multiple times, indicating strong buyer interest and potential for a bullish reversal.
🔶 Chart Pattern:
There is no classic pattern like a double bottom or head & shoulders, but price structure shows signs of horizontal accumulation, which resembles a Wyckoff re-accumulation phase—a typical base formation before a strong upside breakout.
🚀 Bullish Scenario:
If the price holds above the $0.25 support and forms a higher low, a bullish continuation is likely. The following resistance levels could serve as potential upside targets:
1. $0.3610 – Initial resistance and confirmation level.
2. $0.5475 – Intermediate psychological level.
3. $0.8109 – Former supply zone.
4. $1.0661 – Major resistance from 2022.
5. $2.7291 – $5.0666 – Long-term targets if macro bull trend resumes.
> Bullish Confirmation: A strong weekly candle close above $0.36 with high volume could spark a major rally.
🔻 Bearish Scenario:
If price breaks down below $0.25 and closes below it on the weekly timeframe, it would invalidate the bullish structure and may trigger further downside towards:
$0.13 – $0.07, the historical lows seen in early 2021.
> Bearish Confirmation: A weekly close below $0.25 with increasing volume would suggest sellers are back in control.
🧠 Conclusion:
MANA/USDT is at a pivotal point within a long-standing support zone. Holding this level could result in a strong upward move, but a breakdown would indicate further bearish pressure. Traders should watch this zone closely for confirmation in either direction.
#MANAUSDT #Decentraland #CryptoTrading #TechnicalAnalysis #AltcoinAnalysis #BullishSetup #SupportZone #TradingView #MetaverseCrypto #CryptoBreakout

MANAUSDT 1W AnalysisMANA ~ 1W Analysis
#MANA Buy back gradually from this support block with a short term target of at least 20%+ from this support.

MANAUSDT 1D AnalysisMANA ~ 1D Analysis
#MANA Buy gradually from here if you still have confidence in this coin with a short term target of at least 15%++ from here.
