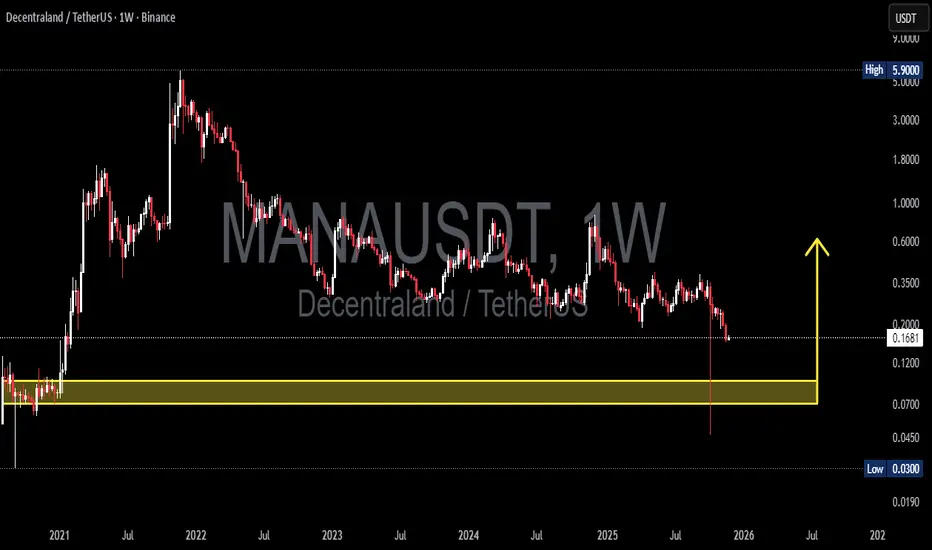
MANA/USDT — Demand Zone: Major Rebound or Breakdown?MANA is approaching one of the most important price zones in its entire history.
The yellow block at 0.095–0.07 isn’t just a support — it’s the origin demand, the very place where the 2021 macro bull run began.
Now, after years of decline, price is returning to this area.
The question is simple:
Does this zone still hold enough buyers… or will it become the doorway to new lows?
---
🎯 Key Chart Highlights
Weekly structure remains bearish, forming consistent lower highs and lower lows since 2022.
A massive liquidity sweep (wick into ~0.03) hints at institutional stop-hunting before recovering.
Price is now sliding back toward 0.095–0.07, a major historical accumulation base.
Below this zone, the next strong support is only around 0.03.
In other words: this is a multi-year decision point.
---
📌 Bullish Scenario — “Rebound From the Birthplace of the Last Bull Run”
If price taps the 0.095–0.07 zone and:
forms a weekly bullish engulfing,
prints a higher low,
or shows strong buy-side volume…
then MANA may enter a new accumulation phase, similar to early 2021.
Potential upside targets:
0.20 (local resistance)
0.35 (major supply zone)
0.60–1.00 if the broader crypto market turns bullish
This makes the zone a prime area for long-term accumulation.
---
📌 Bearish Scenario — “If the Historical Support Collapses”
If weekly closes below 0.07, then:
MANA forms a new macro lower low,
downtrend continues aggressively,
next strong support sits at 0.03.
A breakdown here typically triggers:
panic selling,
cascading stop losses,
strong short pressure,
accelerated downward momentum.
This is the scenario long holders must watch closely.
---
📌 Major Pattern Insight
Macro Downtrend since 2022
Liquidity Grab Wick showing smart-money activity
Retest of Origin Demand where the last bull cycle started
---
📣 Conclusion
MANA is standing at a multi-year crossroads.
The 0.095–0.07 zone isn’t just technical—it’s psychological.
It represents the thin line between a major reversal and a deeper breakdown.
Aggressive traders see it as a potential accumulation zone,
while conservative traders will wait for weekly confirmation.
Whatever happens next,
the next major move will likely begin right here.
#MANA #Decentraland #CryptoAnalysis #Altcoins
#DemandZone #SupportZone #PriceAction
#TechnicalAnalysis #CryptoMarket #AltcoinOutlook
Manausdtanalysis
MANA/USDT Rebounding from Key Weekly Demand Zone – Path to $1?🔶 Strong Support Zone (Demand Zone):
MANA/USDT is currently testing a major weekly support area between $0.20 – $0.30, a zone that has historically acted as a strong demand level since 2021. Price has bounced off this region multiple times, indicating strong buyer interest and potential for a bullish reversal.
🔶 Chart Pattern:
There is no classic pattern like a double bottom or head & shoulders, but price structure shows signs of horizontal accumulation, which resembles a Wyckoff re-accumulation phase—a typical base formation before a strong upside breakout.
🚀 Bullish Scenario:
If the price holds above the $0.25 support and forms a higher low, a bullish continuation is likely. The following resistance levels could serve as potential upside targets:
1. $0.3610 – Initial resistance and confirmation level.
2. $0.5475 – Intermediate psychological level.
3. $0.8109 – Former supply zone.
4. $1.0661 – Major resistance from 2022.
5. $2.7291 – $5.0666 – Long-term targets if macro bull trend resumes.
> Bullish Confirmation: A strong weekly candle close above $0.36 with high volume could spark a major rally.
🔻 Bearish Scenario:
If price breaks down below $0.25 and closes below it on the weekly timeframe, it would invalidate the bullish structure and may trigger further downside towards:
$0.13 – $0.07, the historical lows seen in early 2021.
> Bearish Confirmation: A weekly close below $0.25 with increasing volume would suggest sellers are back in control.
🧠 Conclusion:
MANA/USDT is at a pivotal point within a long-standing support zone. Holding this level could result in a strong upward move, but a breakdown would indicate further bearish pressure. Traders should watch this zone closely for confirmation in either direction.
#MANAUSDT #Decentraland #CryptoTrading #TechnicalAnalysis #AltcoinAnalysis #BullishSetup #SupportZone #TradingView #MetaverseCrypto #CryptoBreakout

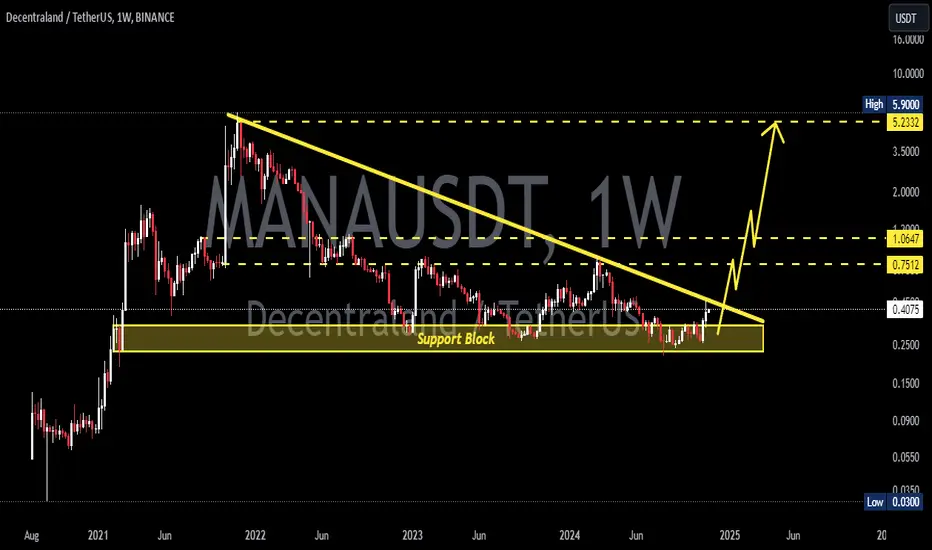
MANAUSDT 1W AnalysisMANA ~ 1W Analysis
#MANA Buy back gradually from this support block with a short term target of at least 20%+ from this support.

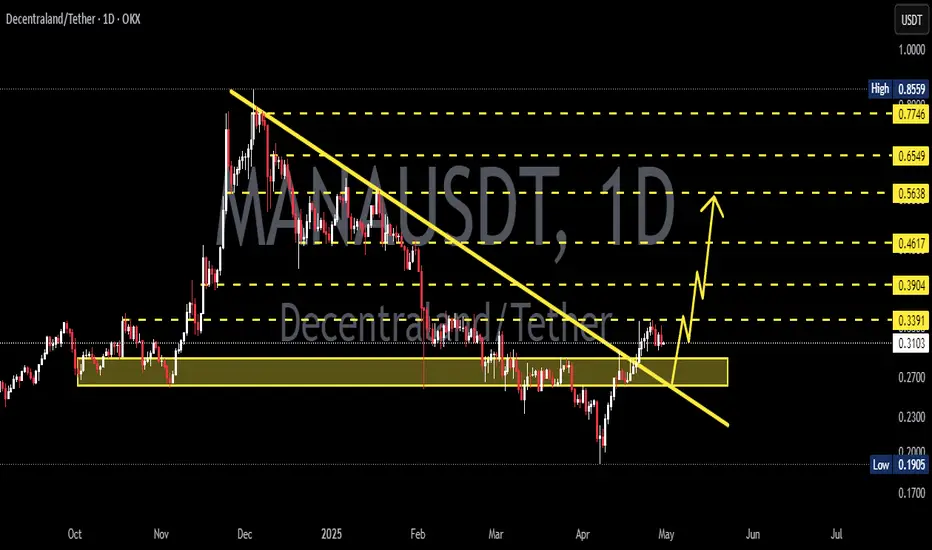
MANAUSDT 1D AnalysisMANA ~ 1D Analysis
#MANA Buy gradually from here if you still have confidence in this coin with a short term target of at least 15%++ from here.

MANAUSDT 1D AnalysisMANA ~ 1D Analysis
#MANA Buy gradually when re -testing this support with a short -term target of at least 15%+ from here.
MANAUSDT 1WMANA ~ 1W Analysis
#MANA Buy gradually from here if you still have a Conviction on this coin with a short -term target of at least 20%+.

MANA Accumulating – Ready for a Pump?$MANA/USDT weekly chart shows the price moving within a sideways accumulation zone, respecting a rising support line after a prolonged downtrend.
It is currently testing the 50 EMA, which acts as a key resistance level. A breakout above this could signal further upside, while failure to hold could lead to a retest of the support zone.
The Stoch RSI is in the oversold region, suggesting potential bullish momentum. If MANA breaks above 0.35 USDT, it could push towards 0.70 USDT+, while a drop below 0.20 USDT might extend the bearish trend.
DYOR, NFA
Do Likes and follow us

MANAUSDT 1WMANA ~ 1W Analysis
#MANA If you still have a Conviction on this coin,. This is a very good support for now. buy gradually with a minimum target of 20%+

MANAUSDT 1WMANA Update ~ 1W
#MANA At Time frame 1W,. EURONEXT:MANA rejected by this local resistance. The best way for now. You can buy back when this resistance line is retested or you can place another purchase on this support block.
these two scenarios with a target of 20%++

MANAUSDT 1WMANA ~ 1W
#MANA This chart is very interesting,. It is very bullish if this resistance line is successfully broken. if you still have Conviction on this coin. Buy in stages starting from here. minimum target 20%++
MANAUSD 1WMANA ~ 1W
#MANA This is an important support block that we are looking at.
Maybe a few small purchases are very interesting here, with a target of at least 20%++

MANA/USDT It required Breakout for Continue the upward Move!💎 MANA has indeed made its mark in the cryptocurrency market with significant market dynamics. Currently, MANA is facing resistance at the supply area.
💎 If MANA successfully breaks out above this area with a confirmed daily candle close, it can probability continue its upward movement and reach our target area.
💎 However, if MANA fails to break out above the supply area, there is a potential for the price to be rejected and gradually move downward towards the demand area around 0.574 to establish a new momentum.
💎 At the demand area, it is crucial for MANA to bounce decisively to attempt another breakout above the supply area. Failure to hold the support could indicate a bearish reversal, leading MANA back to downward movement, potentially reaching lower levels.

MANA/USDT Could MANA break the pattern or going to retest ??💎 MANA has recently witnessed significant developments in the market. Currently, MANA appears to be on a downward trajectory, heading towards the demand area. There is potential for a significant bounce once it reaches the demand area.
💎 However, if MANA aims to reverse its course and move upward without retesting the demand area, it faces a challenging task, as it would need to break the existing pattern.
💎 The target for an upward movement could be the strong resistance area, but achieving this probability would require a breakout to reach our goal at the Bearish OB.
💎 On the other hand, if MANA retraces to the demand area during a retesting phase and fails to sustain itself there, resulting in a breakdown of the demand zone, this would be a bearish signal. It could trigger a continued downward movement, potentially returning to the strong support area.

MANA/USDT Could MANA Breakout the crucial area ?? Or rejected💎 MANA has been a prominent player in the market, facing challenges in overcoming the supply area. Recently, MANA experienced a false breakout and is currently striving to regain its position above the supply level. A successful breach of this resistance could probability lead to a significant upward trend, with the bearish OB area being the next anticipated target.
💎 However, if MANA fails to achieve a breakout and remains in consolidation at this resistance level over the next few days, there's a likelihood of facing another rejection. This could result in MANA reversing its course back towards the demand area.
💎 In the demand zone, a strong response is essential for MANA. If it fails to demonstrate a significant rebound from this zone, there's a risk of breaking down further. Such a scenario could signal a shift back to a bearish trend for MANA, potentially leading to a descent towards a stronger support area.

Be careful crossing the bridge!The probability of growth for this currency is higher, but it is possible to have a correction to the first support range.
If the first support range is lost, the most important support range is the price of 0.4646, the possibility of growth from this range can be higher, but if this range is broken, this pattern, i.e. the corner pattern, will be formed and we can see more fall.
Therefore, if it reaches the second support range, the analysis should be updated.
But what is possible for now is a rise to the first resistance area, which is the price of 0.5498

MANAUSDT Elliott Waves AnalysisHello friends.
Please support my work by clicking the LIKE button👍(If you liked). Also i will appreciate for ur activity. Thank you!
Everything on the chart.
Targets: 0.5 - 0.53 - 0.57
after first target reached move ur stop to breakeven
Stop: ~0.33 (depending of ur risk). ALWAYS follow ur RM .
RR: 1 to 3
risk is justified
Good luck everyone!
Follow me on TRADINGView, if you don't want to miss my next analysis or signals.
It's not financial advice.
Dont Forget, always make your own research before to trade my ideas!
Open to any questions and suggestions

MANAUSDT Elliott Waves Analysis (LONGTERM)Hello friends.
Please support my work by clicking the LIKE button👍(If you liked). Also i will appreciate for ur activity. Thank you!
Everything on the chart.
Entry zone: 0.25 - 0.2
Targets: 0.35 - 0.55 - 0.85
after first target reached move ur stop to breakeven
Stop: (depending of ur risk). ALWAYS follow ur RM .
risk is justified
Good luck everyone!
Follow me on TRADINGView, if you don't want to miss my next analysis or signals.
It's not financial advice.
Dont Forget, always make your own research before to trade my ideas!
Open to any questions and suggestions

MANAUSDT"Daily crypto market analyses I provide are personal opinions & not financial advice. Trading carries risks, so do your own research & seek advisor's help."
Don't forget to like and comment

MANA one of the very promising OpportunityHi Everyone;
today we have one of the best risk to reward Investment opportunity
it is more than 890 times the risk and the chart is look very promising.
I expect breaking the previous bear market key point will clear the way to the final target

MANAUSDT Elliott Waves AnalysisHello friends.
Please support my work by clicking the LIKE button👍(If you liked). Also i will appreciate for ur activity. Thank you!
Everything on the chart.
Entry: market and lower
Targets: 0.7 - 0.9 - ~1.05
after first target reached move ur stop to breakeven
Stop: (depending of ur risk). ALWAYS follow ur RM .
risk is justified
Good luck everyone!
Follow me on TRADINGView, if you don't want to miss my next analysis or signals.
It's not financial advice.
Dont Forget, always make your own research before to trade my ideas!
Open to any questions and suggestions.

MANA Big move coming! (Long entry setup)Mana has strongly changed character from a key point, I expect a minor pullback validating the change of character and a move up from here!
NFA

MANAUSDT Daily: 25/03/2023: Bull or what?
It's a good probability of growth from here or after testing the lower time frame demand zone.
You can see the liquidity pool above 0.6787 and the supply zone that can define as a target.
💡Wait for the update!
🗓️25/03/2023
🔎 DYOR
💌It is my honor to share your comments with me💌

MANA BUYDear valued ones. A good mana coin to buy. The long-term . How much do you notice in the analysis? The currency managed to make gains. The descending channel was broken. It also broke a strong resistance. At the price of 600 . The currency is now in an accidental state.
