#MANA/USDT Forming Bullish Momentum#MANA
The price is moving within an ascending channel on the 1-hour timeframe and is adhering to it well. It is poised to break out strongly and retest the channel.
We have a downtrend line on the RSI indicator that is about to break and retest, which supports the upward move.
There is a key support zone in green at 0.1615, representing a strong support point.
We have a trend of consolidation above the 100-period moving average.
Entry price: 0.1632
First target: 0.1662
Second target: 0.1711
Third target: 0.1760
Don't forget a simple money management rule:
Place your stop-loss order below the green support zone.
Once you reach the first target, save some money and then change your stop-loss order to an entry order.
For any questions, please leave a comment.
Thank you.
Manausdtlong

MANA/USDT — Demand Zone: Major Rebound or Breakdown?MANA is approaching one of the most important price zones in its entire history.
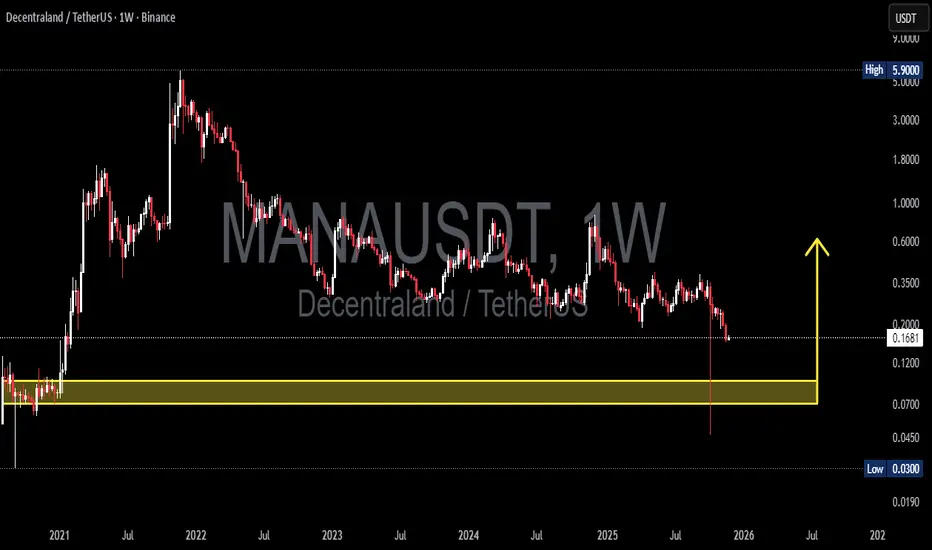
The yellow block at 0.095–0.07 isn’t just a support — it’s the origin demand, the very place where the 2021 macro bull run began.
Now, after years of decline, price is returning to this area.
The question is simple:
Does this zone still hold enough buyers… or will it become the doorway to new lows?
---
🎯 Key Chart Highlights
Weekly structure remains bearish, forming consistent lower highs and lower lows since 2022.
A massive liquidity sweep (wick into ~0.03) hints at institutional stop-hunting before recovering.
Price is now sliding back toward 0.095–0.07, a major historical accumulation base.
Below this zone, the next strong support is only around 0.03.
In other words: this is a multi-year decision point.
---
📌 Bullish Scenario — “Rebound From the Birthplace of the Last Bull Run”
If price taps the 0.095–0.07 zone and:
forms a weekly bullish engulfing,
prints a higher low,
or shows strong buy-side volume…
then MANA may enter a new accumulation phase, similar to early 2021.
Potential upside targets:
0.20 (local resistance)
0.35 (major supply zone)
0.60–1.00 if the broader crypto market turns bullish
This makes the zone a prime area for long-term accumulation.
---
📌 Bearish Scenario — “If the Historical Support Collapses”
If weekly closes below 0.07, then:
MANA forms a new macro lower low,
downtrend continues aggressively,
next strong support sits at 0.03.
A breakdown here typically triggers:
panic selling,
cascading stop losses,
strong short pressure,
accelerated downward momentum.
This is the scenario long holders must watch closely.
---
📌 Major Pattern Insight
Macro Downtrend since 2022
Liquidity Grab Wick showing smart-money activity
Retest of Origin Demand where the last bull cycle started
---
📣 Conclusion
MANA is standing at a multi-year crossroads.
The 0.095–0.07 zone isn’t just technical—it’s psychological.
It represents the thin line between a major reversal and a deeper breakdown.
Aggressive traders see it as a potential accumulation zone,
while conservative traders will wait for weekly confirmation.
Whatever happens next,
the next major move will likely begin right here.
#MANA #Decentraland #CryptoAnalysis #Altcoins
#DemandZone #SupportZone #PriceAction
#TechnicalAnalysis #CryptoMarket #AltcoinOutlook
#MANA/USDT –> Symmetrical Triangle Breakout#MANA
The price is moving within a descending channel on the 1-hour frame, adhering well to it, and is heading for a strong breakout and retest.
We have a bearish trend on the RSI indicator that is about to be broken and retested, which supports the upward breakout.
There is a major support area in green at 0.3250, representing a strong support point.
We are heading for consolidation above the 100 moving average.
Entry price: 0.3391
First target: 0.3458
Second target: 0.3560
Third target: 0.3668
Don't forget a simple matter: capital management.
When you reach the first target, save some money and then change your stop-loss order to an entry order.
For inquiries, please leave a comment.
Thank you.

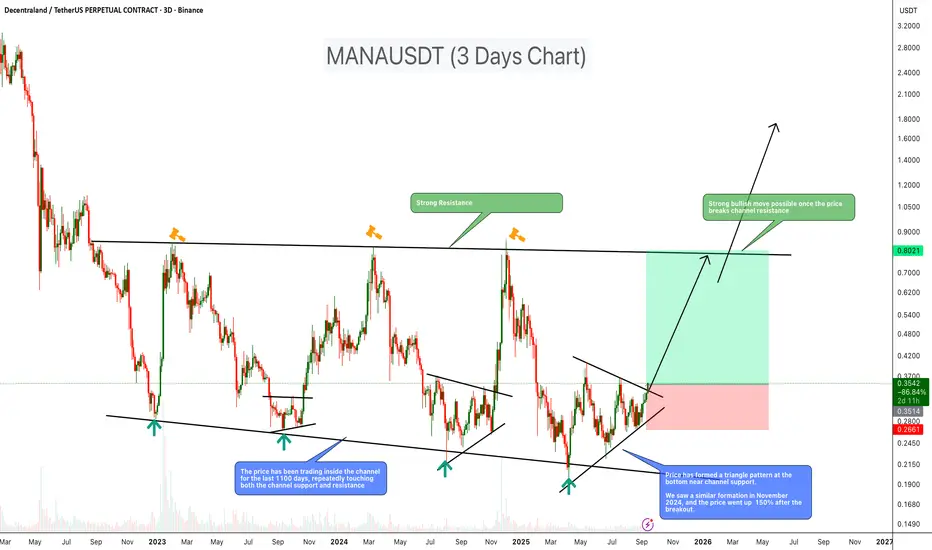
MANA About to Explode? 3-Year Channel Breakout Ahead!MANA has been consolidating inside a large descending channel for over 1100 days, consistently respecting both support and resistance levels. Recently, price formed a triangle pattern near channel support, a setup similar to Nov 2024, when MANA rallied over 150% after a breakout. This suggests a potential strong bullish move if resistance breaks.
Key Points
- Price has traded inside the channel for ~3 years
- Strong resistance around $0.80
- Triangle pattern formed near the channel bottom support
- A previous similar setup led to a sharp rally
- Breakout could open doors for a mid-term bullish trend
Trade Setup
Entry: $0.35
Stop-loss: Below $0.26
Targets:
First target: $0.75
Second target: $1.60
Cheers
Hexa
#MANA/USDT Situation, A Comprehensive Analysis !!!#MANA
The price is moving within a descending channel on the 1-hour frame, adhering well to it, and is heading for a strong breakout and retest.
We have a bearish trend on the RSI indicator that is about to be broken and retested, supporting the upside.
There is a major support area (in green) at 0.2617, which represents a strong basis for the upside.
For inquiries, please leave a comment.
We are in a consolidation trend above the 100 moving average.
Entry price: 0.2823
First target: 0.3000
Second target: 0.3133
Third target: 0.3331
Don't forget a simple matter: capital management.
When you reach the first target, save some money and then change your stop-loss order to an entry order.
For inquiries, please leave a comment.
Thank you.

MANAUSDT UPDATE#MANA
UPDATE
MANA Technical Setup
Pattern : Bullish Falling Wedge Pattern
Current Price: $0.3139
Target Price: $0.63
Target % Gain: 105.71%
Technical Analysis: MANA has broken out of a long-term falling wedge on the 1D chart, signaling strong bullish reversal potential. Price action shows breakout confirmation, and momentum suggests buyers stepping in for a move toward $0.63.
Time Frame: 1D
Risk Management Tip: Always use proper risk management.

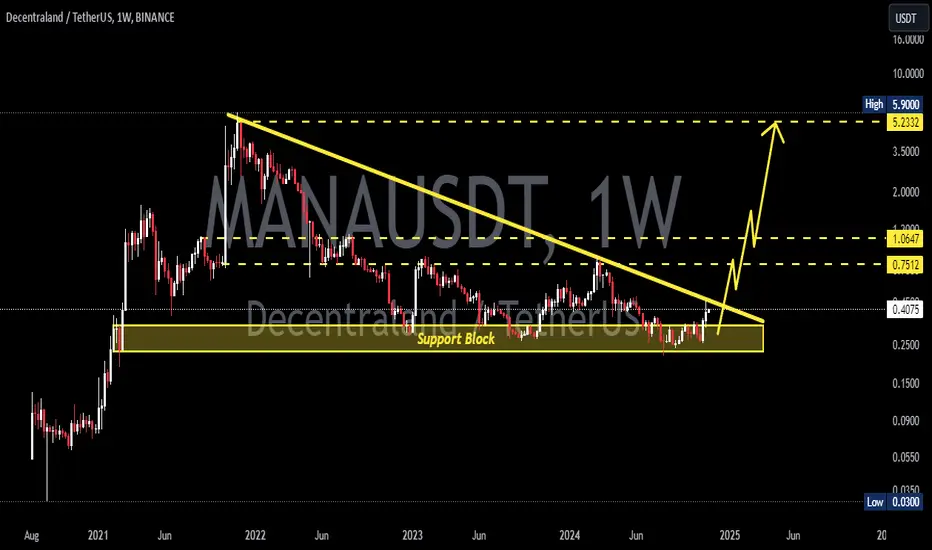
MANA/USDT Rebounding from Key Weekly Demand Zone – Path to $1?🔶 Strong Support Zone (Demand Zone):
MANA/USDT is currently testing a major weekly support area between $0.20 – $0.30, a zone that has historically acted as a strong demand level since 2021. Price has bounced off this region multiple times, indicating strong buyer interest and potential for a bullish reversal.
🔶 Chart Pattern:
There is no classic pattern like a double bottom or head & shoulders, but price structure shows signs of horizontal accumulation, which resembles a Wyckoff re-accumulation phase—a typical base formation before a strong upside breakout.
🚀 Bullish Scenario:
If the price holds above the $0.25 support and forms a higher low, a bullish continuation is likely. The following resistance levels could serve as potential upside targets:
1. $0.3610 – Initial resistance and confirmation level.
2. $0.5475 – Intermediate psychological level.
3. $0.8109 – Former supply zone.
4. $1.0661 – Major resistance from 2022.
5. $2.7291 – $5.0666 – Long-term targets if macro bull trend resumes.
> Bullish Confirmation: A strong weekly candle close above $0.36 with high volume could spark a major rally.
🔻 Bearish Scenario:
If price breaks down below $0.25 and closes below it on the weekly timeframe, it would invalidate the bullish structure and may trigger further downside towards:
$0.13 – $0.07, the historical lows seen in early 2021.
> Bearish Confirmation: A weekly close below $0.25 with increasing volume would suggest sellers are back in control.
🧠 Conclusion:
MANA/USDT is at a pivotal point within a long-standing support zone. Holding this level could result in a strong upward move, but a breakdown would indicate further bearish pressure. Traders should watch this zone closely for confirmation in either direction.
#MANAUSDT #Decentraland #CryptoTrading #TechnicalAnalysis #AltcoinAnalysis #BullishSetup #SupportZone #TradingView #MetaverseCrypto #CryptoBreakout

MANAUSDT 1W AnalysisMANA ~ 1W Analysis
#MANA Buy back gradually from this support block with a short term target of at least 20%+ from this support.

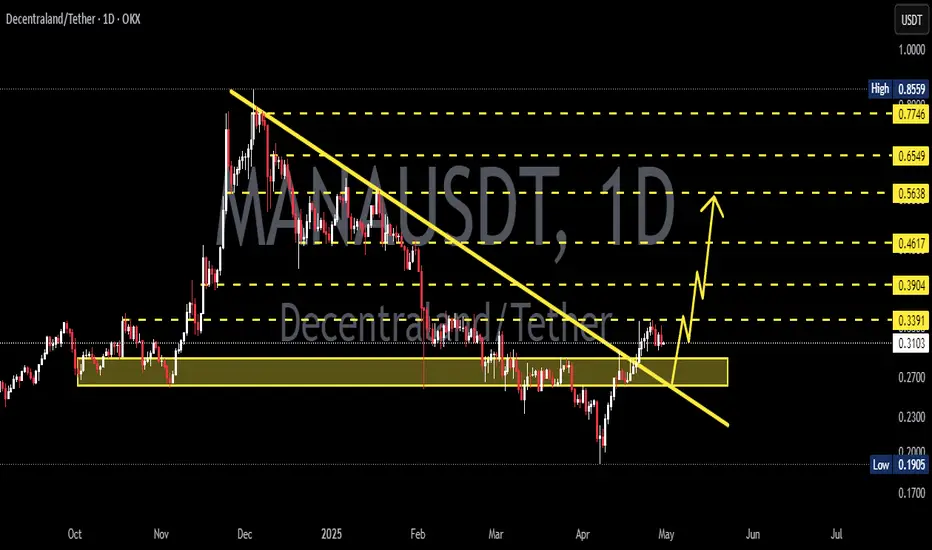
MANAUSDT 1D AnalysisMANA ~ 1D Analysis
#MANA Buy gradually from here if you still have confidence in this coin with a short term target of at least 15%++ from here.

MANAUSDT 1D AnalysisMANA ~ 1D Analysis
#MANA Buy gradually when re -testing this support with a short -term target of at least 15%+ from here.
MANAUSDT Huge Bounce Incoming?MANA is currently testing a long-term descending support trendline on the weekly chart. This level has acted as a reliable bounce zone multiple times in the past (highlighted with arrows).
-Price is holding above a major support level (~$0.21), showing signs of demand.
-Weekly RSI is forming a bullish divergence, with higher lows on RSI vs. lower lows on price — often a precursor to trend reversals.
-Previous touches on this trendline have led to significant rallies.

MANAUSDT 1WMANA ~ 1W Analysis
#MANA Buy gradually from here if you still have a Conviction on this coin with a short -term target of at least 20%+.

MANAUSDT 1WMANA ~ 1W Analysis
#MANA If you still have a Conviction on this coin,. This is a very good support for now. buy gradually with a minimum target of 20%+

#MANA/USDT Ready to go higher#MANA
The price is moving in a descending channel on the 1-hour frame and sticking to it well
We have a bounce from the lower limit of the descending channel, this support is at 0.5516
We have a downtrend on the RSI indicator that is about to be broken, which supports the rise
We have a trend to stabilize above the 100 moving average
Entry price 0.5593
First target 0.5732
Second target 0.5862
Third target 0.6016

#MANA/USDT#MANA
The price is moving in a descending channel on the 1-hour frame and is expected to continue upwards
We have a trend to stabilize above the moving average 100 again
We have a descending trend on the RSI indicator that supports the rise by breaking it upwards
We have a support area at the lower limit of the channel at a price of 0.5240
Entry price 0.5317
First target 0.5434
Second target 0.5570
Third target 0.5732

Decentraland at Pivotal Level: Can Bulls Push Above $0.59? MANA/USDT (Decentraland) chart shows the price trading just below the key support zone of $0.55-$0.59.
This area is crucial for determining the next directional move, as a reclaim of this zone could trigger bullish momentum, while a failure to regain it may lead to further downside.
DYOR, NFA

Manausdt Lookd Ready for a Flight (Swing)Analyzed this and this looks good here worth taking it.
Entry DCA under 0.5100.
Invalidation clean breaking below 0.4900(think won't happen ATM)
Note: Not a Financial Advise.

MANAUSDT 1WMANA Update ~ 1W
#MANA At Time frame 1W,. EURONEXT:MANA rejected by this local resistance. The best way for now. You can buy back when this resistance line is retested or you can place another purchase on this support block.
these two scenarios with a target of 20%++

$MANA can breakout the resistance ?Just be patient for the breakout and for pullback , totaly in not a bad situation

MANAUSDT Set for Channel Breakout!MANAUSDt Technical analysis update
BINANCE:MANAUSDT price has formed a descending channel on the weekly chart, which has been developing over the past 930 days. The price is now approaching the channel's resistance line, with rising volume observed in recent weeks. Additionally, the price is trading above the 100 EMA. Once the breakout is confirmed on the weekly chart, a strong bullish move can be anticipated.

#MANA/USDT#MANA
We have a bearish channel on a 4-hour frame, the price moves within it and adheres to its borders well at this price.
We have a higher stability moving average of 100
We have a downtrend on the RSI that is about to break higher
Entry price is 0.5858
The first target is 0.6526
The second goal is 0.7243
the third goal is 0.8046

MANA/USDT Trading ScenarioDespite the rapid growth of BTC and many popular assets in the crypto market, some altcoins from promising projects remain heavily oversold and undervalued. One example is the native token of the Decentraland metaverse — MANA. It is currently trading 95% below its all-time high and is near a local minimum.
From a volume profile perspective, the asset is attracting market participants in the current price range, and the accumulation phase has been ongoing for almost two years. If liquidity starts to shift from BTC into altcoins during an altseason, this token could experience significant growth and provide investors with a solid profit.

MANAUSDT 1WMANA ~ 1W
#MANA This chart is very interesting,. It is very bullish if this resistance line is successfully broken. if you still have Conviction on this coin. Buy in stages starting from here. minimum target 20%++