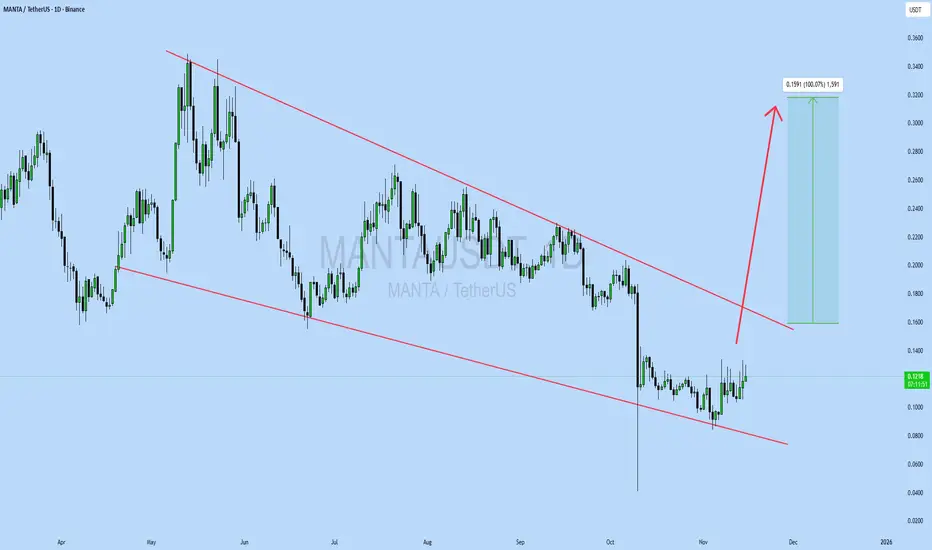
MANTAUSDT Forming Falling WedgeMANTAUSDT is forming a clear falling wedge pattern, a classic bullish reversal signal that often indicates an upcoming breakout. The price has been consolidating within a narrowing range following the earlier decline, suggesting that selling pressure is steadily weakening while buyers are gradually stepping in to regain control. With consistent volume confirming accumulation at these lower levels, the setup is building toward a potential bullish breakout in the near future. Once the price breaks decisively above the wedge resistance, the projected move could deliver an impressive gain of around 90% to 100% from the breakout point.
This falling wedge pattern is typically seen at the end of downtrends or during corrective phases, and it serves as a strong sign that market sentiment may be shifting from bearish to bullish. Traders closely watching PORTOUSDT are seeing a similar buildup of momentum as it approaches its own breakout zone. The solid trading volume supporting the pattern adds real confidence, showing that market participants are getting positioned early in anticipation of a reversal.
The growing interest in PORTOUSDT is fueled by increasing optimism about the project's long-term fundamentals combined with this attractive technical picture. If the breakout confirms with sustained volume behind it, this could mark the beginning of a fresh bullish leg. Traders might view this as a high-quality setup for medium-term gains, especially once the wedge pattern fully completes and buying momentum starts to accelerate.
✅ Show your support by hitting the like button and
✅ Leaving a comment below! (What is your opinion about this Coin)
Your feedback and engagement keep me inspired to share more insightful market analysis with you!
Manta

MANTA/USDT – Long Trade Setup (4H). MANTA/USDT – Long Trade Setup (4H)
The price is holding above the rising trendline, indicating a bullish structure.
Strong demand zone around 0.076–0.078, with multiple rejections, buyers are active.
Price is trying to reclaim the 200 MA, which often acts as dynamic support in uptrends.
The overall structure suggests a higher-low formation.
Entry: 0.078 – 0.080 zone
Stop-Loss: Below 0.074
Targets:
T1: 0.085
T2: 0.088 – 0.090 (previous supply/resistance zone)
As long as price holds above the trendline and demand zone, bullish continuation is favored.
A clean breakout above 0.085 can accelerate upside momentum.
⚠️ Manage risk properly. Not financial advice.

#MANTA [RR: 1/5] Price reversal and new growth BINANCE:MANTAUSDT
There is a 5-wave cycle with an elongated 3rd wave and a corrective (protracted) 4th wave.
At the moment, the asset has completed the movement of wave 5 and has shown signs of a reversal in the long direction at the 1.618 extension level.
If we look at W1, we see that the volume nodes (HVN) coincide with the 0.618 Fibonacci retracement level. This adds weight to the argument that the asset has just completed wave 5.
I am considering a move to HVN (0.12), which gives a risk/reward ratio of 1/5.
I do not rule out manipulative movements.

MANTA/USDT – Long Trade Setup (4H)MANTA/USDT – Long Trade Setup (4H)
Structure: Descending wedge/trendline compression
Ichimoku: Price pushing back into the cloud → momentum stabilizing
MA acting as dynamic support
Long Idea
Entry Zone: 0.0725 – 0.0730
Stop Loss: 0.070
Targets:
T1: 0.0760
T2: 0.0790 – 0.0800
DYOR | NFA

MANTAUSDT Forming Falling WedgeMANTA/USDT is setting up a very interesting technical picture — price is contracting into what looks like a falling-wedge formation, which often signals a potential bullish reversal. The tightening range, combined with volume that’s beginning to pick back up, suggests that accumulation could be building and a breakout to the upside may be imminent. If the wedge’s upper trendline gives way with strength, we could see MANTA run significantly higher.
On the fundamentals side, Manta Network is a multi-modular blockchain ecosystem focused on zero-knowledge (ZK) applications. It has two main chains: Manta Pacific (a Layer 2 chain optimized for EVM-native ZK apps) and Manta Atlantic (a privacy-centric Layer 1). This dual-chain architecture allows for both composability and data privacy, making Manta especially relevant in today’s Web3 infrastructure space.
Tokenomics also support the trade thesis: MANTA has a total supply of 1 billion tokens, with roughly ~449 million circulating currently, and MANTA is used for staking, governance, and network fees.On top of that, a recent partnership with Symbiotic brings “fast finality” to Manta Pacific via restaking mechanics, which could further incentivize users and operators to lock in their MANTA.
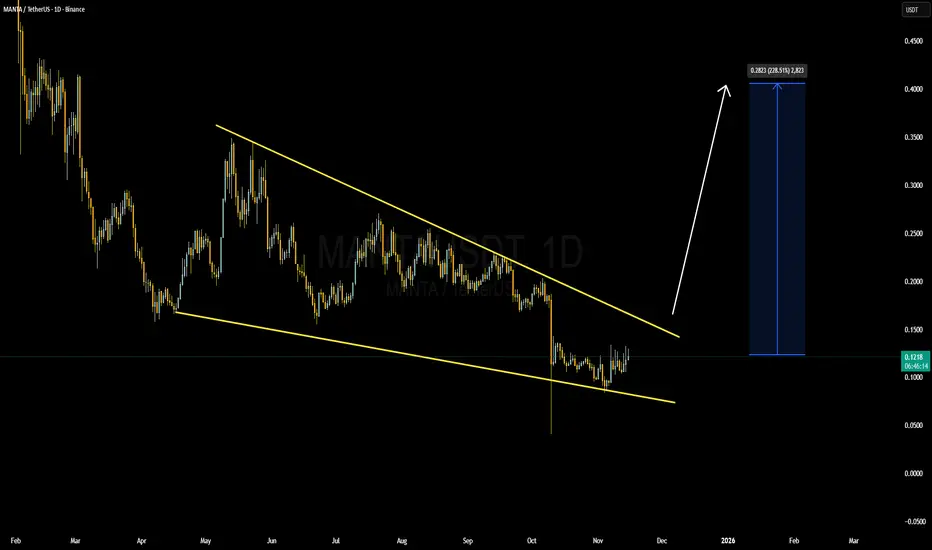
MANTAUSDT UPDATE#MANTA
UPDATE
MANTA Technical Setup
Pattern: Falling wedge pattern
Current Price: $0.1216
Target Price: $0.2807
Target % Gain: 100.07%
Technical Analysis: MANTA is breaking out of a falling wedge pattern on the 1D chart, showing early bullish momentum as price pushes above short-term resistance while holding higher lows. The breakout attempt suggests buyers are gradually stepping in, and a confirmed close above the wedge’s upper trendline would strengthen the bullish case. If momentum continues, price may move toward the measured target near $0.2807.
Time Frame: 1D
Risk Management Tip: Always use proper risk management.
MANTAUSDT Bullish Channel Breakout!MANTA is showing a potential bullish breakout from a descending channel that has been holding price down throughout October. The recent strong recovery and breakout attempt above the upper trendline indicate early signs of trend reversal and possible momentum shift to the upside.
Key Points:
-Price has broken the upper boundary of the descending channel after multiple rejections.
-Volume increase on breakout confirms buyer activity.
- Horizontal volume profile shows a strong liquidity base near $0.10 – $0.11, which could act as solid support.
- Short-term target zone lies between $0.18 – $0.20, aligning with the next major supply area.
- Ideal invalidation below $0.095.
Buy zone : Above $0.115
Stop loss : $0.095
Cheers
Hexa
OMXHEX:MANTA BINANCE:MANTAUSDT

#MANTA/USDT – Bullish Setup Alert ?#MANTA
The price is moving within a descending channel on the 1-hour frame and is expected to break and continue upward.
We have a trend to stabilize above the 100 moving average once again.
We have a downtrend on the RSI indicator that supports the upward break.
We have a support area at the lower boundary of the channel at 0.190, acting as strong support from which the price can rebound.
We have a major support area in green that pushed the price upward at 0.186.
Entry price: 0.196
First target: 0.205
Second target: 0.214
Third target: 0.225
To manage risk, don't forget stop loss and capital management.
When you reach the first target, save some profits and then change the stop order to an entry order.
For inquiries, please comment.
Thank you.

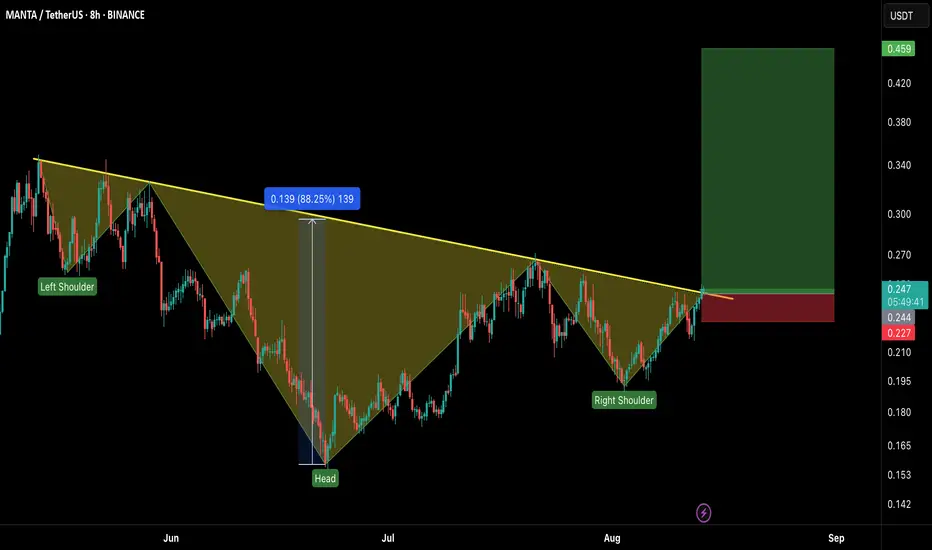
MANTA/USDT – Long Setup Alert!MANTA has just broken out of a massive Inverse Head & Shoulders pattern on the 8H chart — a bullish reversal signal that could ignite a strong upside rally. 📈
Setup Details:
Entry: CMP – 0.248
Stop Loss: 0.227 (below neckline retest)
Targets:
🎯 TP1: 0.34
🎯 TP2: 0.42
🎯 TP3: 0.459
Leverage: 5x max (adjust risk accordingly)
Why This Setup?
✅ Clean breakout above neckline after weeks of consolidation
✅ Volume supporting the breakout
✅ Pattern target aligns with strong resistance zone above
⚠️ Risk Management: Stick to your SL. A failed retest can trap late entries.
Bulls are in control — let’s ride this momentum!
MANTAUSDT 1D AnalysisMANTA ~ 1D Analysis
#MANTA If you are interested in this coin, maybe you can consider this support to start buying back from here with a short-term target of at least 15%+
#MANTA/USDT#MANTA
The price is moving within a descending channel on the 1-hour frame, adhering well to it, and is heading for a strong breakout and retest.
We are seeing a bounce from the lower boundary of the descending channel, which is support at 0.290.
We have a downtrend on the RSI indicator that is about to be broken and retested, supporting the upward trend.
We are looking for stability above the 100 moving average.
Entry price: 0.305
First target: 0.329
Second target: 0.348
Third target: 0.373

Manta Classic Bullish Signals = Bull Market Confirmed—PP: 1900%This analysis can be used not only to spot the trading opportunity that is now MANTAUSDT, but also for learning purposes. Let's go back to basics.
Here MANTAUSDT is breaking daily above EMA55. This break is happening with a full green candle and yesterday's candle also closed full green. Today's full green candle has above-average trading volume and is coming after several short-term higher lows. So this is a constellation of signals. One signal, the break of resistance, supported by many additional signals (volume, candles and chart pattern).
The classic signal is the break above EMA55 on the daily timeframe. This confirms a bullish potential for the mid-term, minimum, which means 3 months.
The next signal comes from the RSI, it is super strong. A hyper bullish RSI while a project is trading at bottom prices is another classic bullish strong reversal signal. It is present here.
These together, with marketwide action, what the rest of the market is doing, is more than enough for me to say: Manta is going up.
Thank you for reading.
Namaste.

MANTA: The Pacific#MANTA is one of the Binance Launchpool coins listed in late 2023–early 2024, most of which dumped heavily post-launch, draining liquidity from beginner users.
Despite that, OMXHEX:MANTA may have completed a major zigzag correction after a strong bounce from ATL.
Holding above that low could spark a major bull-run, potentially recovering early investor losses.
#MantaNetwork

Manta Network Bottom Situation—Trading Tips & Tricks (575% Rise)We have a situation here where the market bottom has been confirmed.
Notice that MANTAUSDT is trading above its 11-March low but below its 3-Feb. low. The pairs that are trading above the 3-Feb. low are stronger from a TA perspective and from a trading perspective and likely a fundamental perspective as well, compared to those trading below.
They are stronger first because the recovery is strong and second because the crash was smaller. In both cases, the rise and the drop, the market showed more support and action on these. This is something to keep in mind when choosing your pairs.
Stronger pairs tend to produce better results.
When retraces and corrections happen, they tend to happen all across. So those stronger will continue to outperform and you better choose those when choosing you Altcoins, with some exceptions of course.
There are thousands of Altcoins and it is hard to choose.
For me, I chose on 7-April when the bottom hit, so all are green, but the world (and trading) doesn't end there. The truth is that bottom prices are great but available only for the short-term.
You can use moving averages as well to know which pairs are better than another and which ones are more likely to move next. The ones trading above the longer EMAs are the ones that are stronger.
Just a few tips and tricks to improve your chances of success.
Thank you for reading.
Namaste.

MANTA/USDT: Breakout Alert: 60-70% Upside Incoming!🚀 Hey Traders! MANTA Breakout Incoming! 👋
If this setup gets you hyped, smash that 👍 and hit Follow for high-quality trade setups that deliver real results! 💹🔥
MANTA is looking bullish and ready to explode! 📈 It’s breaking out of a falling wedge on the 4-hour timeframe, signaling a potential 60-70% upside move. Now’s the time to long and add on dips!
🔹 Entry Range: CMP – Add more up to $0.63
🎯 Targets:
✅ Target 1: $0.76
✅ Target 2: $0.85
✅ Target 3: $0.94
✅ Target 4: $1.10
🛡 Stop Loss (SL): $0.59
⚙️ Leverage: Use low leverage (Max 5x)
💬 Your Thoughts?
Are you bullish on MANTA’s breakout? Drop your analysis, predictions, or strategies in the comments! Let’s ride this wave and lock in those gains together! 💰🔥

Manta zones for accumulationManta IAP model with accumulation zones BINANCE:MANTAUSDT
Possible Targets and explanation idea
➡️IAP model zones for accumulation marked on a screen
➡️From signal confirmation to sell on TradeOn indicator -62% short profit
➡️Appeared signal take profit and close short position
➡️On daily we saw local signal to buy and small bounce.
➡️Step by step you can accumulate now or wait main zones for accumulation with DCA
➡️2 main money inflow periods with money power indicator. whales accumulate
Hope you enjoyed the content I created, You can support with your likes and comments this idea so more people can watch!
✅Disclaimer: Please be aware of the risks involved in trading. This idea was made for educational purposes only not for financial Investment Purposes.
---
• Look at my ideas about interesting altcoins in the related section down below ↓
• For more ideas please hit "Like" and "Follow"!

Don't miss this jump on MANTA!Hi fellow traders, MANTAUSDT is ready to make a move higher after completing the complex correction in WXY formation. Target the 1.4961 level. Good luck and trade safe!

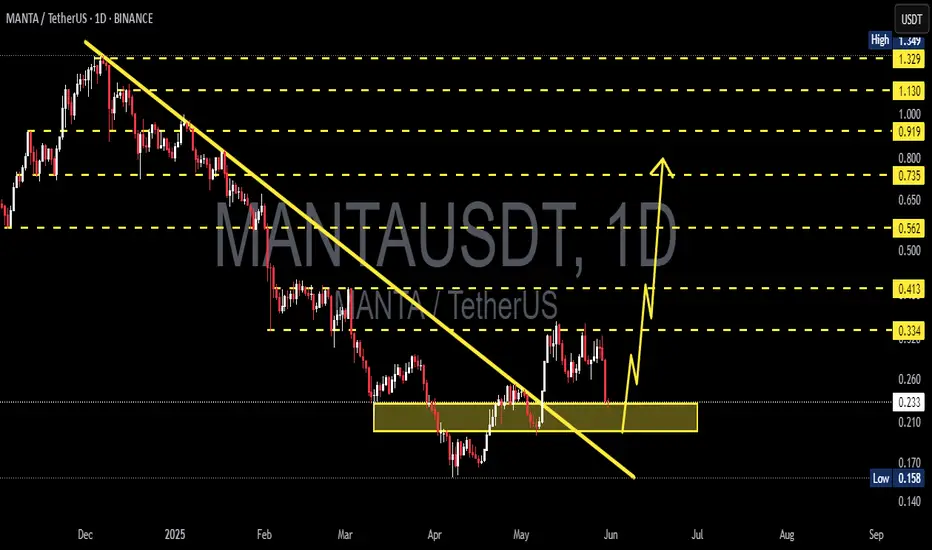
MANTA/USDT CHART UPDATE !! MANTA/USDT daily chart highlights a promising long-term trade setup with a strong bullish potential.
The chart shows an upward-sloping trendline that has been respected since the token’s inception. It serves as a crucial support level around $0.75–$0.80.
The price is consolidating near the trendline support, creating a low-risk entry zone for long positions.
A rapid bounce off this zone could signal the start of a strong upward move.
The chart indicates a large, bullish arrow towards $4.00, suggesting a potential 4x move upon exiting this accumulation phase.
The main resistance zones are near $1.50 and $2.50 before reaching the $4.00 target.
Risk Management:
If the price breaks below the trendline, it will invalidate the bullish setup, indicating caution.
If you found this analysis helpful, hit the Like button and share your thoughts or questions in the comments below. Your feedback matters!
Thanks for your support!
DYOR. NFA

Can Manta Network Become the Best Layer 2 (investing chart... )hello dear trader...
Can Manta Network Become the Best Layer 2 Solution?
Given the unique features of Manta Network, including its integration with the Polkadot ecosystem, focus on privacy, strong Binance backing, and commitment to decentralization, the project has substantial potential to become one of the top Layer 2 solutions in the blockchain space.
If the development team can overcome technical challenges, address competition, and achieve widespread adoption, Manta Network could emerge as a leading privacy-focused Layer 2 protocol.
Ultimately, the future of Manta Network depends on market developments, user adoption, and the performance of the development team, but the project certainly holds a promising future in the evolving world of blockchain and decentralized finance (DeFi).
good luck
MLong

$MANTA will rebound ?OMXHEX:MANTA is coin that having huge pros & cons, while since March we see that this coin dumped so deep from $3,8 to $0,6.
Now hovering around $0,94 as i write this idea. MANTA will rebound to $1,5 at least, if market still Fear, still good.
but to reclaim $3,8 level? still we have to monitor and MANTA have to gain public trust again.
somehow, i still have to say, this crypto coin isnt that bad, good project, good prospect i think. let see MANTA at $1,5 first.

MANTAUSDT 1WMANTA ~ 1W
#MANTA This support block has so far kept prices from dropping any lower. If you still have Conviction on the coin,. This support block would be a very good buying place for now,. Buy in stages with a minimum target of 20%+

#MANTA/USDT Ready to go higher#MANTA
The price is moving in a descending channel on the 1-hour frame and sticking to it well
We have a bounce from the lower limit of the descending channel, this support is at 0.833
We have a downtrend on the RSI indicator that is about to be broken, which supports the rise
We have a trend to stabilize above the moving average 100
Entry price 0.867
First target 0.935
Second target 0.978
Third target 1.03

MANTA 1D. Accumulation Ends. 12/02/24Previously, the price spent considerable time in an accumulation phase. After finding a bottom at $0.583, an upward trend began to form.
Currently, the price is testing a resistance level, attempting to break through and consolidate, which could indicate a continuation of the uptrend. Although unsuccessful so far, it seems to be only a matter of time. In the short term, a slight pullback is expected, followed by, in my opinion, continued growth.
Entry Plan (EP): $1.05 - $0.95
Take Profit (TP):
$1.535
$1.869
$2.222
Stop Loss (SL): $0.747
For spot positions: no stop-loss recommended.
DYOR.
