MANTA/USDT – Long Trade Setup (4H)MANTA/USDT – Long Trade Setup (4H)
Structure: Descending wedge/trendline compression
Ichimoku: Price pushing back into the cloud → momentum stabilizing
MA acting as dynamic support
Long Idea
Entry Zone: 0.0725 – 0.0730
Stop Loss: 0.070
Targets:
T1: 0.0760
T2: 0.0790 – 0.0800
DYOR | NFA
MANTABTC

MANTAUSDT Forming Falling WedgeMANTA/USDT is setting up a very interesting technical picture — price is contracting into what looks like a falling-wedge formation, which often signals a potential bullish reversal. The tightening range, combined with volume that’s beginning to pick back up, suggests that accumulation could be building and a breakout to the upside may be imminent. If the wedge’s upper trendline gives way with strength, we could see MANTA run significantly higher.
On the fundamentals side, Manta Network is a multi-modular blockchain ecosystem focused on zero-knowledge (ZK) applications. It has two main chains: Manta Pacific (a Layer 2 chain optimized for EVM-native ZK apps) and Manta Atlantic (a privacy-centric Layer 1). This dual-chain architecture allows for both composability and data privacy, making Manta especially relevant in today’s Web3 infrastructure space.
Tokenomics also support the trade thesis: MANTA has a total supply of 1 billion tokens, with roughly ~449 million circulating currently, and MANTA is used for staking, governance, and network fees.On top of that, a recent partnership with Symbiotic brings “fast finality” to Manta Pacific via restaking mechanics, which could further incentivize users and operators to lock in their MANTA.
MANTAUSDT UPDATE#MANTA
UPDATE
MANTA Technical Setup
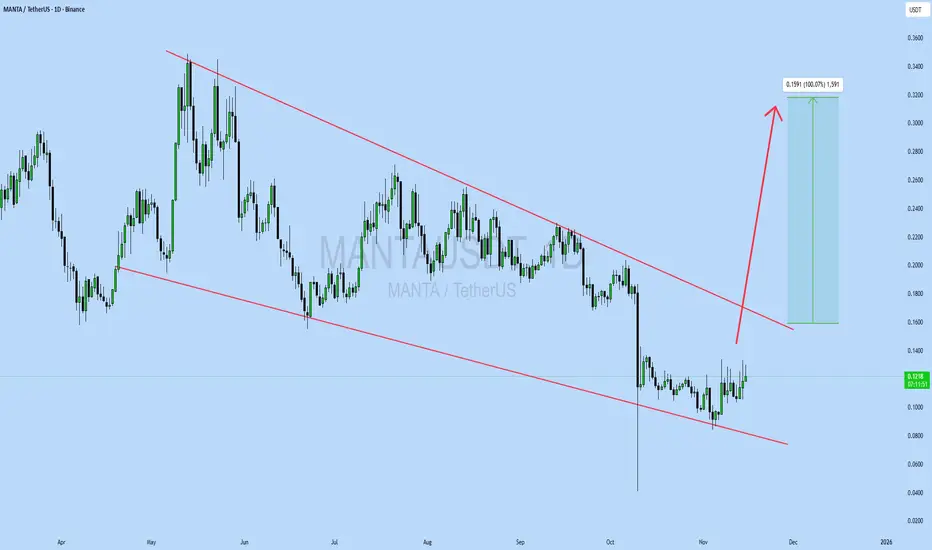
Pattern: Falling wedge pattern
Current Price: $0.1216
Target Price: $0.2807
Target % Gain: 100.07%
Technical Analysis: MANTA is breaking out of a falling wedge pattern on the 1D chart, showing early bullish momentum as price pushes above short-term resistance while holding higher lows. The breakout attempt suggests buyers are gradually stepping in, and a confirmed close above the wedge’s upper trendline would strengthen the bullish case. If momentum continues, price may move toward the measured target near $0.2807.
Time Frame: 1D
Risk Management Tip: Always use proper risk management.
#MANTA/USDT – Bullish Setup Alert ?#MANTA
The price is moving within a descending channel on the 1-hour frame and is expected to break and continue upward.
We have a trend to stabilize above the 100 moving average once again.
We have a downtrend on the RSI indicator that supports the upward break.
We have a support area at the lower boundary of the channel at 0.190, acting as strong support from which the price can rebound.
We have a major support area in green that pushed the price upward at 0.186.
Entry price: 0.196
First target: 0.205
Second target: 0.214
Third target: 0.225
To manage risk, don't forget stop loss and capital management.
When you reach the first target, save some profits and then change the stop order to an entry order.
For inquiries, please comment.
Thank you.

MANTAUSDT Forming Descending ChannelMANTAUSDT is shaping up to be one of the more intriguing setups in the market right now, showing a well-defined descending channel pattern. This technical formation often signals a healthy consolidation phase within a broader trend, creating a launchpad for an eventual breakout. With trading volume remaining good and steady, there is a strong foundation for a significant move that could yield an 80% to 90% gain once the channel’s resistance is convincingly broken.
The MANTA project itself is increasingly attracting investor interest, thanks to its innovative approach to DeFi and cross-chain privacy solutions. As the crypto sector continues to look for new ways to scale and protect user data, MANTA stands out as a project that combines real-world use cases with strong tokenomics. This growing community interest can add momentum to the pair’s technical breakout, potentially driving the price rapidly towards its expected targets.
From a technical perspective, the descending channel acts like a coiled spring. When prices repeatedly test the lower support and upper resistance of the channel, traders watch for a breakout confirmation, which can lead to a sharp trend reversal. The combination of this reliable pattern with increasing investor confidence makes MANTAUSDT a pair worth watching closely for bullish signals in the coming sessions.
✅ Show your support by hitting the like button and
✅ Leaving a comment below! (What is You opinion about this Coin)
Your feedback and engagement keep me inspired to share more insightful market analysis with you!

#MANTA/USDT#MANTA
The price is moving within a descending channel on the 1-hour frame, adhering well to it, and is heading for a strong breakout and retest.
We are seeing a bounce from the lower boundary of the descending channel, which is support at 0.290.
We have a downtrend on the RSI indicator that is about to be broken and retested, supporting the upward trend.
We are looking for stability above the 100 moving average.
Entry price: 0.305
First target: 0.329
Second target: 0.348
Third target: 0.373

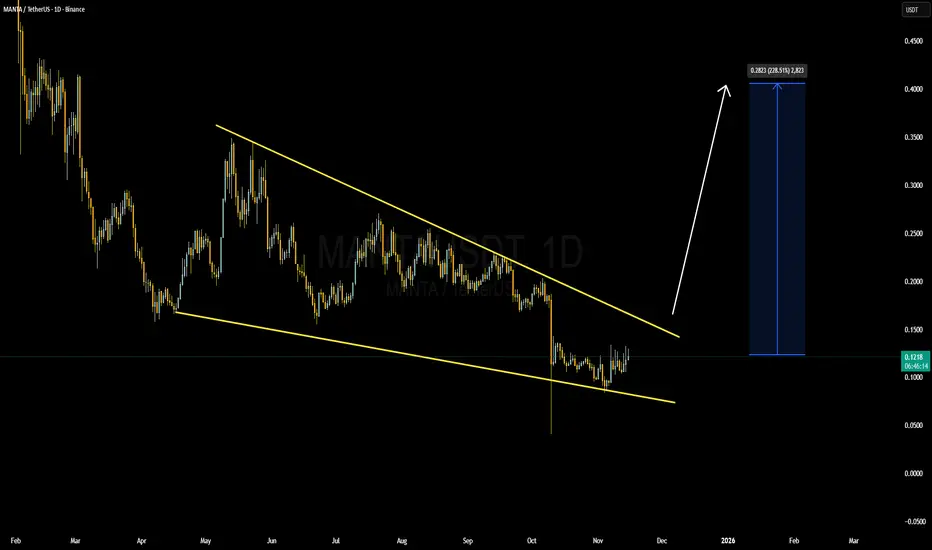
MANTA/USDT CHART UPDATE !! MANTA/USDT daily chart highlights a promising long-term trade setup with a strong bullish potential.
The chart shows an upward-sloping trendline that has been respected since the token’s inception. It serves as a crucial support level around $0.75–$0.80.
The price is consolidating near the trendline support, creating a low-risk entry zone for long positions.
A rapid bounce off this zone could signal the start of a strong upward move.
The chart indicates a large, bullish arrow towards $4.00, suggesting a potential 4x move upon exiting this accumulation phase.
The main resistance zones are near $1.50 and $2.50 before reaching the $4.00 target.
Risk Management:
If the price breaks below the trendline, it will invalidate the bullish setup, indicating caution.
If you found this analysis helpful, hit the Like button and share your thoughts or questions in the comments below. Your feedback matters!
Thanks for your support!
DYOR. NFA

Can Manta Network Become the Best Layer 2 (investing chart... )hello dear trader...
Can Manta Network Become the Best Layer 2 Solution?
Given the unique features of Manta Network, including its integration with the Polkadot ecosystem, focus on privacy, strong Binance backing, and commitment to decentralization, the project has substantial potential to become one of the top Layer 2 solutions in the blockchain space.
If the development team can overcome technical challenges, address competition, and achieve widespread adoption, Manta Network could emerge as a leading privacy-focused Layer 2 protocol.
Ultimately, the future of Manta Network depends on market developments, user adoption, and the performance of the development team, but the project certainly holds a promising future in the evolving world of blockchain and decentralized finance (DeFi).
good luck

#MANTA/USDT Ready to go higher#MANTA
The price is moving in a descending channel on the 1-hour frame and sticking to it well
We have a bounce from the lower limit of the descending channel, this support is at 0.833
We have a downtrend on the RSI indicator that is about to be broken, which supports the rise
We have a trend to stabilize above the moving average 100
Entry price 0.867
First target 0.935
Second target 0.978
Third target 1.03

#MANTA/USDT#MANTA
The price is moving within a bullish channel pattern on the 4-hour frame, which is a strong retracement pattern
We have a bounce from a major support area in the color EUR at 0.300
We have a tendency to stabilize above the Moving Average 100
We have an upward trend on the RSI indicator that supports the rise and gives greater momentum, upon which the price depends
Entry price is 0.3300
The first target is 0.3752
The second target is 0.4050
The third target is 0.4400

#MANTA/USDT Trade Setup, 600% Spot Long potential!Manta Breakout Alert!
Manta is trading at a long-term resistance of $0.72, and I’m anticipating a breakout.
While there’s a slim chance of a retest around $0.60 in the coming days, once we see a confirmed breakout and a successful retest, the potential upside could take us to $4.
Trade Setup:
• Entry Range: $0.576 - $0.725
• Targets: $1.04, $1.518, $2.267, and $4.05
• Stop Loss: $0.48
• Risk-Reward Ratio: A highly attractive 1:36
I plan to make $100k with a margin of $10k at 5x leverage on this trade!
I am already positioned and will keep you updated on this.
Let me know your thoughts in the comments! If you find this analysis valuable, hit that like button.
For more setups like this, follow me and share this setup with your friends.
Thank you, and peace!

MANTA is ready to rockManta is very strong coin at the moment. Breaking out higher. I am expecting new ATH soon. Playing bigger position with spot.
NOT A FINANCIAL ADVICE
ALWAYS USE STOPLOSS AND MANAGE YOUR RISK
IF YOU HAVE ANY QUESTIONS PLEASE LET ME KNOW IN COMMENTS

#MANTA , $MANTA , MANTAUSDT, MANTAUSD#MANTA ...... is in a very nice entry point and near stop loss to get high profit
#MANTA
OMXHEX:MANTA
#MANTAUSDT
#MANTAUSD
#swingtrade
#shortterminvestment
#ALTCOIN
#Cryptotading
#cryptoinvesting
#investment
##trading
#cryptocurrencytrading
#bitcoininvestments
#Investing_Coins
#Investingcoins
#Crypto_investing
#Cryptoinvesting
#bitcoin
#BTC
#BTCUSDT
BINANCE:MANTAUSDT

#MANTA/USDT#MANTA
The price is moving within a descending channel pattern on the 12-hour frame and is expected to break upwards
We have a downtrend on the RSI indicator that has been broken upwards and we have a trend to stabilize above it
We have a major support level in green at a price of 0.600
We have a trend to stabilize above the moving average 100 which supports the rise
Entry price 0.650
First target 0.85
Second target 1.00
Third target 1.17

MANTA best time for buy ....hello dear trader
manta now in the supourt area on fibounachi on dayli timeframe
after price hit new HH above the supourt area we can buy this coin
dont forget this : manta one of the best crypto project
good luck

MANTA looks bearishFrom where we placed the red arrow on the chart, the MANTA correction has started.
The pattern seems to be a diametric and we are now at the end of wave E.
It is expected that the corrective phase of MANTA will continue.
The two vertical lines on the chart are the approximate time of completion of wave E of the diametric
Closing a daily candle above the invalidation level will violate the analysis
For risk management, please don't forget stop loss and capital management
When we reach the first target, save some profit and then change the stop to entry
Comment if you have any questions
Thank You

#MANTA\USDT#MANTA
We have a bearish channel on the 12-hour frame, the price moves within it and adheres to its limits well
We have a major support area at Saad 1.70
We have a tendency to stabilize above moving average 100
We have a downtrend on the RSI indicator that has been broken to the upside
Entry price is 2.00
The first goal is 2.50
The second goal is 2.96
the third goal is 3.48

Accumulation range for MANTAI see a nice accumulation range on MANTA (white box). I expect a good pump as soon as the price will broke above this range with a possible 50% pump. Looking at lower tf, the black box is an important resistance to broke.

MANTAUSDT Resistance Breakout!MANTAUSDT Technical analysis update
MANTAUSDT price breaking its trend resistance line in the 4H chart. we can expect a50-100% move in short-term
Buy zone: Below $3.45
Stop loss: $2.97
Hexa
Regards

MANTA Wants new ATHMANTA is exploding and it's breaking every resistance. It's actually trying to broke the last stop before new ATH. I expect a small range before pumping till $3.9 first and $4.35 next. It's matter of time


MANTA On key levelMANTA is approacing main support trendline. We basically have two options here (As always): bounce the trendline aiming for resistance zone at 3.16 or break the trendline and going to support zone at 2.5. Considering the ETH possible weakness, i expect the short. Trying new color setup, do you like it? I think it's more clear

Manta/Usdt Idea Mant/Usdt Looks Promising For Breakout
Incase Of Successful Breakout I Am Expecting 20-40% Bullish Move For Short Term : Lets See
This is not financial advice , Dyor
