Maple Finance · Now New LowsNotice how Maple Finance (SYRUPUSDT) has been consolidating and yet produces no new lows—flat bottom.
The last four days have been closing green but Bitcoin has been dropping. Bitcoin has been dropping since 14-August, more than two weeks; why this disparity?
Why are some altcoins growing while Bitcoin retraces?
Why are so many altcoins breaking up and growing 50-100% in a single day? Some more, some less; but strong bullish breakouts are happening.
Notice that the projects retracing are those trading higher or near resistance.
Notice that the projects that are near support continue to build up strength even while Ether goes down short-term. Short-term because we obviously have a very strong rising trend.
ETHUSDT bottomed at ~$1,350 and after just a few months reached almost $5,000. No surprise if we see some sort of pause or stop. Same for Bitcoin, it has been growing for years, almost 3 years now since November 2022, the previous bear market bottom. While this is awesome, it isn't all.
See SYRUP here. Rising volume, moving above several moving averages, flat bottom and ready to grow. This is the same situation I am finding on hundreds of altcoins. It is as if the biggest explosion ever is about to take place.
It is amazing, but I will not be caught off guard. The proof is in the charts, hundreds of charts. And months the market moving either sideways or higher. This is all bullish consolidation in preparation of a major advance.
Namaste.
Maplefinance

SYRUP Break out from ABCDE Triangle patternSYRUP Break out from ABCDE Triangle pattern Towards reversed fib level 141.00%

SYRUP Priming for a 12% Pop - Longterm ~20% PotentialHey Guys, My last posts were hidden (Again) ty TV, so I'm back at it and keeping it clean and to the point:
Maple Finance
SYRUPUSD
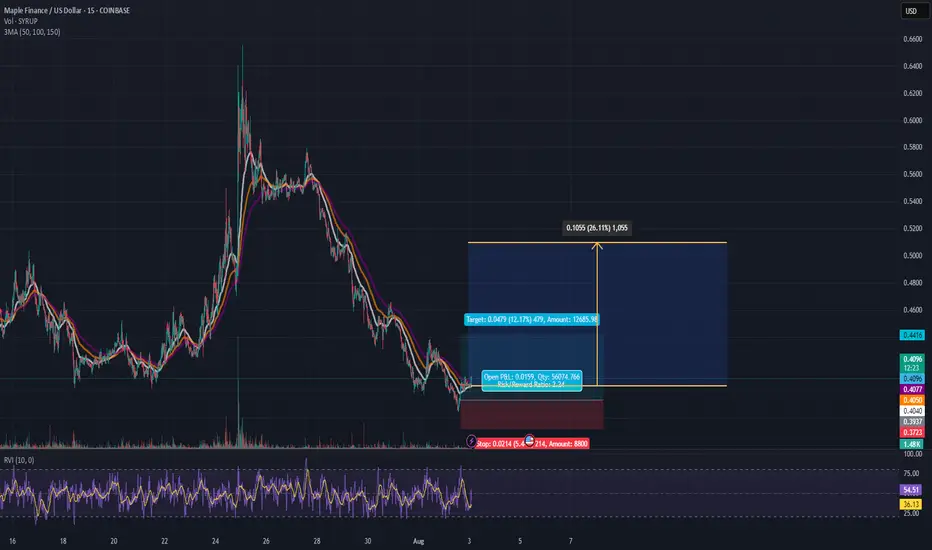
is forming a base at the $0.40 zone after a steep downtrend. Looks like the bleeding's slowing down and we're seeing signs of accumulation.
🍯 Entry: $0.402 - $0.4045
🛑 Stop: $0.3825 (5.4% risk)
🎯 Target 1: $0.4479 (+12.1%)
🚀 Target 2: $0.5100 (+20.6%)
📐 R/R Ratio: ~2.2
This is a structure-based long setup:
Flattening EMAs
Volume compression
Lower wick absorption (buyer presence showing up quietly)
💡 Target 2 ($0.5100) is not a short-term scalp – that's the stretch target IF this turns into full accumulation. Full exit at T1 is a solid take.
More setups on the way.
SYRUP · Higher & HigherI can see this one rising and rising and somehow I think I am not the only one that can see it. Can you see it? I see SYRUP going up and it is as if it is already happening.
Technical analysis
A several month long support is holding now. This support range was tested twice in the past and both times a bullish move developed. Now is the third time and after this support zone was activated SYRUPUSDT has been closing green. Today will be the third green day and when this happens we know what happens and what happens is that the market tends to grow really strong in the ensuing days. It gets bigger and bigger and it happens all the time. It happens after the correction or retrace ends.
A retrace just ended lasting a total of 8 days. From 25-July through 2-August. A very short retrace but the next will be a higher high and the bullish wave will be nothing like the retrace. The bullish side is many times stronger and the market will blow up next. It can take some time to start but as momentum grows, expect to see a pattern of rising prices.
Thank you for reading.
Namaste.

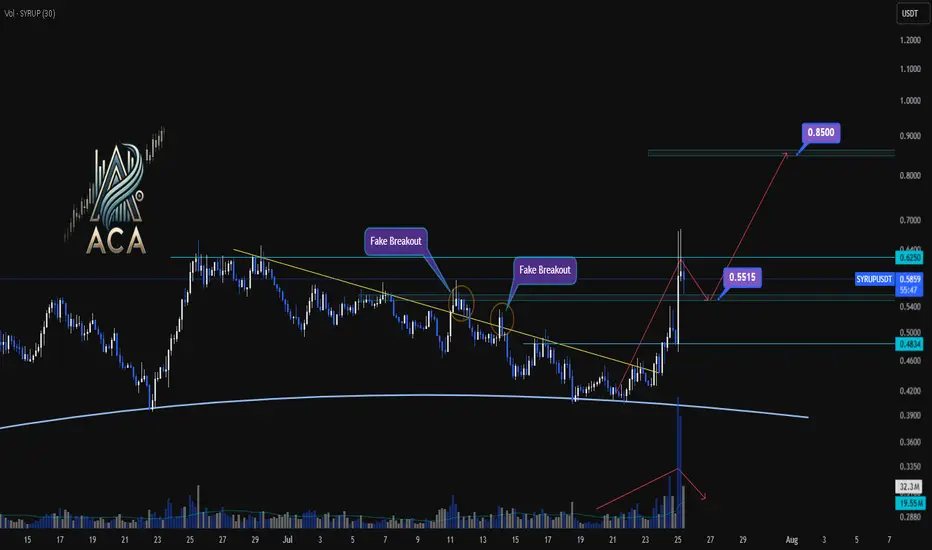
SYRUPUSDT 4H Chart Analysis | Trendline Breakout & Next MovesSYRUPUSDT 4H Chart Analysis | Trendline Breakout & Next Moves
🔍 Let’s break down the latest action on the SYRUP/USDT 4H chart and pinpoint what comes next as trend and momentum cues line up for traders.
⏳ 4-Hour Overview
- The recent breakout above the key trendline was backed by a surge in volume, providing clear momentum confirmation and pushing price toward resistance.
- Price has already reached 1.5R of the initial breakout target, a strong sign the trend is in motion.
- Upon touching the $0.6250 resistance, momentum cooled, with volatility decreasing — a classic consolidation phase after a high-energy move.
🔻 Correction & Structure
- With volume subsiding and momentum slowing post-$0.6250, we’re now expecting a corrective move down toward $0.5515.
- This retracement zone will be critical to watch for higher low formation – a bullish structural signal if supported by volume confirmation.
🔺 Long Setup:
- Should SYRUP reclaim and break above $0.6250 after setting a higher low at $0.5515, and with renewed volume, we could see another strong leg higher.
- The next major resistance sits around $0.85 — this aligns as a logical upside target based on the range extension.
📊 Key Highlights:
- Trendline breakout with sharp volume spike = momentum confirmation.
- 1.5R reached before first deep pullback; structure remains bullish above $0.5515.
- Watch for a higher low and subsequent break of $0.6250 with volume to confirm the next move to $0.85.
🚨 Conclusion:
SYRUP’s chart is at a pivotal juncture: a constructive pullback to $0.5515 could set up the next wave higher if supported by volume. A confirmed breakout above $0.6250 targets $0.85 — stay patient and wait for volume signals at key levels.
Maple (SYRUP) Bullish Impulse, Final Target & Correction Support+553% since its 7-April bottom, but the third wave is already in. Notice how the volume is super high until 15-May but then it drops as prices continue higher. This means that only the fifth wave remains. After the completion of the fifth wave there should be a correction before additional growth.
The two main targets for this current bullish impulse are shown on the chart but it can go higher of course. A number came up around $1.23 but this chart is just too young.
Once the correction starts, the main support will be where the 1.618 Fib. extension is now. Can wick lower but the 0.786 isn't likely to be tested. Maple Finance SYRUP.
Namaste.
