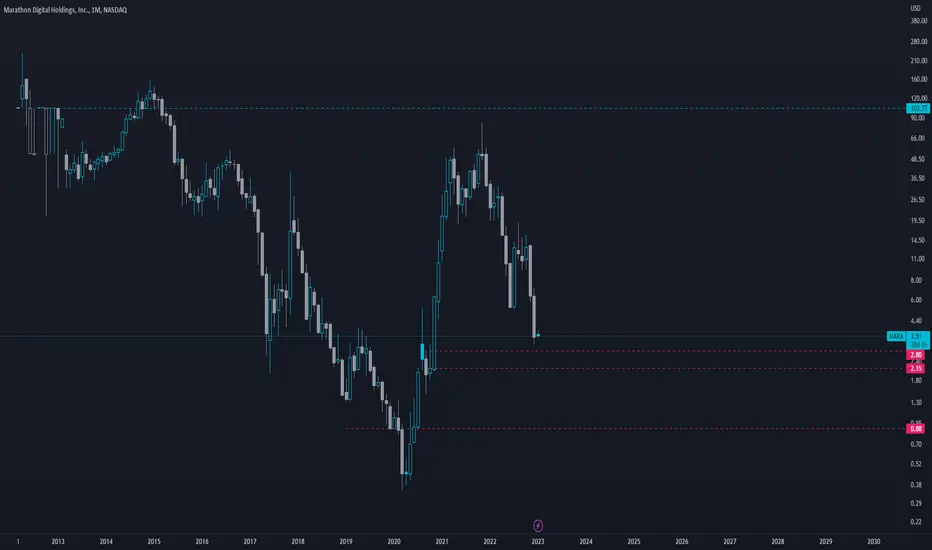
MARA cant catch a break, macro outlook still strongNASDAQ:MARA found support at the golden pocket and channel lower boundary just above the S1 pivot.
Price appears to be in an Elliot wave B, restricting upside targets to the 1:1 Fibonacci extensions at $106. Price is below the weekly 200EMA and pivot.
🎯 Terminal target for the business cycle could see prices as high as $106 based on Fibonacci extensions
📈 Weekly RSI is nearing oversold with room to fall
👉 Analysis is invalidated if we close back below wave (II)
Safe trading
MARATHON

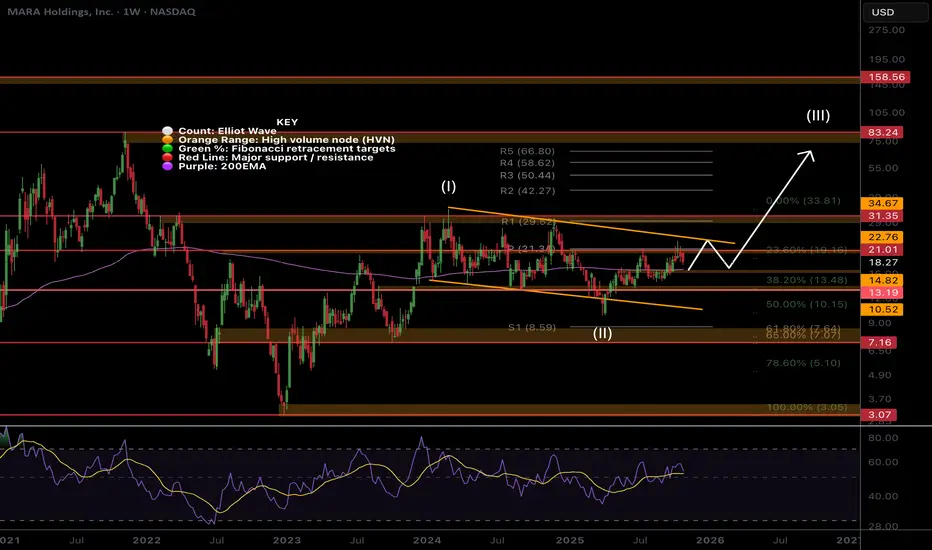
MARA boring... Investors cant waitMara has the potential for a strong move alongside Bitcoin but has ultimately been boring. Investors struggle the most with boredom and see is as negative and bearish. This is not the case and it could just be accumulating towards a strong breakout.
Price is stalling at the weekly pivot as expected but is above the 200EMA- a great buy spot. Wave (II) appears complete at the 0.5 Fibonacci retracement with a swing below the lower boundary trend-line. Wave 3 of (III) appears to be underway so I am looking for an aggressive breakout to the upside once we clear the current resistance. The R1 pivot is the first target at $30 where the last bit of major resistance is. Wave (III) has a target of $83 at the next major High Volume Node resistance, just above the R5 pivot.
🎯 Terminal target for the business cycle could see prices as high as $80 based on Fibonacci extensions and High Volume Nodes
📈 Weekly RSI is at the EQ.
👉 Analysis is invalidated if we close back below wave 2 at $9.50.
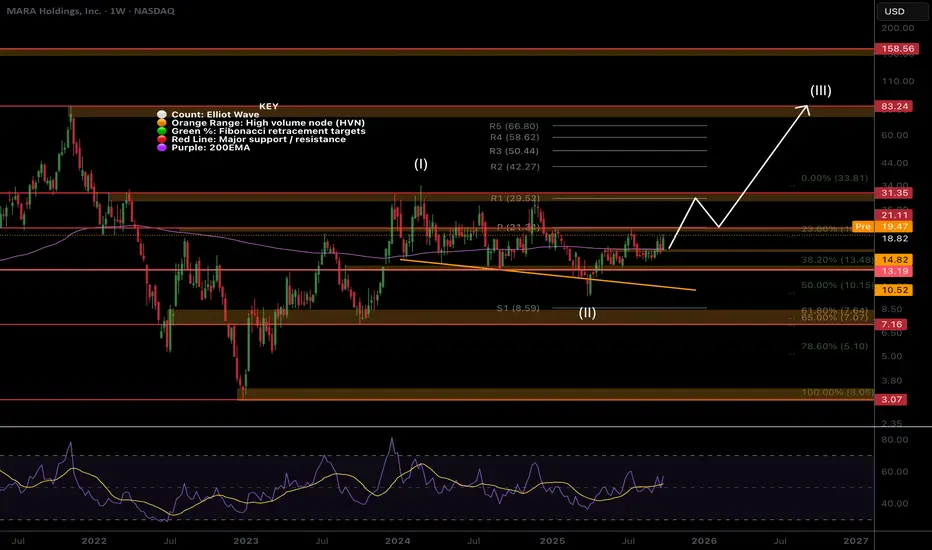
MARA Strong breakout incomingNASDAQ:MARA is stalling at the weekly pivot as expected but is above the 200EMA. Wave (II) appears complete at the 0.5 Fibonacci retracement with a swing below the lower boundary trend-line.
Wave 3 of (III) appears to be underway so I am looking for an aggressive breakout to the upside once we clear the current resistance. The R1 pivot is the first target at $30 where the last bit of major resistance before the stronger breakout should come in, the High Volume Node.
Wave (III) has a target of $83 at the next major High Volume Node resistance, just above the R5 pivot.
Analysis is invalidated if we fall below $10. RSI is at the EQ with plenty of room for upside
Safe trading

MARA Ready To Finally Move towards $30?MARA’s Elliot Wave (II) retracement front run the Fibonacci golden ratio and has now overcome the weekly 200EMA. The weekly pivot looms as strong resistance $21 just above the first target of our recent trade signal. If wave (III) is underway we should see price begin to accelerate alongside Bitcoin with an initial target of $31 followed by $80 High Volume Node.
Expect price to consolidate at the wave (I) resistance $30 for a while. Weekly RSI is crossed bullishly at the range EQ giving it room to move bullishly!
Safe trading
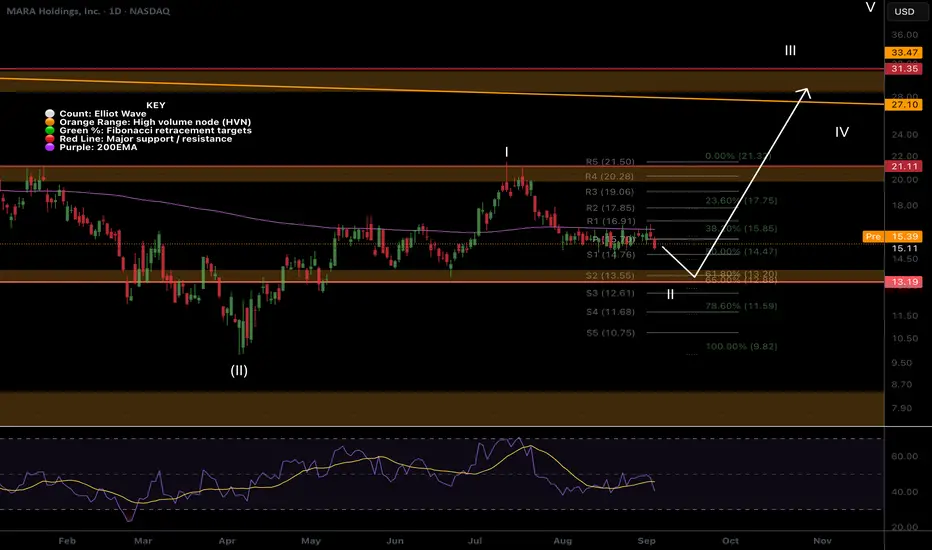
$MARA One More Push Lower to the Golden Pocket?NASDAQ:MARA was rejected hard on the 6th test of the daily 200EMA! The probability of a breakthrough is huge but it just cant overcome supply as people want out of this underperforming Bitcoin Miner! Just the recipe we need for explosive upside, capitulation.
The S2 pivot and Fibonacci golden pocket should see strong support and potential bottoming of wave II, $13.20
Daily RSI is working its way into oversold which will line up nicely for a high probability trade set up I will share in my trading signals substack.
Safe trading
Marathon Digital: Strong!We expect the MARA price to continue to rally during the blue wave (x). Only when the high is placed a little closer to the resistance at $31.30 should there be a sell-off into our magenta Target Zone (between $16.35 and $9.86), which completes the same-colored wave (ii) correction. Within this range, investors can open long positions, whereby stops could be placed around 1% below the lower edge. Once the low is set, the price should rise above the resistance at $31.30. Only our 33% probable alternative scenario calls for a more bearish development: it still places the stock in the green wave alt. (2)

MARA Potential Bounce Off Bullish Ascending Triangle MARA has tested the lower bounds of the ascending triangle before, so a bounce next week has potential. If one occurs a test of the upward bound of the triangle is likely, with a breakout also in speculation as the upward bound has been tested many times already. But, if a bounce occurs and then immediately retraces and breaks through the lower bound, I think MARA will continue on the downtrend.

MARA, crypto miners bubble hypothesis. Rollercoaster P.A.Interesting concept @ MARA and miners. How stocks move conceptually, dont need to take it at face value. When public gets in and it's euphoric is a bubble indicator. Perception of stock to fly etc. And then return to earth.

MARA Ready for blast-off?!?Good day traders! Are we on the cusp of miners exploding to the upside? I think so!! We are about to embark on wave 3 impulse and based on last cycle, all indicators point to $200 target.

MARA Bull Flag, Simple TA based on BTC movement. If BTC runs up higher, I see no reason as to why MARA would not play out on this bull flag. We are crossing the EMA ribbon and setting up nicely. Not financial advice, DYOR.

Marathon Digital (MARA) Bucks Production Dip with 23% SurgeMarathon Digital Holdings Inc ( NASDAQ:MARA ) has defied expectations with a remarkable 23% surge in its stock value, despite a notable 42% decline in Bitcoin production for the month of January. The company's resilience in the face of adversity has captured the attention of investors, highlighting the enduring allure of the cryptocurrency market.
The surge in Marathon's ( NASDAQ:MARA ) shares comes as Bitcoin, the bellwether of the digital asset space, inches closer to the $47,000 mark. This upward trajectory has catalyzed a broader rally in U.S. stock market crypto-related companies, underlining the symbiotic relationship between Bitcoin's price movements and the performance of associated entities.
January's production figures for Marathon tell a tale of challenges and perseverance. Despite encountering weather-related disruptions and equipment failures leading to site outages, the company managed to mine 1,084 BTC. While this represents a substantial decline from December 2023 figures, the market's response underscores investor confidence in Marathon's ability to navigate adversity and capitalize on favorable market conditions.
The positive momentum observed in Marathon's stock is reflective of broader trends within the crypto industry. Canaan Technology ( NASDAQ:CAN ), Bitdeer (BTDR), Coinbase ( NASDAQ:COIN ), and MicroStrategy ( NASDAQ:MSTR ) have all witnessed significant gains, buoyed by Bitcoin's ascent. This collective surge underscores the growing mainstream acceptance and adoption of digital assets as viable investment vehicles.
Notably, the enthusiasm surrounding Bitcoin's price surge has been further bolstered by substantial trading volumes observed in spot Bitcoin exchange-traded funds (ETFs), exceeding $1 billion. Institutions such as BlackRock and Fidelity have emerged as key players in this arena, signaling a maturing market ecosystem and institutional confidence in the long-term viability of cryptocurrencies.
Moreover, comments from Federal Reserve officials hinting at potential rate cuts later in the year have added fuel to the market's bullish sentiment. The prospect of looser monetary policy has enhanced the attractiveness of cryptocurrencies as a hedge against inflationary pressures, further driving investor interest in the digital asset space.
In conclusion, Marathon Digital's ( NASDAQ:MARA ) resilience in the face of production challenges serves as a testament to the dynamism of the cryptocurrency market. Against a backdrop of macroeconomic uncertainties and operational hurdles, the company's ability to capitalize on Bitcoin's rally underscores the enduring appeal of digital assets as a lucrative investment avenue. As the landscape continues to evolve, Marathon's ( NASDAQ:MARA ) trajectory serves as a compelling case study in adaptability and opportunity within the burgeoning crypto ecosystem.

MARA Marathon Digital - Bitcoin play 50-100%?MARA is on the move again. Longterm 50%-100% gain to get back to previous highs. Also watch BTC cryppto also to see if Bitcoin will run to indicate MARA moves coming.

Marathon Oil Corporation: Bullish Bat with Bullish DivergenceMRO on the intraday is showing signs of Bullish Divergence on both the MACD and RSI at the potential HOP level of a Bullish Bat. If this plays out I think it could make a move up towards $25

Marathon Digital Mining Stock Head and Shoulders pattern
Simple Head and Shoulder pattern playing out before the BTC halving. Prior to last ATH for MARA there was a Head and Shoulders that played into the ATH. You can see around $20 MARA would break the neckline and then there is a bit of resistance before hitting ATH.

MARA Squeeze ItIve been watching this stock for quite a while, and waited for a good opportunity to hold shares from $7. Weve got a few levels above us that need to be confirmed and forming a bullish falling wedge reversal.
Target approx HKEX:17 - HKEX:18
Only time will tell.

MARA heading to $20NASDAQ:MARA is in a steady uptrend and the price is sitting above the 200 and 50 moving averages. With the ~300% spike in Bitcoin transaction fees due to the BRC20 tokens many of the miners should do really well in May and possibly the next few months. Looking for the price to hit $15 and then head to $20 range where the next area of resistance is.

Marathon Digital is the future Bullish DivergenceSimple Divergence. If btc trends higher this should follow closely.

3 reasons to buy one to stayVanguar, BlackRock, and today George Soros buying a stake in MARA, one reason $170 USD price

$MARA next move = higher $10-12Even though the chart looks like it's forming a H&S top, I think the next move is likely to be higher before we see a breakdown.
I could see $MARA bouncing somewhere between here and $6.80-6.60, then putting in one more move higher to the two resistances above.
Let's see if it plays out this week.
Marathon Digital is the futuretotally kidding but thats besides the point, all these blockchain companies should have some support lower once btc finally turns around so they can show profits again, most of them are mining behind the scenes so once they lose all this value therye a decent punt depending on how you look at things. would keep an eye out and start accumulating this sub $1, good lukc traders
"Cryptocurrency Turmoil: The Ups and Downs of Coinbase and Other"Cryptocurrency Turmoil: The Ups and Downs of Coinbase and Other Digital Asset Companies"
Coinbase is a company that helps people buy and sell digital coins called cryptocurrencies. It became a public company in April 2021 and was worth a lot of money at the time. But lately, the value of cryptocurrencies has been changing a lot and it's made it hard for Coinbase to make as much money as it used to. Another company that helps people trade cryptocurrencies, called FTX, had to close down because it was having financial problems. This made people worried about investing in cryptocurrencies and caused the value to go up and down more than usual. Some people try to make money by betting that the value of a company's stock will go down, and they're called short sellers. They've been trying to make money by betting that Coinbase's stock will go down, and they've had some success because the stock has gone down a lot this year. Other companies that are related to cryptocurrencies have also seen their stock go down and have had more short sellers trying to make money off of them. There is a tool that helps people see how much demand there is for borrowing a company's stock to sell it, and it's called "utilization." Utilization for Coinbase has gone up recently because more people are trying to borrow its stock to sell it. Short sellers have to pay a fee to borrow the stock, and this fee has gone up a lot for Coinbase recently. There are also other companies, like MicroStrategy and Marathon Digital Holdings, that have seen their stock go down and have had more short sellers trying to make money off of them. The fees to borrow their stock have also gone up.

Mara possible break out. Mara: the more conservative approach in my opinion would be to wait for the gap fill below prior to starting to accumulate as price consolidates and hopefully starts to move to the upside.
only for illustration purposes not trading advice.

You should buy $MARAABC correction ended @ fibonacci 50% and 1.236 fib extension. And we see an impulse from that level. Marathon is a digital asset technology that supports and secures Bitcoin ecosystem. Expect at least 10X return in the next bull run.
