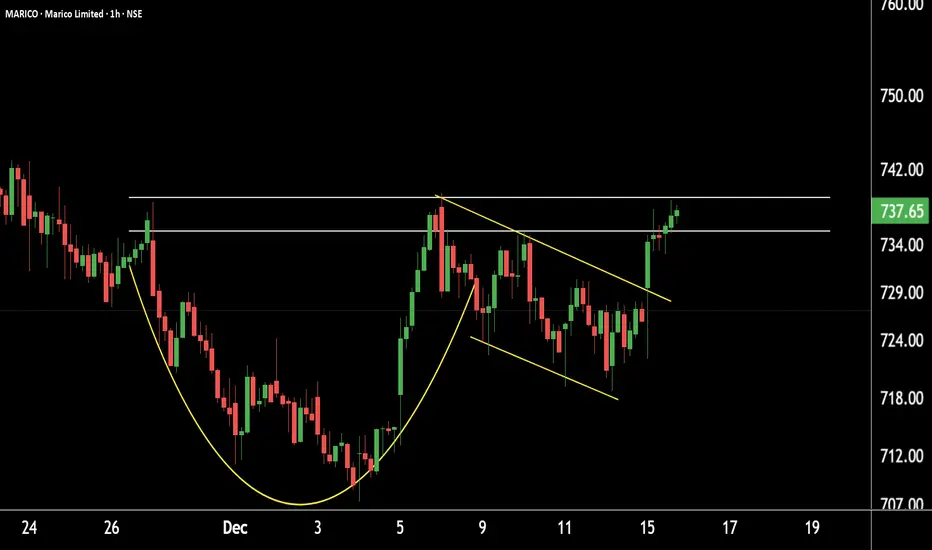
MARICO Technical Setup | Cup & Handle Pattern Developing .MARICO – Technical View (1-Hour Timeframe)
MARICO is forming a Cup & Handle pattern on the 1-hour chart and is currently trading near the key resistance zone of 740–745.
The stock has a strong support base around 700–710, indicating underlying strength.
Upside Scenario:
A decisive breakout and sustained move above 740 could open the door for an upside target near 770.
Confirmation and sustainability above resistance will be crucial for further momentum.
Maricolong
MARICO IS READY TO IGNITE A BULL FIRE!This is the daily timeframe chart of Marico.
The stock is approaching a strong support zone near the 700–710 level and resistance 780-790 and lop resistance near the 740-750.
If Marico sustains above this zone, it may potentially move towards higher price levels.
Thank you.

MARICO Under Pressure — Sharp Fall on the Charts!This is the daily timeframe chart of MARICO.
MARICO is trading within a well-defined parallel channel and is currently falling from the upper resistance zone. This sharp decline may pause near the channel support.
The stock continues to respect the structure, with a key support zone around 700–710 and resistance in the 775–785 region.
If the current weakness extends, we may see a further drop toward the support area, followed by a potential bounce from those levels.
Thank you!!

MARICO--@Neckline??This stock is likely to test the demand zones.
now price is near to neckline, this is the key level, once breaks a quick retest to the support is observed.
multiple rejections on topside is observed in this stock at right shoulder....
keep looking for buyside...if it reaches to the support levels.
price is likely to be between these neckline and support levels, and gives us breakout.

MARICO Positional Buy IdeaAs per my analysis, if NSE:MARICO upcoming any 45min closed above level of 483.00. We can see huge short covering and fresh buy entry. Buy level would be 485-490 with stop loss of 465 (20-25 points risk). My expected upside target will be 501, 520 & 540. It may take 1-2 weeks to get targets.
Note: This is my personal analysis, only to learn stock market behavior. Thanks.

MARICO BUY IDEA 18.01.2023NSE:MARICO has been closed above resistance of 502. My idea is to take entry at 502 with stop loss of 495 (-7 Points). My up side target will be 522 (+20 Points).
Note: This is my personal analysis, only for learning. Thanks.


Marico Trade setup Idea - 15 september 2022Marico has shown a breakout of the range after quite some time, if this momemtum continous then we could see Marico reaching 550 levels again.
I would go long if it crosses 535 levels, with a stop of 3-4 and target around 550.

BUY MARICO at CMP 542 tgt 575 , 615 sl 500marico is 3rd time attempting to cross over above all EMAs. and also ichimoku cloud . RSI is also above 60 All the factors are supporting a good move in Marico. Always keep strict stop loss


MARICO New ATH MARICO LTD made another new ATH on Friday
Very strong uptrend
Should see a follow through to new highs now


MARICO - BREAKOUT from 4 months RangeStock did a good breakout from 4 months range.
Breakout type: Decisive
Breakout Volume: Huge
Now sustaining the above-the-range, stock can move towards 460 and 480 levels.

MARICOCurrently MARICO stand on major support 390 if this support break than we confirmed as a downtrend.

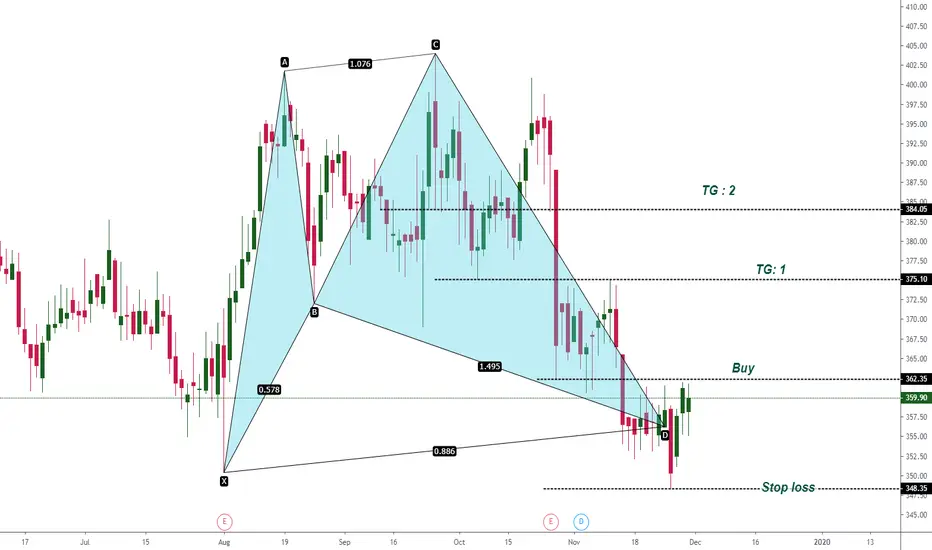
R-0223 Short Term Cash Buy MARICO @362.40-364.4 SL 353.6 TGT 381Short Term Cash Buy MARICO @362.40-364.4 SL 353.6 TGT 381(Short term trend remains positive)
#1. Pivot break out 359.60
#2. MACD cross over indicates bullish moment.
#3. Next resistance is 386 so book profit in the range of 280-385.
#4. Above VWAP @361 which further indicates bullish moment to continue.
#5. Ichimoku cloud break out so STAY LONG.

R-0144 Cash Buy MARICO @366.00-369 SL 360.3 TGT 382Short Term Cash Buy MARICO @366.00-369 SL 360.3 TGT 382
About to cross TK line + MACD cross over and cloud break out so we expect it to move in uptrend go LONG.

R-0124 Short Term Cash Buy MARICO @366.70-368.7 SL 358.3 TGT 386Short Term Cash Buy MARICO @366.70-368.7 SL 358.3 TGT 386
Above VWAP and corrected from day's high followed by TK cross over so go LONG.

MARICO - Bounce back from bottom line - Bullish on all chart#MARICO is trending under the channel and has strong support on 20EMA and bottom support line. After hitting bottom support stock is start moving upwards and Today 50SMA crossed above 200EMA. ATR is decreasing and stock in narrow range since 4 day.
Showing Bullish result in Technical Parameter:
CCI is treading UP
RSI is treading UP
50SMA crossed above 200EMA
William %R is treading UP
+DI crossed above -DI
New Long position
----------------------------------------------------------
Support : 340 and 331
Breakdown : 344 (OR Gap down opening)
LTP : 348.65
Breakout : 351 (OR GAP UP opening)
Short Target : 355 and 358
----------------------------------------------------------
Positive & Negative Point:
1) Very Bullish in Daily chart.
2) Very Bullish in Weekly chart
3) Very Bullish in Monthly Chart
----------------------------------------------------------
(Disclaimer: This is only for educational purpose and paper treading.)

MARICO - Triangle BreakoutNSE:MARICO has taken support at the support zone, getting ready for a triangle breakout.


Marico Ltd. Swing Trade setupMarico is in good Position for swing trade setup. Explain everything on the chart