BTCUSD (15M) – Bullish Continuation SetupBITSTAMP:BTCUSD
🚀
Structure | Trend | Key Reaction Zones
Price rebounded strongly from the yellow demand zone, confirming bullish structure formation.
A descending channel breakout is forming, showing potential for continuation.
The 113,000–112,000 range is acting as a short-term support and accumulation base.
Market Overview
BTC has regained momentum after tapping into the demand zone, showing strong buyer reaction and a shift in structure. If the market maintains support above 113,000, we can expect continuation toward the 114,500–116,000 range. Retracements toward 112,800–112,000 may offer fresh long opportunities for continuation plays.
Key Scenarios
✅ Bullish Case 🚀 → 🎯 Target 1: 114,500 → 🎯 Target 2: 116,000
❌ Bearish Case 📉 → Invalidation below 111,800
Current Levels to Watch
Resistance 🔴: 114,500 – 116,000
Support 🟢: 112,000 – 111,800
⚠️ Disclaimer: This analysis is for educational purposes only. Not financial advice.
Marked

GOLD (XAUUSD) 30-MIN – Crucial Retest at Support ZoneTVC:GOLD
Market Overview
The market has tapped into a previous demand area after a deep correction from the top. Liquidity from both sides is cleared, leaving room for a clean directional move. If bulls manage to defend the current yellow zone, we could see a short-term recovery phase toward the mid-structure. However, a clean break below this block may lead to another sharp bearish leg into the lower OB near 3,910 — completing a full retracement before buyers return stronger.
Key Scenarios
✅ Bullish Case 🚀 → 🎯 Target 1: 3,989 mid-zone | 🎯 Target 2: 4,020 | 🎯 Target 3: 4,058 top rejection retest
❌ Bearish Case 📉 → 🎯 Target 1: 3,940 | 🎯 Target 2: 3,910 deeper OB zone
Current Levels to Watch
Resistance 🔴: 3,989 – 4,058
Support 🟢: 3,950 – 3,910
⚠️ Disclaimer: This analysis is for educational purposes only. It is not financial advice

Bitcoin Ultimate Bear Marked PredictionThe only pattern i can find and make most sense of is the falling wedge. The white lines on the chart is the where i think its most support or resistant is right now. One of the white support lines dates all way back to 2017 and 2019 and acted as support and resistant, and are the only thing stopping btc too 17k right now. A really historic line that i think will be broken. (Every line is 100% correct as i have used two coordinates per line and exact on the wick.)
The lines for the falling wedge may get moved over time because as we all now the macro economic is bad and going to be badder. S&P 500 from 2007 house marked crash took from top to bottom 510 days.I think this bear marked gone be a little bit longer and i think the bottom is between 10-12k. The marked will turn when inflation is going SIGNIFICANTLY DOWN. The economy need to be super super bad if we go below that. So i think we will get our bottom in mid 2023. I am full cash around 40k and gone go mayhem when I feel the marked has bottomed.
PS. Wrote this in a hurry

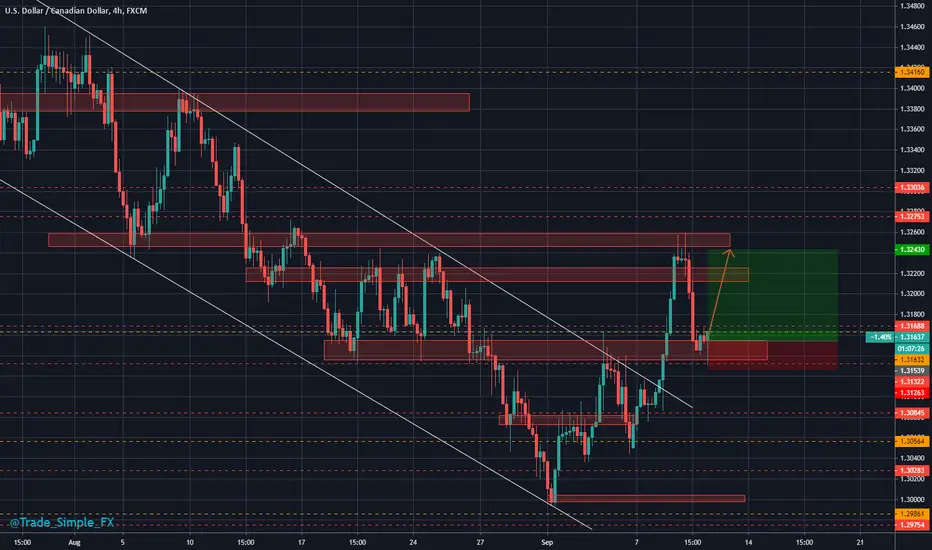
USDCAD H4 - Long Trade SetupUSDCAD H4 - Channel break and retest has almost been complete, just waiting for that bounce continuation. First target would be previous high and then anything beyond that could be trialed if new highs are set.