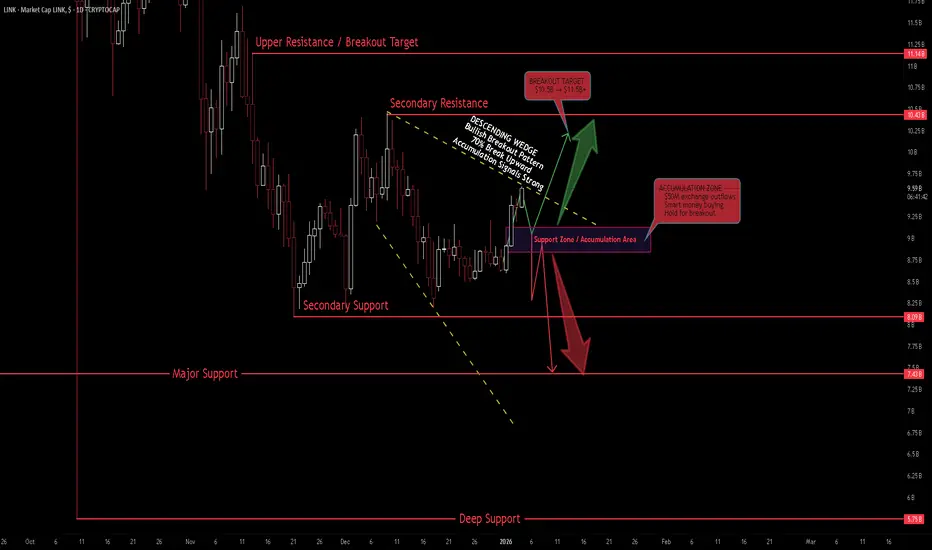
LINK Market Cap - Descending Wedge at $9.25B | Bullish Breakout Executive Summary
Chainlink (LINK) market cap trading at $9.25B within a descending wedge on the 1D timeframe. Price holding key support while forming bullish structure. Strong accumulation signals with $50M in exchange outflows from Binance. Expecting bullish breakout past the highs as selling pressure fades and smart money accumulates.
BIAS: BULLISH - Breakout Structure Forming
Current Market Context
LINK broke 21-day MA - altcoins looking for "upward run" in next 2-3 months
$50M in exchange outflows from Binance (accumulation signal)
Holding 200-day MA and long-term trendline support
Grayscale highlights LINK's role in tokenization
Top DeFi project by development activity
Cleaner setup than Hyperliquid heading into 2026
Fundamental Strength
Strong connections with policymakers and financial institutions
Founder met with US lawmakers, Federal Reserve, key political figures
Key player in compliant crypto projects
Leading role in tokenizing real-world assets (RWA)
Ranked top DeFi project by GitHub development activity
Positioned well for regulatory clarity in 2026
Technical Structure - 1D
Descending Wedge Pattern:
Falling resistance and support trendlines (yellow dashed)
Wedge narrowing - compression before breakout
Typically bullish reversal (70% break up)
Price holding support zone
Key Levels (Market Cap):
Resistance:
$9.5B - Immediate resistance
$10.5B - Secondary resistance (red line)
$11.5B - Upper resistance / breakout target
Support:
$9.0B - $9.25B - Current support zone (purple)
$8.0B - Secondary support (red line)
$7.4B - Major support (red line)
$5.7B - Deep support (red line at bottom)
SCENARIO ANALYSIS
BULLISH (Primary): Wedge Breakout
Break above descending wedge resistance
Target $10.5B, then $11.5B+
Accumulation signals support breakout
Altcoin season catalyst
BEARISH: Wedge Breakdown
If support at $9.0B fails
Drop to $8.0B, then $7.4B
Invalidates bullish thesis
My Assessment
Descending wedge with strong accumulation signals. $50M exchange outflows = smart money buying. Holding long-term support while selling pressure fades. Bullish structure forming for breakout past the highs. LINK positioned well for 2026 with regulatory clarity and RWA tokenization narrative.
Strategy:
Long on wedge breakout confirmation
Target $10.5B, then $11.5B+
Stop below $8.0B support
Accumulate at $9.0B-$9.25B support zone
Let me know what you think in the comments below for the next move!
Marketcap
Is This Chart Signaling the Next Alt Season?Hello,
If you want to recognize an alt season early, watch this chart: *TOTAL3-USDT/BTC*. It tracks the total market cap of all cryptocurrencies excluding Bitcoin and Ethereum, priced in Bitcoin terms. When this line rises, it means alts are gaining strength against BTC—the classic fingerprint of an alt season in the making.
Right now, we’re seeing consolidation after a prolonged downtrend, hovering around the 0.30s level. This isn’t just noise—it’s accumulation. Historically, breakouts from this pattern lead to powerful alt runs, especially when combined with a macro tailwind.
And that tailwind is forming. With interest rates poised to decrease, liquidity begins flowing back into risk assets. Lower rates mean cheaper money, which often moves from stablecoins and Bitcoin toward higher-growth, higher-beta altcoins. This cash rotation is the engine of an alt season: money seeking opportunity, narrative, and momentum.
Watch for a sustained move above 0.60—that could be your signal. Until then, hold support at 0.20s-0.30s and keep an eye on Fed policy and Bitcoin dominance. When this chart turns up, it’s not just a technical move—it’s a liquidity shift.
Trade wisely. Follow the flow.

Crypto Made Simple: Market Cap, Volume, and Price MovesMarket cap in simple terms
Market cap is the total “value” of a coin: price per coin × number of coins that exist and trade freely. If a coin has 10 million coins and each is 2 dollars, the market cap is 20 million dollars.
Think of market cap as the coin’s “size,” not its safety score. Big coins (large cap) are like big companies: well known, usually easier to trade, but they can still drop a lot in bad markets.
Volume as the coin’s heartbeat
Volume is how much of the coin is bought and sold in a time period, usually 24 hours. If a coin has 1 billion dollars traded in a day, that means a lot of people are actively buying and selling it.
High volume usually means you can get in and out more easily without moving the price too much. Low volume can mean few traders, bigger spreads, and the price can jump or crash from just a few larger orders.
Price trends without the drama
Price trend is simply how the price has been moving over time: up, down, or sideways. In crypto, prices can move a lot in one day or one week, so very short‑term moves are often noisy and emotional.
Looking at weekly or monthly charts instead of only the 5‑minute chart helps you see whether a move is just short‑term noise or part of a bigger trend. A 10% move in a week can be normal in crypto, even for big coins.
Simple rules of thumb
Do not assume “big market cap = safe forever”; big coins can still fall a lot.
Always check volume; avoid chasing moves in very low‑volume coins where a few trades can fake the chart.
Do not overreact to minute‑by‑minute moves in a 24/7 market; focus more on the bigger trend and your own risk plan.

FireHoseReel | Total3: One Breakout Could Flip the Entire Market🔥 Welcome FireHoseReel !
Let’s break down what’s happening with TOTAL3 and see how the altcoin market is shaping up right now.
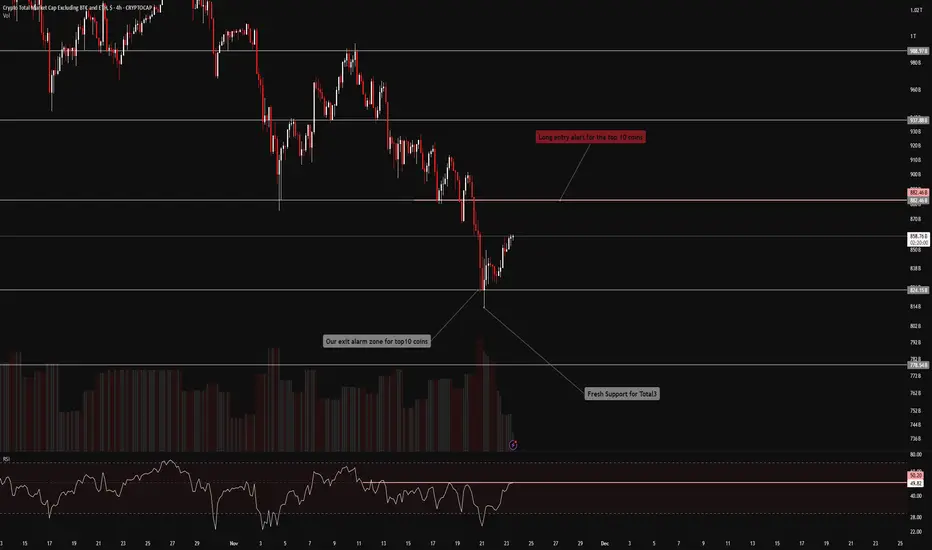
⭐ TOTAL3 Market Structure Update
The altcoin market (TOTAL3) has formed a solid support base around $824B after the recent pullback and is now pushing upward toward its major resistance at $882B.
A clean breakout above this zone could spark a broader bullish continuation, activate long triggers across top altcoins, and shift the market into a risk-on phase.
📊 RSI Momentum
The RSI is currently battling the 50 level, which has repeatedly acted as strong static resistance.
A confirmed breakout above RSI 50 would strengthen bullish momentum and support upward continuation — most likely during the China open session, where volatility usually increases.
🎯Impact on Top Altcoins
If USDT dominance declines, the top altcoins are likely to gain momentum quickly.
This can accelerate breakouts, create strong bullish impulses, and open up high-probability profit opportunities as liquidity rotates back into alts.
🧭 Trading Perspective
This is the kind of environment where staying close to the charts is essential.
Wait for index confirmations before entering new positions.
A potential altcoin rally could begin from these zones — and with proper risk management, layered entries across multiple altcoins can be highly effective.
🛞 Risk Management & Disclaimer
Please remember to always use proper risk management and position sizing. Nothing in this analysis is financial advice. The market can change quickly, so always trade based on your own strategy, research, and risk tolerance. You are fully responsible for your own trades.
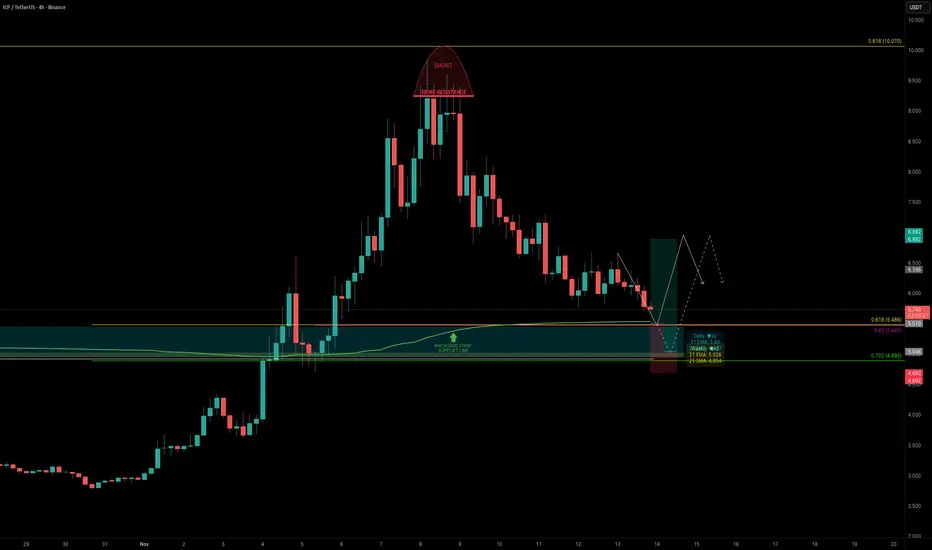
ICP — Identifying the Next High-Probability Long OpportunityICP had a great start to November, rallying over +250% in just 8 days before topping out just below the 0.618 Fibonacci retracement (~$10), right at the $3B MC resistance.
Over the past 5 days, ICP has retraced -42% from the high. The key question now: where is the next high-probability long opportunity?
Key Confluences around the $5.5 Zone
One level that stands out strongly is the $5.5 zone, where several major supports align:
0.618 Fib retracement of the entire +250% rally
0.85 Fib retracement of the smaller internal wave aligns right with the major 0.618 level
Anchored VWAP (280 day) clustering right around $5.5, adding volume-weighted support
Quarterly VWAP currently sits near $5.62
Daily 21 EMA at $5.45
Weekly 21 EMA/SMA both at around $5
$5.5 = $3B market cap
Point of Control (POC) of the past ~280 days sits around $4.9, marking it as the final major support layer below
🟢 Trade Setup Plan
Entry Zone: $5.6 – $5.0
Stop-Loss: Below POC
Targets:
TP1: $6.0
TP2: $6.9 (VWAP resistance / 0.382 Fib)
TP3: 0.618 FR
Risk/Reward: 1:2+, depending on entry precision
🔍 Indicators used
Multi Timeframe 8x MA Support Resistance Zones → to identify support and resistance zones such as the daily/weekly 21 EMA/SMA.
➡️ Available for free. You can find it on my profile under “Scripts” and apply it directly to your charts for extra confluence when planning your trades.
_________________________________
💬 If you found this helpful, drop a like and comment!
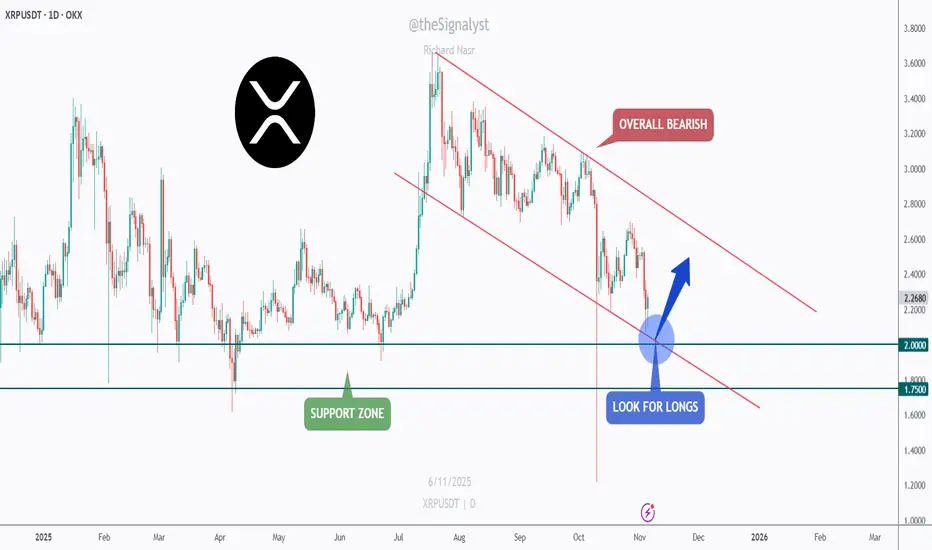
XRP - Watching the Confluence Zone for a Bullish Rebound!📉XRP has been in a clear bearish channel for months , forming consistent lower highs and lower lows.
However, the current structure is approaching a critical confluence zone, where the lower bound of the red channel meets the major green support area between $1.75 and $2.00.
⚔️As long as this intersection holds, I’ll be looking for potential long opportunities, anticipating a short-term bullish correction toward the upper boundary of the channel.
This setup offers a clean risk-to-reward opportunity if the bulls manage to defend the zone and regain momentum.
If the support gives way, further downside could follow, but for now, this area remains a key decision point for XRP’s next move.
⚠️ Disclaimer: This is not financial advice. Always do your own research and manage risk properly.
📊All Strategies Are Good; If Managed Properly!
~Richard Nasr
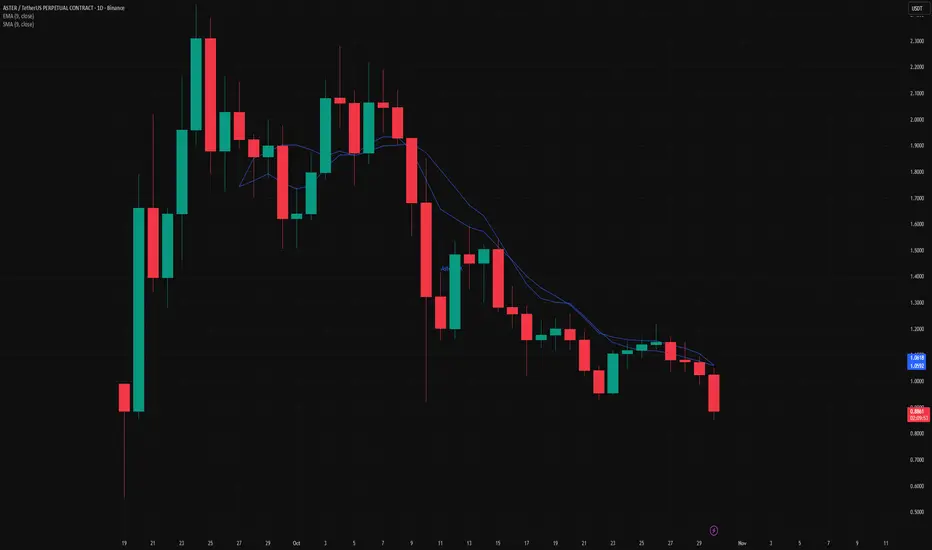
Why you should actually be bullish on ASTERASTER price action has people confused.
Short-term thinking always blinds investors.
ASTER went from $0 to $4B market cap in one week while the market dumped. It is six weeks old, already top 45, and still above $2B market cap.
The Dex has done 2.85T in trading volume with over 5M users. The team announced that 70–80% of all trading fees go to buybacks of $ASTER. This changes the math. Strong volume. Strong user base. Strong tokenomics.
ASTER is the Perp DEX of Binance, backed by CZ and YZILabs. HYPE reached a $20B market cap in under a year. ASTER is following the same pattern with better fundamentals.
Key points: $4B+ market cap in week one 2.85T total trading volume 5M+ users 70–80% fee buybacks Binance ecosystem backing DEX will outlast CEX.
Hold this long term.
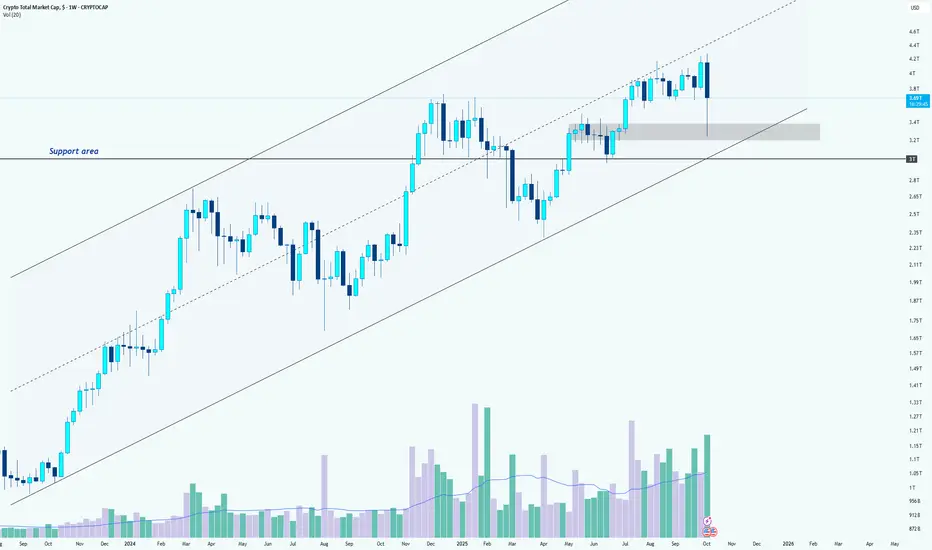
Crypto Total Market Cap AnalysisHi Team!
The crypto market continues to show impressive strength, maintaining its position inside the long-term ascending channel. Despite the recent correction, the overall structure remains bullish as long as the lower boundary of this channel holds.
After facing resistance near the upper line of the channel, the total market cap experienced a healthy pullback, which brought it close to the mid-zone of the structure. Buyers stepped in strongly from that area, suggesting that market participants still see dips as opportunities rather than warning signs.
The key support zone lies between 3.1T and 2.84T USD, a region that has acted as both a breakout base and a demand area in the past. As long as this zone remains intact, the broader bullish momentum is likely to continue, keeping the medium- to long-term outlook positive.
If price action stays within the rising channel and the 2.84T support area holds, the total crypto market cap could soon retest the upper trendline, potentially pushing toward new highs.
However, a confirmed breakdown below 2.84T would signal a shift in structure, opening the door to a deeper correction phase.
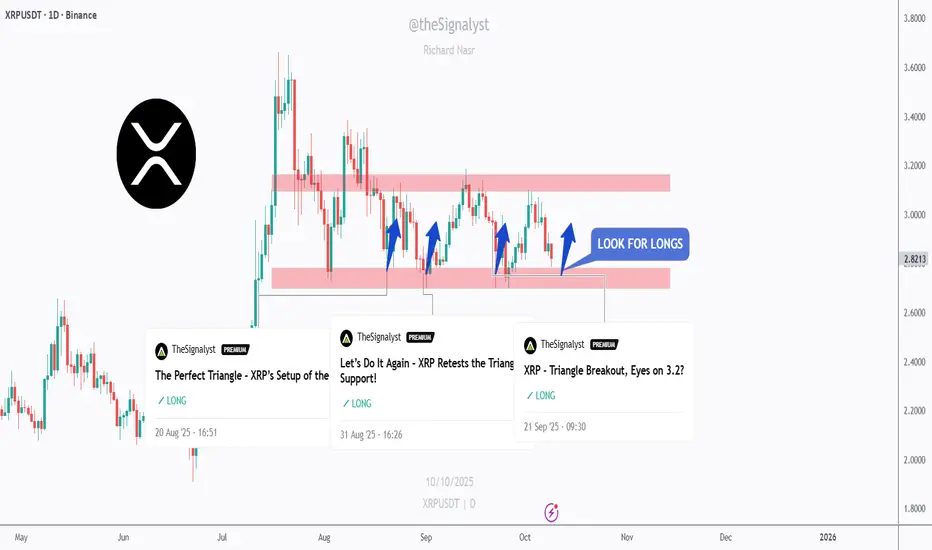
$XRP – Let’s Do It Again!!XRP is once again retesting its daily support zone around $2.60–$2.80, the same level that triggered multiple bullish impulses in recent months.
As long as this red support zone holds, I’ll keep looking for long setups targeting the $3.10–$3.20 supply area.
A daily close below $2.60 would invalidate the setup and shift focus toward the $2.30 support before any potential rebound.
It’s the same play, same level, and the same structure. Let’s see if XRP delivers again! 💪
⚠️ Disclaimer: This is not financial advice. Always do your own research and manage risk properly.
📚 Stick to your trading plan regarding entries, risk, and management.
Good luck! 🍀
All Strategies Are Good; If Managed Properly!
~Richard Nasr
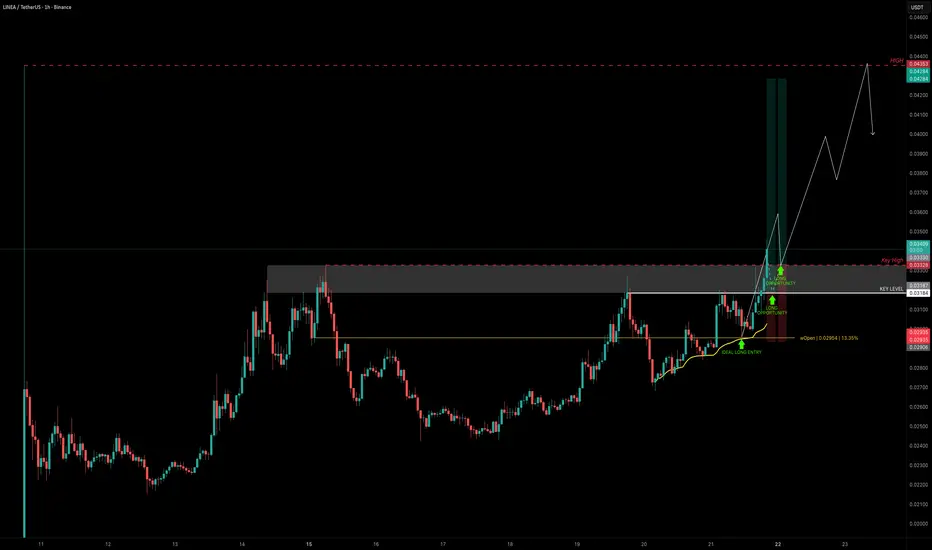
LINEA — $0.033 Key Break Could Unlock Big UpsideLINEA is starting to look interesting. Currently trading around $0.032 (~500M market cap), this level acts as resistance that needs to be broken for bullish continuation.
Earlier today, we already had a clean long setup from $0.03 support, in confluence with the weekly open ($0.02954) and anchored VWAP (yellow line), which held and gave a solid bounce.
Next Long Setup Idea
Entry 1: Watch for a breakout above the key high at $0.03328, then retest for confirmation.
Entry 2: Alternatively, a hold above $0.032 could offer a safer re-entry.
Stop-Loss: Below $0.03 support for now.
Targets
TP1: $0.036
TP2: $0.04
TP3: $0.043
Final Target: $0.065 (aligns with 1B market cap resistance)
This setup could yield:
+30% gain if exited around $0.043
+100% potential if momentum drives price into the $0.065 zone
Quick Take
A breakout and retest of $0.03328 would open the path toward the $0.036–$0.043 zone. If momentum continues, the 1B market cap resistance at $0.065 becomes a realistic macro target.
🔍 Indicators used
DriftLine — Pivot Open Zones → For identifying key yearly/monthly/weekly/daily opens that act as major S/R reference points
➡️ Available for free. You can find it on my profile under “Scripts” and apply it directly to your charts for extra confluence when planning your trades.
_________________________________
💬 If you found this helpful, drop a like and comment!
SOL – Bulls Holding the Channel!SOL has been overall bullish, trading inside a clean ascending channel. Price broke above the $215 – $220 structure zone and pushed higher, but is now pulling back for a retest.
This zone is key 🔑 . It aligns with channel support, making it a strong confluence for buyers to step in. If bulls defend it, momentum could continue, and SOL may push toward higher levels inside the channel 🚀.
If the zone fails, a deeper correction could follow before another attempt from the bulls. Until then, the bias remains bullish as long as structure holds.
What do you think — will the bulls 🐂 step in and send SOL flying again, or will bears take over for a deeper pullback? 🤔
⚠️ Disclaimer: This is not financial advice. Always do your own research and manage risk properly.
📚 Stick to your trading plan regarding entries, risk, and management.
Good luck! 🍀
All Strategies Are Good; If Managed Properly!
~Richard Nasr

XRP — $2.5 Liquidity Zone Could Trigger the Next RallyAfter hitting a new all-time high (ATH) on 18th July, XRP failed to hold the previous ATH ($3.40) as support. This breakdown led to a –25% drop, finding support at the 0.5 Fib retracement of the $1.90 → $3.66 move, followed by a solid +24% bounce back to the pATH (200B MC at $3.36) and 0.702 Fib retracement → an ideal short opportunity.
Now XRP has been trending in a descending triangle pattern for 50 days, with $3 acting as the key resistance. This level is the Point of Control (POC) of the last 75-day trading range, adding weight to its importance. On top of that, the anchored VWAP (~$3.035) is currently reinforcing $3 as additional resistance.
🧩 Confluence Support Zone ($2.665–$2.45)
Liquidity cluster: many stop-losses reside here
Anchored VWAP (support): ~$2.62
Yearly anchored VWAP: $2.59 → strong support level
Golden Pocket (0.618–0.666): $2.5777–$2.4936
21 EMA ($2.665) / 21 SMA ($2.576) (weekly): dynamic HTF support
233 EMA ($2.44) / 233 SMA ($2.53) (daily): strong moving average cluster
Market Cap Support: $2.52 aligns with the $150B level
1.0 Trend-Based Fib Extension: $2.4498 → aligning perfectly with the $2.5 support zone as a reversal point
This creates a high-probability long entry zone between $2.665–$2.45, with multiple overlapping technical factors.
🟢 Long Trade Setup
Entry Zone: $2.665–$2.45
Stop-Loss: Below $2.25 for now, to be adjusted once price action confirms a reversal.
Potential Gain: up to +60% depending on execution
Technical Insight
After 50 days of correction, XRP is approaching a major liquidity and confluence zone.
The golden pocket, VWAP, EMA/SMA clusters, market cap support, and 1.0 Fib extension all stack together at around $2.5, making it a powerful reversal point.
Meanwhile, $3 remains the key resistance, reinforced by the POC of the last 75-day range and the anchored VWAP (~$3.035). Bulls must reclaim this level to confirm bullish continuation.
Key Levels to Watch
Support: $2.665–$2.45 (reversal zone)
Resistance: $3.00
🔍 Indicators used
Multi Timeframe 8x MA Support Resistance Zones → to identify support and resistance zones such as the weekly 21 EMA/SMA.
➡️ Available for free. You can find it on my profile under “Scripts” and apply it directly to your charts for extra confluence when planning your trades.
_________________________________
💬 If you found this helpful, drop a like and comment!

VIX- Cơ Hội Lợi Nhuận Vẫn Còn 37%++Investment Outlook
Reference Price: 34,850
Target Price: 48,000
Upside Potential: +37.7%
As one of the hottest gainers in 2025 with a breakout rally since July, the stock has already tripled from its base price. Yet, upside potential remains over 37%, supported by robust trading momentum and a market capitalization that has been re-rated to over VND 70 trillion.
VIX’s Q3 earnings are expected to be highly promising, as both its proprietary trading portfolio and margin lending activities continue to set new highs in line with the VN-Index’s more than 50% year-to-date surge.

The Trend Line is Broken - What Now?A daily Trendline has been broken. This is a sign that the price might not go up anymore for a while. After a break like this, the price often tries to pullback. This break is a warning for people who think the price will keep going up.
However, remember that the weekly trend is still bullish, so this sign alone could be a short-term change, not a full reversal.

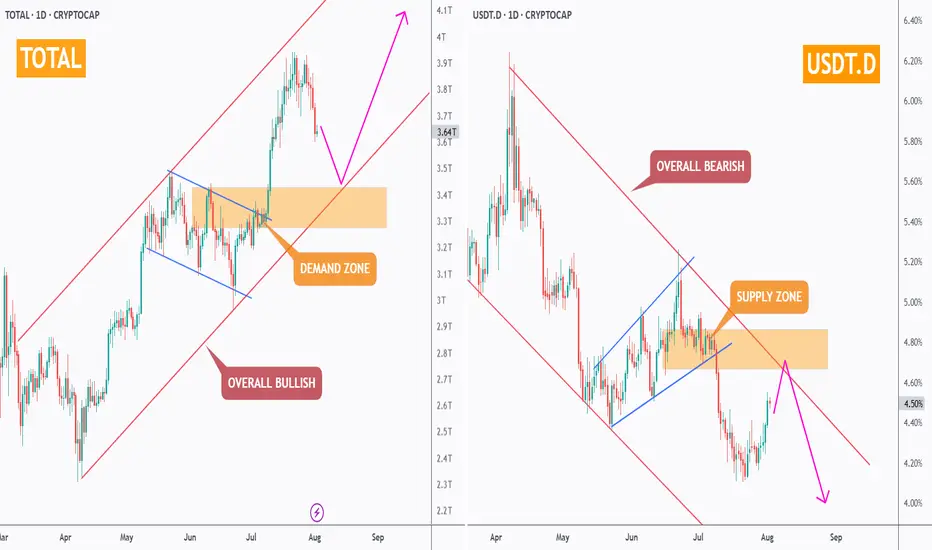
Don’t Panic — It’s Just a Healthy Crypto Correction!While the crypto market has seen some red this week, the bigger picture remains intact. Let’s zoom out and make sense of the current correction.
🔸 TOTAL Market Cap (left chart)
The structure remains overall bullish, trading inside the red rising channel.
After a solid rally, the market is currently pulling back toward a strong demand zone – perfectly aligned with the lower trendline. This area is likely to act as a major support, from which the next bullish impulse could kick off.
🔸 USDT Dominance (right chart)
USDT.D remains overall bearish, trading inside the red falling channel.
It’s currently pushing higher toward a well-defined supply zone, which also intersects with the upper red trendline. As long as this area holds, we expect sellers to take over again — giving altcoins the space they need to bounce back.
📌 In simple terms:
The market is in a healthy correction. Don’t let short-term dips shake your long-term view. The trend is still your friend.
➡️ As always, speak with your financial advisor and do your own research before making any investment decisions.
📚 Always follow your trading plan => including entry, risk management, and trade execution.
Good luck!
All strategies are good, if managed properly.
~ Richard Nasr
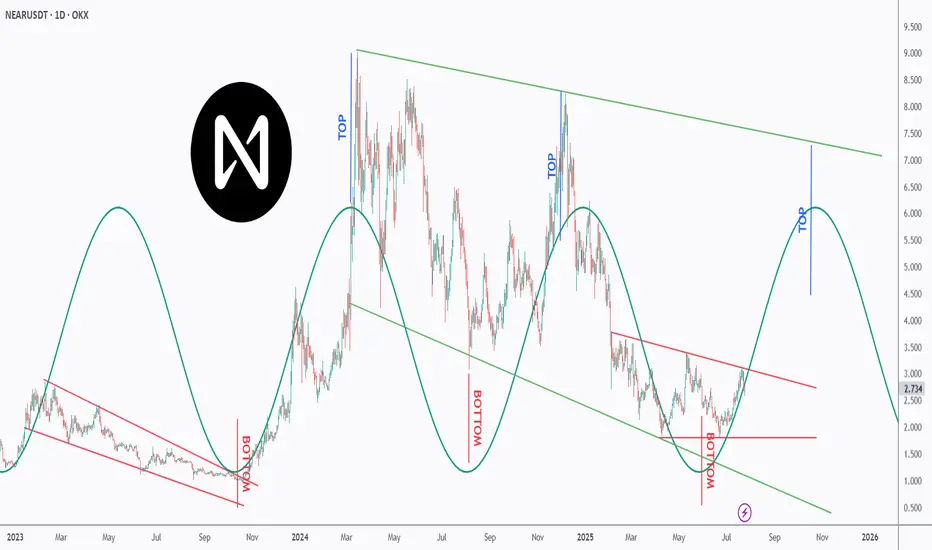
Is NEAR NEARing Its Next Explosion? Watch This Perfect Pattern!NEAR is dancing to a powerful rhythm — and it’s all in the cycles 🔁
This chart uncovers a repeating top-bottom cycle that has held since early 2023, with precise peaks and valleys emerging every few months 📉📈.
After bouncing off a major bottom at ~$2, NEAR is now approaching the mid-line of the descending red channel, suggesting a potential trend reversal is underway 🔄.
Each previous “BOTTOM” aligned with strong recovery waves 🚀, while the projected “TOP” now points toward the $6–7 zone — aligning perfectly with the upper green trendline resistance 🎯.
If the pattern continues, we could be looking at another macro push before year-end 2025 📆.
📊 Will NEAR ride this wave to new local highs — or is it just another lower high in the making? Either way, the rhythm of this chart is too clean to ignore.
📚 Always follow your trading plan regarding entry, risk management, and trade management.
Good luck!
All Strategies Are Good; If Managed Properly!
~Richard Nasr
Solana (SOL/USDT) 4H Reverse H&S PatternSolana (SOL/USDT) – 4H Market Outlook | July 1, 2025
Introduction
SOL has formed a reverse head and shoulders pattern, followed by a clean breakout above resistance. While the lower time frame is bullish, the higher time frame remains bearish, creating a short-term opportunity within a broader downtrend.
Context 1: Key Zones
Supply Zone: 176 – 187
Demand Zone: 126 – 143
Psychological Levels: 140 and 160
Context 2: Technical Structure
Pattern: Reverse Head & Shoulders
Breakout: Confirmed above neckline/resistance
FVGs:
One below price (within demand)
One above price (potential target)
Golden Pocket: Sits just above lower FVG and inside demand — strong confluence support
Context 3: Volume Insight
OBV Indicator: Shows a sudden volume spike, adding strength to the breakout and the bullish pattern confirmation.
Bullish Scenario
Price pulls back into the golden pocket + FVG + demand zone
Finds support → bounces to form higher low
Second leg of the move breaks swing high → targets upper FVG and 160 psychological level
Bearish Scenario
Price breaks back below demand zone and invalidates the golden pocket
Fails to hold structure → reverts to macro bearish trend
Potential retest of previous swing low below 126
Summary
SOL is showing bullish momentum on the 4H after completing a reversal pattern and spiking in volume. A pullback into the demand zone confluence may offer a strong long setup — but failure to hold could revalidate the higher timeframe downtrend.

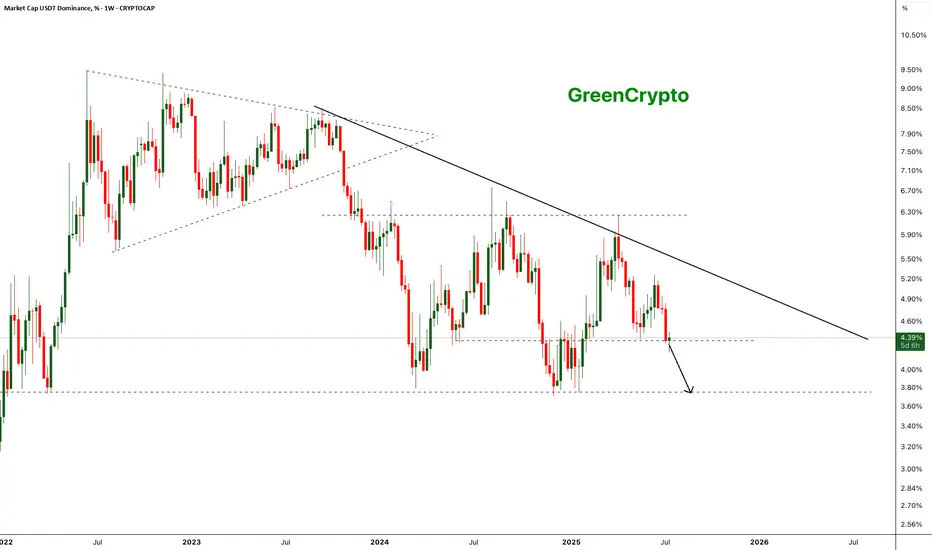
Bearish Breakdown in USDT Dominance - Altseason Loading?The chart shows a clear long-term descending trendline acting as resistance since mid-2023. After multiple failed attempts to break this trendline, USDT dominance has broken below a key horizontal support around ~4.35% on strong bearish momentum.
- Weekly close below the ~4.35% horizontal support.
Next key support zone: ~3.65–3.70% (marked by previous 2023 lows).
- Strong bearish engulfing candle confirming breakdown.
- Bearish continuation expected if dominance remains below 4.35%.
Further drop of the usdt dominance will start the altseason
Cheers
GreenCrypto
A bit of profit taking on NVDA and then up again?NASDAQ:NVDA is the most talked about and everyone is capitalizing on that. Let's take a look.
NASDAQ:NVDA
Let us know what you think in the comments below.
Thank you.
75.2% of retail investor accounts lose money when trading CFDs with this provider. You should consider whether you understand how CFDs work and whether you can afford to take the high risk of losing your money. Past performance is not necessarily indicative of future results. The value of investments may fall as well as rise and the investor may not get back the amount initially invested. This content is not intended for nor applicable to residents of the UK. Cryptocurrency CFDs and spread bets are restricted in the UK for all retail clients.

TOTALCAP — The Next Trillion Crypto Move: Are You Ready?When people analyse the crypto market, they often default to Bitcoin and for good reason. It’s the one and only, the king. But sometimes, to see the forest instead of just the tree, you need to zoom out and study the broader picture.
That’s where the Crypto Total Market Cap (TOTALCAP) chart comes in. It’s essentially the mirror of Bitcoin, but it offers powerful macro insight — not just price, but scale. Looking at trillions instead of dollars changes how you frame support, resistance, and overall sentiment. Let’s dive in.
🧠 Why TOTALCAP Matters
TOTALCAP aggregates the value of every coin and token — the complete valuation of the entire crypto industry.
And while it often moves in sync with Bitcoin, it carries a different weight.
Shows the “big picture” of institutional and retail money flow
Offers clearly defined round-number zones (Trillions) as psychological S/R
Removes coin-specific anomalies and focuses on collective momentum
In bull and bear markets, these trillion-dollar thresholds act like major checkpoints. Watching how TOTALCAP interacts with these levels can give early signals that BTC or alts alone can’t.
Historical Key Levels & Structure
Let’s break it down by macro phases:
✅ November 2021 — Peak of Last Bull Market:
TOTALCAP peaked exactly at $3 Trillion.
This level acted as a ceiling — once hit, the market reversed sharply.
This marked the top of the 5-wave impulsive move (Elliott Wave theory).
📉 November 2022 — Bear Market Bottom:
TOTALCAP dropped below $1 Trillion, bottoming at $727 Billion.
This was almost a 0.786 fib retracement from peak — similar to BTC’s historical retracements.
The $1T mark was retested as resistance before being reclaimed as support.
📈 2023–2025 — The Bull Awakens:
$1 Trillion flipped into solid support throughout 2023.
A clear sign the macro market structure had shifted bullish.
Once $2T was breached, things moved fast.
🚀 Current State:
The market surged above the previous $3T ceiling.
TOTALCAP has hit a new ATH: $3.73 Trillion
Now, the question is: Is this the start of a new leg higher, or a bull trap before a correction?
🔍 Fibonacci Confluences — Why $3.7T Was Key
The sharp rejection at $3.7T wasn’t random. It aligns with:
1.0 Trend-Based Fib Extension: From 91.24B → 3T high → 727B low = 1.0 = 3.65T ✅ precise hit
1.272 Fib Extension of the macro move
Upper Pitchfork Resistance
Channel Top Rejection
→ All signals converged to mark that level as major resistance
🌀 Elliott Wave Macro Count
Looking at the weekly timeframe, we can see a clear impulsive 5-wave movement from the 2022 lows:
Wave 1: $727B → $1.26T
Wave 2: Correction to $975B ($1T) (support confirmed)
Wave 3: Massive rally toward $2.72T
Wave 4: Pullback toward $1.69T (VWAP retest)
Wave 5: $3.73T ATH
What does this imply?
According to classical Elliott Wave theory, after a full 5-wave move, the market tends to enter an corrective phase.
🔍 Some key levels to watch:
$3T: Historical S/R (was the 2021 top, now acting as a key level)
$2.31T: Recent swing low
$2T: Psychological and structural support
📌 Zone of Interest for Longs: $2.31T–$2T
This zone holds:
Previous consolidation zone from mid-2024
Fib retracement confluence
Likely forming Wave C bottom if this is a full ABC
🎯 Upside Targets — What If We Continue Higher?
Looking ahead:
🔸 1.618–1.666 Fib Extension = $4.42T–$4.53T
🔸 1.618 TBFE from previous cycle = ~$5.45T
📌 Rounded Targets: $4.5T, $5T and $5.5T
These are the next likely macro cycle targets — but only after a healthy correction and consolidation.
☀️ Macro Context & Summer Seasonality
Historically, summer tends to be a weaker period:
Lower volume
Institutional rebalancing
Geopolitical and macroeconomic uncertainty
📚 Educational Insight: TOTALCAP as a Tool
Treat TOTALCAP like the S&P500 of crypto.
Use round trillions as psychological levels: 1T, 2T, 3T, etc.
Always check if BTC’s price is aligned with where TOTALCAP is on the macro structure
Helps judge market strength even when BTC dominance is shifting
It’s especially useful when altcoins pump or dump out of sync with BTC — you can use TOTALCAP to track the real flow of money.
💡 Final Thoughts
We are likely in a corrective phase after a complete 5-wave cycle.
The area between $2.31T and $2T offers high-probability long entries
Watching how TOTALCAP reacts to these levels will help us anticipate the broader market’s next move
Summer slowdown could mean chop — but this also creates opportunities
💬 Let me know your thoughts: Are we entering a deeper correction? Or will TOTALCAP surprise us with a new leg higher?
Don’t forget to zoom out. The charts always tell the story.
_________________________________
💬 If you found this helpful, drop a like and comment!
Want breakdowns of other charts? Leave your requests below.

Breakdown Alert: Crypto Market Cap Tests Major Demand ZoneThe total crypto market cap is testing a key support zone around $3.23T. This area has acted as a demand zone in the past, and now price is hovering right above it.
The current structure suggests a possible breakdown–retest–continuation setup. If price retests this zone from below and fails to reclaim it, further downside toward $3.0T could be likely.
This idea is based on price action and structure only — no indicators used.
❗ This is a personal analysis for educational purposes only. Not financial advice.
Feel free to share your thoughts or technical perspective in the comments

DOGE|Bearish Triangle Formation On30-Min Chart-Breakdown Ahead?📉 DOGE Bearish Triangle Breakdown | 30-Min Chart
This chart highlights a classic *bearish triangle formation* in DOGE's market cap on the 30-minute timeframe. The pattern shows a series of lower highs with horizontal support around the 32.45B zone.
🔍 Key Observations:
- Pattern: Bearish Triangle
- Resistance: ~34.7B
- Support Zone: ~32.45B
- Target Zone (Post-Breakdown): ~31.3B
A breakdown below the support level could signal further downside movement. However, confirmation is key — traders should watch for volume and candle close below support.
🕒 Timeframe: 30-Minute Chart
📆 Analysis Date: May 29, 2025
---
⚠ *Disclaimer:*
This analysis is shared purely for *educational purposes* and does not constitute financial advice. Please do your own research and risk management before making any trading decisions.

Bitcoin Total Market Cap Update – Strategic Scenarios AheadAs of May 8, 2025, the total cryptocurrency market capitalization stands at approximately \$3.012 trillion, reflecting a 2.17% increase from the previous day . Bitcoin's market cap is around \$1.962 trillion, with a current price of \$98,798.11 .
Given these figures, we are considering the following potential scenarios for the crypto market:
---
1. Break Above \$3T and Hold ✅ (30% Probability)
* The market breaks through the \$3 trillion level.
* Retests it as support.
* Continues the bullish momentum from there.
---
2. Rejection and Consolidation 🔁 (50% Probability)
* Price gets rejected at \$3T.
* Moves sideways between \$2.8T and \$3T.
* Eventually breaks out and retests \$3T as support before resuming upward.
---
3. Bearish Turn Below \$2.8T 🔻 (20% Probability)
* Rejection at \$3T.
* Market loses \$2.8T support.
* Retests \$2.8T as resistance, followed by further downside pressure.
---
Key Levels to Watch
* \$2.8T and \$3T are critical zones. Movements between these levels indicate uncertainty and should be approached with caution.
---
Our Perspective
A retest of \$3T as support could present the strongest buying opportunity of this cycle. We urge everyone to stay alert, analyze carefully, and prepare accordingly.
Golden Cross is looming — remain focused and disciplined.
---
Stay updated and connected:
With best regards,
Team ProCryptoEdge
Educate. Empower. Elevate.
