Stop Hunts: How the Market Tests Your Patience“If the market keeps taking your stop before running in your direction…
You might not be wrong — just too early.”
What is a Stop Hunt?
A Stop Hunt is when price pushes just far enough to trigger stops sitting above a high or below a low — and then reverses.
It’s not random. It’s the market collecting liquidity before the real move begins.
Why Stop Hunts Happen
Stops are easy targets — they’re predictable.
Institutions use them to fill big orders at the best prices.
Your loss is their entry.
How to Spot a Stop Hunt
Mark clear swing highs and lows — obvious levels most traders are watching.
Watch price sweep above/below those levels with a quick move.
Wait. Don’t jump in — the first move is usually a trap.
Drop to a lower timeframe (M1/M5) to get a precise entry confirmation.
Look for structure shift or ChoCH after the sweep.
Only then, consider entering — now you’re trading with the market, not against it.
Example
Refer to the Gold(XAUUSD) M15 chart above:
Notice how price took out the previous swing low with a liquidity grab from the stop area — trapping early buyers — and only then launched into a strong up move.
This is the classic stop hunt behavior that shakes out weak hands before the real trend continues.
Patience turns a losing stop into a winning entry.
The market isn’t against you — it’s just testing who can wait.
📘 Shared by @ChartIsMirror
Marketstructure

AUDNZD Trading Idea – Momentum & Liquidity OutlookThe pair has been in a clear expansion phase, showing strength after multiple structure breaks. Momentum has favored the upside, while recent consolidation reflects market participants taking profits and rebalancing orders.
A corrective wave appears to be unfolding, which is typical after strong impulsive moves. Such phases often allow liquidity collection before the next directional expansion. The broader sentiment suggests that buyers are still active, but short-term volatility may create temporary pullbacks.
Educational Note: Markets move in cycles of impulse and correction. Recognizing these phases helps traders avoid chasing moves and instead prepare for continuation opportunities once the correction stabilizes.

BTC PLAN TODAY | SEP.25 | BEARISH TREND 👉 1. Market Structure
Around 114,000, price made a Break of Structure (BOS) to the downside → confirming a bearish short-term bias.
After that, a CHoCH followed by another BOS down reinforced the bearish trend.
The descending red trendline shows momentum is still bearish.
4. Trade Scenarios
Scenario 1 (primary bias – bearish continuation):
Wait for price to retrace into 112,600 – 113,200 (Fib confluence + FVG + Supply).
Look for bearish confirmation to Sell.
Short-term TP: 112,000 → Extended TP: 111,600.
Scenario 2 (less likely – bullish reversal):
If price breaks and sustains above 113,400, structure may shift bullish.
In that case, look for Buy opportunities targeting 114,000 – 114,200.
👉 Summary:
BTC on the 30m timeframe is still in a bearish structure. Best sell zone is 112,600 – 113,200, with downside targets at 112,000 and 111,600.

MARKET ANALYSIS – XAUUSD I 16 - Sep ⚙️ Current Context:
- Gold has broken out of the previous downtrend and established a clear uptrend with a sequence of Higher Lows – Higher Highs.
- Current price is around 3682, sitting above the short-term supply zone (3671–3685) and near the Swing VaH.
- Volume Profile shows liquidity concentrated around 3650–3685, with SWING VAL 3647–3653 as a potential support zone in case of pullback.
🧭 VOLUME PROFILE & PRICE STRUCTURE
🟩 Swing VaH zone: 3685 → Short-term resistance
🔹 Supply zone: 3671–3685 → Potential profit-taking area
🟧 Swing VAL zone: 3647–3653 → Support if price pulls back
🔺 Demand zone: 3636 → Medium-term buy zone if a strong flush occurs
🎯 MAIN TRADE SCENARIOS
✅ Scenario 1: Buy Pullback around 3650–3653
📍Conditions:
Price retraces into old Supply zone + Swing VAL
Bullish confirmation candle (Bullish Engulfing / Pin Bar M15–M30)
🎯 Target: 3685–3700
🛑 SL: Below 3644
✅ Scenario 2: Buy Breakout if price clears 3685
📍Conditions:
H1 candle closes above Swing VaH 3685
Strong breakout volume
📌 Entry: 3686–3688
🎯 Target: 3705–3710
🛑 SL: Below 3671
⚠️ Scenario 3: Short-term Sell if strong reaction at 3685–3690
📍Conditions:
Bearish Pin Bar / Fakey (M15–M30) appears around 3685–3690
📌 Entry: 3685–3688
🎯 Target: 3655–3653
🛑 SL: Above 3695
🔁 Scenario 4: Buy around Demand Zone if price drops sharply
📍Conditions:
Price falls into 3636 (Demand zone)
Strong absorption (Pin Bar / Doji M30–H1)
📌 Entry: 3636–3638
🎯 Target: 3665–3680
🛑 SL: Below 3628
💬 Notes & Key Takeaways
- The market is consolidating near the top, and a technical pullback may occur before further upside.
- Prioritize BUY setups in line with the main uptrend; SELL only for short-term reactions with tight SL.
- Strictly manage risk & always respect Stop Loss.

Gold (XAUUSD) – 15 Sep | Watching 3638–42 & 3647–51 for Shorts🟡 Gold (XAUUSD) Analysis – 15 September
Market Context
• As per our 12 Sep Analysis , market retested 3651 – 3657 (LH + supply zone) and resumed its downtrend.
• Price is now expected to continue lower and create a new lower low below the previous one at 3612 .
• In today’s Asian session, internal structure also broke to the downside, confirming alignment with the broader bearish trend.
Key Observations
• First Zone to Watch: 3638 – 3642 (recent order block). If price retraces here and shows LTF confirmation , we will look to short.
• Next POI: 3647 – 3651 (M15 POI + LH zone). If the first zone fails, this is our next preferred level for a potential short setup.
• Market structure continues to form lower highs and lower lows, reinforcing our bearish bias.
Execution Plan
Wait for price to pull back into 3638 – 3642 OB or 3647 – 3651 POI.
Watch M1 for confirmation (micro-ChoCh / micro-BoS).
On confirmation, execute a short setup with fixed risk ( SL: 40 pips | TP: 120 pips , 1:3 R:R).
If both zones fail, step aside and reassess before taking any trade.
Patience is also a position — let price come to you before taking action.
Bias for Today
📉 Bearish only. Looking for shorts from OB or POI with confirmation.
📘 Shared by @ChartIsMirror

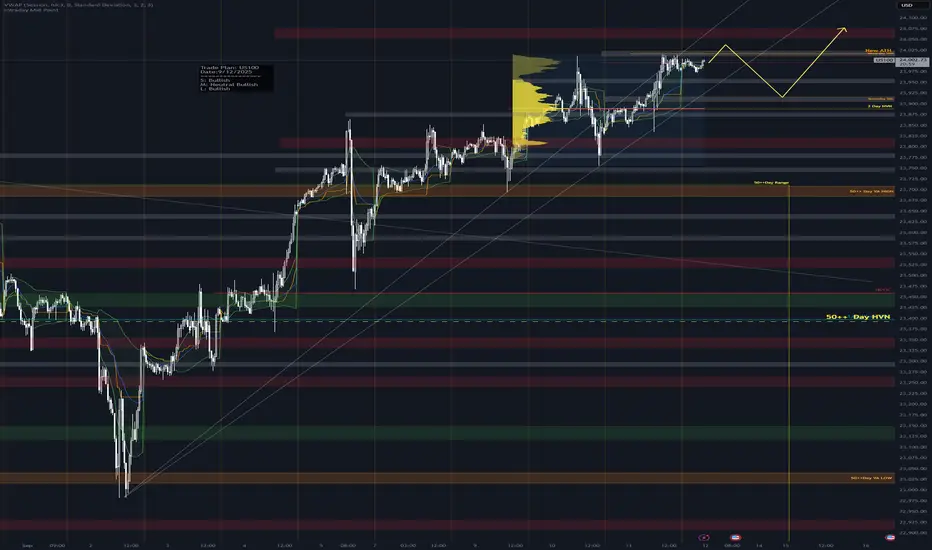
Daily Trade Plan: US100Trade Plan: US100
Date:9/12/2025
================
Smaller Timeframe : Bullish
Medium Timeframe : Neutral Bullish
Larger Timeframe : Bullish
================
If price trying to break higher but fail. Price should pull back to 2 day HVN level. Especially "Yesterday value area low" zone. It coud be set as a lounching point of bullish move to make a new all time high.
Daily Trade Plan: XAUUSDTrade Plan: XAUUSD
Date: 9/12/2025
================
Smaller Timeframe: Neutral
Medium: Timeframe: Bullish
Lager Timeframe: Bullish
================
On friday, now price is in the middle of 3 day range. The expectation of move is up and down in the range. So set the order around the top or buttom of the range. And trade back and forward between value area high and low of 3 day range.

ES (SPX) Analyses for Thu, Sep 11 (CPI day)What matters tomorrow (fundamentals)
CPI (Aug) at 8:30 ET — the BLS schedule shows the August CPI release Thu Sep 11, 08:30 ET. This is the day’s primary driver.
Weekly Initial Jobless Claims at 8:30 ET — standard Thursday release; calendars show the event scheduled for Sep 11 at 08:30 ET.
Treasury 30-yr bond auction — $22B long-bond sale Thursday (typically 13:00 ET). This can move yields into the NY afternoon and spill into equities.
Context into the print: PPI (Aug) was released today (Sep 10); YoY +2.6% per data trackers/BLS release, keeping focus on CPI for confirmation. Markets are leaning toward a Fed cut at next week’s meeting.
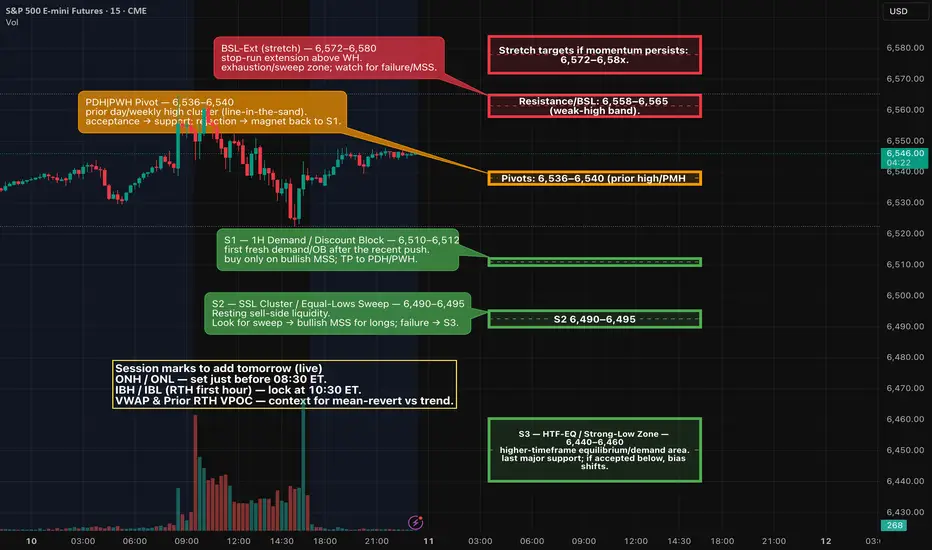
I’m using your 1D / 4H / 1H.
Trend: Uptrend intact on 1D; price sits just beneath a “weak-high / premium” supply band. (1D shows fib extensions near ~6705 (1.272) and ~6799 (1.618) as far targets, not base-case for tomorrow.)
4H: Recent push into a red supply band then pullback; mid-range equilibrium roughly ~6,44x–6,45x.
1H: Resistance zone ~6,558–6,565 (your “Weak High” band). Prior highs around ~6,536–6,540 act as local pivot/PMH; below that, demand/discount blocks stack ~6,50x → 6,46x–6,44x.
Scenario A — Disinflationary/soft CPI (yields down)
Likely path: Early sell-side sweep into 6,51x → 6,49x discount → bullish MSS.
Entry: Buy the 1–5m PD-array in discount after displacement.
Targets: 6,536–6,540 → 6,558–6,565 (weak-high). Leave runner toward 6,57x–6,58x only if order-flow stays bid.
Invalidation: 1–5m structure loses 6,49x and cannot reclaim.
Scenario B — Hot CPI (yields up)
Likely path: Buy-side sweep through 6,558–6,565 → failure → bearish MSS back below the band.
Entry: Short premium PD-array after displacement down.
Targets: 6,536–6,540 → 6,51x, stretch 6,49x then 6,46x–6,44x if momentum accelerates.
Invalidation: Acceptance back above 6,565 with bullish structure.
Projections:
ES futures are anticipated to respond within a 5-15 minute window following the 8:30 AM release, with intraday movements likely intensified by algorithmic trading and stop-hunting activities. Historical analysis of the past 6 CPI events indicates an average end-of-day ES move of approximately +0.76% in response to ±0.1% deviations from forecasts. The prevailing volatility suggests that implied moves, derived from options data, are forecasting a swing of around 0.5-1% (equivalent to ±30-60 points from current levels), though actual market responses have been known to exceed these expectations in the event of surprises.
In the pre-release phase, spanning overnight to pre-market hours (approximately 4:00-9:30 AM ET), market participants are likely to observe a consolidation or mild upward bias within a range of 6480-6575, building upon today’s record highs. The light trading volume may lead to false breakouts around critical levels. Traders are currently positioning for a "failed breakdown" pattern, wherein an initial dip below recent lows could trigger stop-loss orders, followed by a swift reversal higher if market sentiment remains intact.
As the clock strikes 8:30 AM ET, high volatility is expected, with the potential for a 20-40 point gap open or sharp spike. A common occurrence is an initial downside flush aimed at testing liquidity (for instance, dipping below 6500) before a definitive market direction is established. Whipsaw action is likely as news headlines emerge, with particular focus on the core CPI data, which will be pivotal for determining sustained market trends.
Good Luck Everyone!
Gold (XAUUSD) – 10 Sep | Watching M15 Supply for Short Setups🟡 Gold (XAUUSD) Analysis – 10 September
Market Overview
Gold had been in relentless bullish momentum with both H4 and M15 aligned to the upside. Yesterday, price made a fresh all-time high at 3674.650 , but sharp selling pressure emerged from that level.
This rejection caused a significant Change of Character (ChoCh) below the previous higher low at 3628.5 . Following this, the market also printed a Break of Structure (BoS) earlier today, confirming that the H4 pullback phase has now begun.
Current Market Scenario
H4: Shifted into a pullback phase after M15 ChoCh + BoS.
M15: In a downtrend, currently retracing after the structural break.
This alignment signals that our focus today will be on sell setups only .
Key POI for Today
🔹 3637–3640.8 → M15 supply zone at the LH level.
If price retraces into this zone and provides LTF confirmation , we will plan a short setup.
If this zone is not respected, we will step aside and reassess deeper supply areas.
Execution Plan
Wait for price to retest the 3637–3640.8 M15 supply zone .
Drop to M1 for confirmation (micro ChoCh / micro BoS).
If confirmation is present, execute a short setup with fixed risk.
If the zone fails, do not force trades — wait for price to reach deeper supply before re-engaging.
Execution is about patience — let the market come to your levels, not the other way around.
Bias for Today
📉 Bearish only. Short setups will be taken from supply zones once confirmation is present. Until then — no trades.
📘 Shared by @ChartIsMirror

Daily Trade Plan: XAUUSDTrade Plan: XAUUSD
Date: 9/10/2025
================
Smaller timeframe: Neutral Bullish
Medium timeframe: Bullish
Larger timefrmae: Bullish
------------------------
1. If price has broken up and holding above yesterday VPOC and yesterday value area low. Buying potential may lead the price break up to make a new all time high.
2. If price coudn't break up and hold below yesterday VPOC and yesterday value area low. Price may move from yesterday VPOC to lower zone and better look for buying set up and target at yesterday value area high or further than that.

USDJPY – Dual POI Short Setup🧠 Market Context
Previous Day High swept → liquidity grab complete.
CHoCH → Bearish Intent confirmed → directional bias is short.
Price is now retracing into supply zones for potential continuation lower.
🎯 Key Points of Interest (POIs)
Refined 1H POI
Aligned with highest previous day volume.
Strong institutional confluence.
Extreme 5M FVG (sweep origin)
Cleaner entry with tighter risk.
Aligns with the extreme point of interest logic from liquidity models.
⚖️ Execution Plan
Option A: Scale Entries
Partial entry at 1H POI.
Add position at 5M extreme FVG if price sweeps deeper.
Option B: Confirmation Entries
Wait for LTF BOS / rejection candle inside either POI before execution.
🔽 Bearish Targets
147.037 → Previous Daily Low (Liquidity Zone).
146.582 – 146.600 → Deeper liquidity + imbalance fill.
⚠️ Risk Management
Risk 0.5–1% per setup, split across zones.
Move SL to breakeven once 2R is achieved.
Trail stop following bearish structure.
📊 Summary
USDJPY has shifted to bearish intent after the PDH sweep. Two valid POIs are in play — a volume-backed 1H supply and an extreme 5M FVG.
Best approach: scale into both for higher probability while keeping risk controlled.
💬 What do you think? Would you take the refined 1H POI or wait for the extreme 5M FVG?

ES (S&P500) - Analyses - Breakout or Breakdown Plan (Sep 9)S&P 500 E-mini (ES) keeps ranging inside 6,490–6,505, with repeated taps of 6,516 above and 6,490–6,496 below. Tomorrow I’m stalking a box resolution during the AM session, then a second chance in the PM window.
Key Zones
Resistance: 6,505–6,516 (NYPM/NYAM lid). Above it: 6,541.25 (PDH) → 6,547.75 (IBH).
Support: 6,495–6,490 (NYAM/NYPM floor). Below it: 6,481.0 → 6,471.5 (hard pools).
Range to watch: 6,490–6,505 (decision box).
Game Plan (structure-first)
LONG (breakout-acceptance)
1. 5-minute displacement close > 6,505–6,516.
2. Retest 6,501–6,503 (OB/FVG/OTE) and hold.
3. Entry on confirm; Targets: TP1 6,541.25, TP2 6,547.75, TP3 6,555+.
4. Invalidation: any 5-minute body back ≤ 6,500 after breakout.
SHORT (breakdown-acceptance)
1. 5-minute displacement close < ~6,496.
2. Retest 6,498–6,500 (failed reclaim) and roll.
3. Entry on confirm; Targets: TP1 6,481.0, TP2 6,471.5, TP3 6,464–6,465.
4. Invalidation: any 5-minute body ≥ 6,500 after fill.
Timing windows
Primary: 09:30–11:30 ET and 13:30–15:30 ET (trade management only in between).
We are currently consolidating below 6,516, with a clear liquidity ladder leading to PDH 6,541.25 if the movement is accepted. If it fails, we have stacked support levels around 6,481 and 6,471 that typically attract price action once 6,496 breaks down.
Please confirm with ES and NQ: we want both indices to move in sync (no bearish signs of market tension on longs, and no bullish signs of market tension on shorts).
What could affect ES tomorrow?
NFIB Small Business Optimism (Aug): 6:00 AM ET.
API crude inventories (for CL correlation): Tuesday around 4:30 PM ET.
(For Wednesday's context: EIA petroleum report at 10:30 AM ET.)

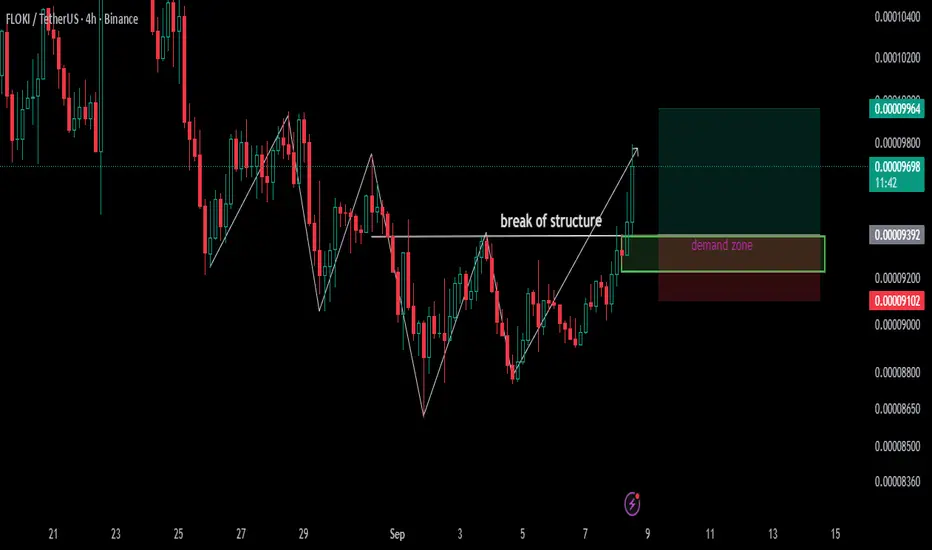
break of structure didn't lie it time for BULLS. wait for retestFlokiustd ,, market structure shifted form lower highs , lower lows to higher high and higher lows , if you want to a pin point trade wait for retest on DEMAND zone, then go for it but put stop loss on below demand
Mitigation: Where Smart Money Reloads“The first touch after a shift is often the cleanest. But only if you know where to wait.”
After a ChoCH or Break of Structure , price often returns to the origin of the move.
This return is called Mitigation — where big players close remaining positions and open new ones in the direction of the fresh trend.
Why Mitigation Matters
Most traders jump in immediately after a BoS, afraid of missing the move.
But professional traders understand something crucial:
The market almost always comes back.
Mitigation is where the market “refuels” before continuing.
It offers:
Smaller stop losses (tighter risk)
Clear invalidation points
Cleaner entries with better risk-reward
How to Spot Mitigation Zones
Find the last opposing candle before the strong move (bearish candle before a bullish rally, bullish candle before a sell-off).
Mark its open–close range as your mitigation block.
Wait for price to return to this area — patience is key.
Drop to a lower timeframe (M15 or M1) and wait for confirmation (ChoCH/BOS) before entry.
Practical Example (Gold)
Suppose Gold breaks structure upward (BoS).
Instead of buying the breakout, look left to locate the last bearish candle before that strong rally.
Price often revisits this candle’s range.
When it does, observe lower timeframe structure:
If it holds, that’s your entry — right where smart money is filling orders.
This is why the first pullback after a BoS is often the cleanest trade — it’s not random.
It’s the market completing unfinished business.
📘 Shared by @ChartIsMirror
Have you seen this play out on your own charts?
Share your thoughts — where did price last revisit a zone before making a big move?

Trade Plan: XAUUSDTrade Plan: XAUUSD
Date: 9/5/2025
================
S: Neutral Bullish
M: Bullish
L: Bullish
================
Buy set up for both scenario
1. If price move up and try to break New ATH. Wait for fasle break and price should come back down to yesterday VPOC, where Buying set up should placed around that area.
2. If price move down and hold below yesterday VPOC. Wait for buying signal from the yesterday low and target should hit before New ATH level.

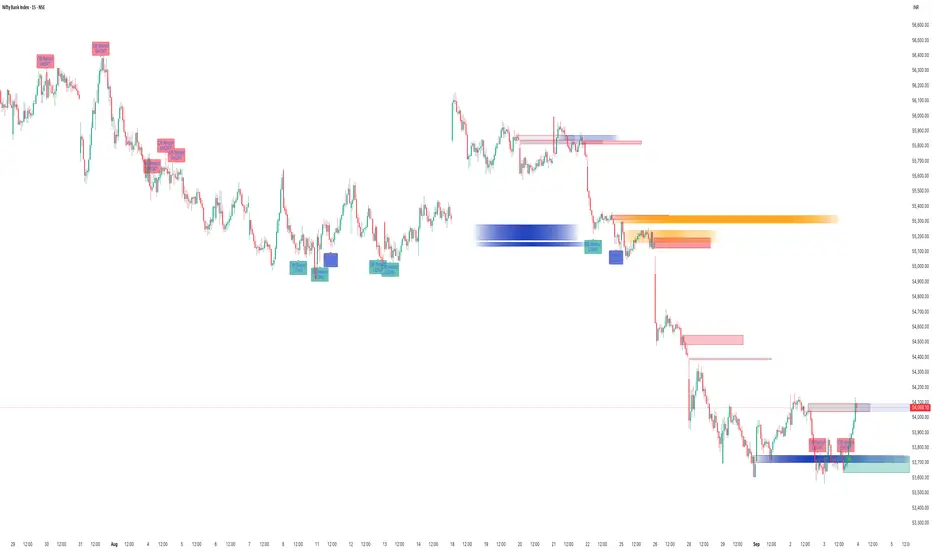
How To Capture Market Moves With SMC Suite Indicator?📊 SMC Suite Capturing Market Moves — Order Blocks • Breakers • Liquidity Sweeps • FVG
The chart above shows how the SMC Suite works in live market conditions on BankNifty. By combining Order Blocks, Breaker flips, Liquidity Sweeps, and Fair Value Gaps, the tool highlights where smart money is entering and where reversals are likely to occur.
🔹 Key Highlights from This Chart
1. Order Blocks — Bullish and bearish OBs correctly marked institutional footprints before price reversals.
2. Breaker Blocks — Invalidated OBs flipped into Breakers, giving continuation entries in trend direction.
3. Liquidity Sweeps — Several highs/lows were taken out, followed by reversals back into structure. These sweeps acted as confirmation for later setups.
4. Fair Value Gaps (FVGs) — The script marked imbalances that later served as retracement zones. Price respected these gaps, providing clean reversal opportunities.
5. Retest Alerts — Each zone was validated only on retests with optional wick rejection, reducing noise and improving signal quality.
⸻
🔹 Why It Matters
This chart shows that SMC Suite is not just drawing zones randomly — it creates a workflow:
• Sweep liquidity ➝ impulsive displacement ➝ zone creation (OB/Breaker/FVG) ➝ retest confirmation.
This makes it easier to follow institutional logic and align entries with high-probability setups.
📌 Conclusion
From strong downside moves to clean bounces, the SMC Suite captured both continuation setups (Breakers) and reversal setups (OB/FVG retests). The integration of liquidity logic makes it a practical trading tool across indices, forex, and crypto.
Break of Structure (BoS): When the Trend Announces Itself“Structure is the language of the market. Learn it, and price speaks to you.”
Every trader looks at charts hoping for clues — and structure is the clearest one.
A Break of Structure (BoS) is a simple but powerful concept: it shows when the market confirms a continuation of the trend.
What is BoS?
When price breaks a previous high in an uptrend → confirms bullish continuation.
When price breaks a previous low in a downtrend → confirms bearish continuation.
BoS is different from ChoCH:
ChoCH signals potential reversal .
BoS signals trend continuation .
How to Spot BoS
Identify the key swing highs and lows.
Wait for price to decisively break them.
Confirm the break on the timeframe aligned with your bias (e.g., H4 for trend, M15 for setups).
Practical Tip
A BoS on M15 aligned with H4 bias is often where setups start forming.
Never assume a break is real without observing structure alignment and volume/confirmation.
Price doesn’t lie. Structure doesn’t cheat.
Once you see the break, the market has announced its intentions.
📘 Shared by @ChartIsMirror
If this resonated, comment below — which part of structure analysis should I break down next?

Bake / USDT : Strong rally aheadBake / USDT is currently trading at the bottom support and expecting big move soon..

SXT / USDT : Breaking out from Trendline resistanceSXT/USDT is breaking out of its trendline resistance with strong potential. If this breakout sustains with clear confirmation, price could rally toward the $0.09 – $0.10 zone soon.
Best approach: Wait for clear bullish confirmation before entering. Manage risk wisely and trade according to market conditions.

Trade Plan: XAUUSD====Date: 8/29/2025S: Bullish
M: Neutral
L: Neutral Bullish
---------------------------
Bullish bias has set for today. Better to look for buy set up at the zone
1 : If the real time situation is very bullish, price may hold at the first zone which confluence to trend line and then it could reverse back up higher.
2: Price may back down to test Yesterday VPOC and then you should watch for buying price pattern or the ending of down move momentum.
3: If price has passed down through Yesterday VPOC it might has a shoppy move up and down around Larger time frame value area high zone.

BTC Rotations Aren’t What They Used to Be — Trojan Cycle This chart uses the Trojan Cycle: Dip & Profit Hunter tool to evaluate recent BTC price action in relation to structural flow dynamics — specifically price and volume behavior through a statistical lens.
The tool is part of a broader effort to monitor the evolving nature of capital rotation in crypto — one that considers how institutional infrastructure, regulatory filters, and synthetic signals may be altering traditional cycle behavior.
🧠 What This Tool Is Designed to Do
Rather than issuing classic buy/sell signals, the tool evaluates where we are in the broader capital flow rotation by analyzing:
Z-Scores of price and volume (how far each has deviated from their historical norm)
Percentile ranks (where current values fall relative to past distributions)
Price vs. Volume momentum divergence
A contextual output based on combinations of these metrics
The aim is to offer a clearer view into whether a move is structurally supported or potentially hollow .
🔍 Live Signal Example (as shown on chart)
Metric Value
Z-Score (Price) +0.65 (mild extension)
Z-Score (Volume) -1.27 (subdued flow)
Percentile (Price) 64%
Percentile (Volume) 2% (extremely low)
Combined Context 📉 Price leading — flow lagging, be cautious
Structural Signal 🟣 No high-probability setup
🗣 Interpretation (not prediction):
While BTC has advanced in price, this configuration suggests a lack of supporting volume — at least from the perspective of the current model. In the context of a maturing, compliance-filtered market structure, these kinds of setups may align with the idea of synthetic rotations: price expansion without true structural inflow.
📘 Why This Matters
The goal isn’t to call tops or bottoms — it’s to better understand the character of a move .
This tool helps frame whether a move may represent:
📥 Accumulation
🔴 Distribution
🚨 Euphoric extension
🧨 Synthetic narrative trap
…or simply neutral structure , as in the current case.
🔎 Interested in the Thesis Behind This?
This tool is part of a broader analytical framework outlined in the Trojan Cycle and Synthetic Rotation theses.
To explore those ideas further, including full macro breakdowns and structural flow models, please visit the published charts for RWCS_LTD on TradingView.
📊 How I Use This Personally
I avoid adding risk when signals show price is leading while volume lags.
I scale in during “confluent buy” or “value + flow” setups.
I pair this with BTC.D, ETH/BTC, and TOTALES3/ETH to track relative strength and phase rotation.
💭 Final Thought
Whether this tool confirms your existing thesis — or challenges it — the intent is to help develop structure-informed judgment in a rapidly evolving market.

EURUSD - LongEURUSD – BUY Setup
📊 H4 Timeframe Analysis by Nii_Billions
🔹 Outlook: BULLISH
Using multiple timeframe confirmation for direction.
Strategy blends technicals, fundamentals, and sentiment.
Entry, SL, and TP structured with risk management in mind.
🟢 Educational purposes only 🟢
❤️ Like & comment if this helps your trading journey.
👉 Follow for more swing trade ideas.

EURGBP - LongEURGBP Analysis - LONG 👆
In this Chart EURGBP H4 Timeframe: By Nii_Billions.
❤️This Chart is for EURGBP market analysis.
❤️Entry, SL, and Target is based off our Strategy.
This chart analysis uses multiple timeframes to analyze the market and to help see the bigger picture on the charts.
The strategy uses technical and fundamental factors, and market sentiment to predict a BULLISH trend in EURGBP, with well-defined entry, stop loss, and take profit levels for risk management.
🟢This idea is purely for educational purposes.🟢
❤️Please, support our work with like & comment!❤️
