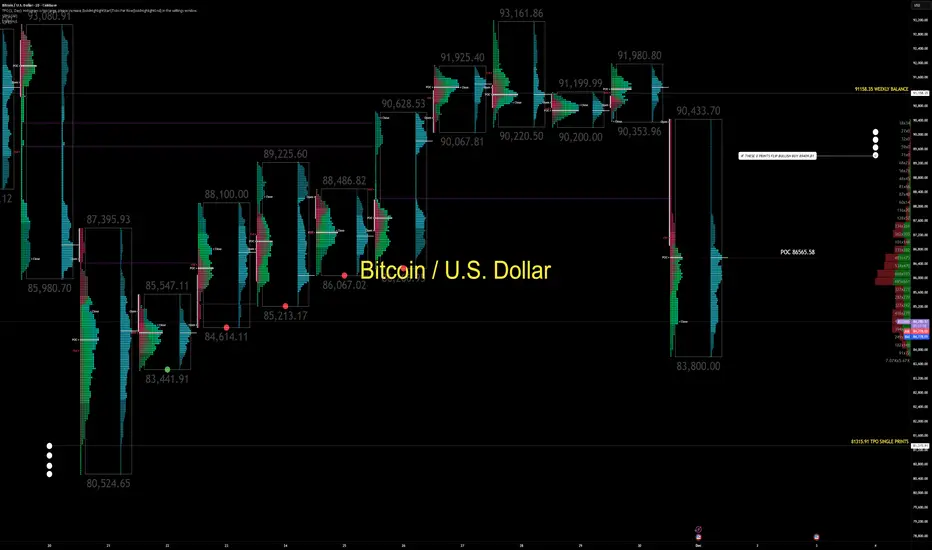
BTCUSD: Midrange Trap With One Behavior Line That Decides DirectBTCUSD respected weekly balance, rallied sharply, and left a clear volume imbalance behind.
Today’s session opened with a bearish TPO profile, attacking the lows immediately after midnight.
The chart presents a classic midrange manipulation environment.
From a CORE5 lens, today’s read is driven by two pillars:
Volume Flow Analytics (VFA) and Order Flow Dynamics (OFD).
1. The Key Behavior Level: 89,409
Today’s TPO left four critical prints around 89,409.
That zone is the behavior divider:
Below it: sellers remain in control, downside work unfinished.
Above it: structure flips decisively bullish.
BTCUSD remains “hidden behind” the weekly candle as long as it trades under 89,409.
2. Range Low Liquidity Still Unfinished
BTC has already attacked most local range lows except the deeper pocket at 83,441.91.
Below that sits a clean liquidity pool:
Buying tails and single prints around 81,315.91
Classic range-low liquidation structure
A pattern BTC often completes before resetting upward
This keeps downside behavior technically open despite weekly balance strength.
3. Midrange = Manipulation Zone
BTC is mid-structure.
This is where institutional players defend higher timeframe bias while algos rotate price intraday to trap both sides.
Execution guidelines:
Prioritize 15m structure shifts
Track behavior flips around 89,409
Expect two-sided noise
Treat midrange as deception territory, not confirmation territory
On higher timeframes, BTC remains inside a monthly structure mapping zone near 95 percent discount—explaining recurring dip demand without removing intraday trap risk.
The Core Message
89,409 is the line that defines directional clarity.
Below it: behavior stays two-sided and manipulative.
Above it: bullish structure re-establishes with real conviction.
Liquidity remains open at 83,441.91 and 81,315.91.
Trade the behavior, not the story.
— CORE5DAN
Institutional Logic. Modern Technology. Real Freedom.
Marketstructuremapping
The 74,420.69 Decision Zone: Bitcoin’s Next Regime Depends on ItBitcoin is approaching 74,420.69, a long-term structural decision level where macro conditions, liquidity behavior, and monthly market structure converge.
Macro conditions are tightening: the Dollar is firm, yields are stable, and liquidity across major crypto venues is thinner into month-end. This is the first time BTC has tested a structural ceiling under genuine macro pressure.
Key upcoming catalysts influencing liquidity and Dollar direction include U.S. CPI, Core CPI, PPI, FOMC Minutes, weekly labor data, consumer confidence, month-end rebalancing flows, and Q4 options positioning. BTC is meeting structural resistance at the exact moment these events cluster.
From a Market Structure Mapping perspective, the monthly bullish regime remains intact only if November closes above the prior range low. A close beneath that threshold would trigger a rare long-horizon regime inversion, shifting models from accumulation toward distribution. Monthly structural breaks are uncommon and typically define multi-year liquidity cycles.
Participation metrics confirm the tension. Volume Flow Analytics shows significant absorption at the high, with buy-side flows consistently consumed across major venues. Order Flow Dynamics aligns, indicating buyers being absorbed rather than defended — a common pattern at structural ceilings.
74,420.69 is not a target. It is the structural axis around which Bitcoin’s next multi-year regime will form. Confirmation requires the monthly close.
— CORE5DAN
Institutional Logic. Modern Technology. Real Freedom.

BTCUSD updateMacro Context
Dollar strength, rising U.S. yields, and elevated volatility keep global risk conditions defensive.
Crypto follows that tone: liquidity is cautious, and participation slows ahead of a heavy macro week.
Crypto News Snapshot
Bitcoin trades near a six-month low as fading rate-cut expectations pressure risk assets.
Ethereum headlines a new “supercycle” claim, though critics question whether fundamentals support it.
XRP gains attention as ETF-related institutional flow expectations rise.
MSM — Market Structure Mapping
BTC trades in the daily discount zone under prior bearish highs.
Liquidity from last week’s 92,630 remains active.
VFA — Volume Flow Analytics
The previous bullish volume node is lost.
Participation favors defensive flow rather than expansion.
OFD — Order Flow Dynamics
Orderflow is bearish at negative 2 deviation levels.
Sell-side engagement is cleaner than buy-side behavior.
PEM — Precision Execution Modeling
Engagement is difficult at these levels.
Dollar strength and rising yields tighten conditions across crypto and risk assets.
Until macro stabilizes, stick to structure + flow alignment.
No anticipation. Only confirmation.
CORE5 Rule of the Day
Slow down when the macro speeds up.
One-Line Summary
BTC trades in a defensive macro regime with selective participation and a neutral-to-cautious bias.
— CORE5DAN
Institutional Logic. Modern Technology. Real Freedom.

DXY Is Entering a Decision Zone — The Next Move Starts Here.DXY | Neutral Bias | 4H Frame
CORE5 View: Price has filled its inefficiencies and now meets the weekly balance head-on. This is the decision point for the next impulse.
Fundamental Context
Tomorrow is the real driver: PPI + jobless claims, with CPI right behind it.
These three data points set the short-term path for the dollar’s yield expectations.
Markets are holding steady into the releases — no rush, no conviction.
This is a waiting zone until numbers show direction.
Market Structure Context
Price has pushed into the discount side of the 4H range, tapping the same zone that has triggered rotations before.
All single prints beneath have now been filled, removing imbalances.
Now the structure is pressing the weekly balance at 98.766, a level that normally slows momentum and forces the market to show its hand.
This is where structure decides between rotation or continuation.
MSM — Market Structure Mapping
The 4H structure carries a bearish tone, but it is pushing straight into weekly balance, which often neutralizes momentum.
Nothing is broken, but nothing is confirmed.
This is where professionals wait for liquidity to choose dominance.
DGM — Dynamic Geometry Modeling
The downward leg into discount matches the prior leg in size and rhythm.
Symmetry is complete.
Geometrically, this is a natural location where rotation can start — but only if liquidity agrees.
VFA — Volume Flow Analytics
Anchored volume sits at 98.725, only a few points below current price.
This is a reliable decision level:
• Rotation often begins here when volume defends.
• If price accepts below this node, bearish continuation opens quickly.
It’s a participation pivot — the market chooses, not us.
OFD — Order Flow Dynamics
Order flow still favors the bearish side.
No meaningful attempt higher, no failed push, no shift in intent.
Buyers are quiet; sellers are steady.
Patience here protects capital.
PEM — Precision Execution Modeling
We’re sitting mid-range into end-of-day liquidity with clear pools both above and below.
In these conditions, price often drifts, cleans both sides, and waits for tomorrow’s data.
For cross-market positioning, holding off until USD bias confirms is the professional move.
🧠 CORE5 Rule of the Day
“Context leads. Direction follows. Structure only works when you let it speak first.”

BTCUSD — All Targets HitCORE5 Market Note
- Market Structure Mapping (MSM)
Bitcoin (BTCUSD) hit our weekend targets early and bounced from the volume fractal at 106.463.
Price still trades inside the bearish range from 116.432 (high) to 98.952 (low) — the same structure carried over from last week.
BTC is now testing the midrange zone, trading lower within the daily structure.
MSM shows a sell reaction from the fractal, but we still need a proper shift in structure before bias confirms.
For now, it’s a waiting game — the London session already delivered strong moves, so patience remains the higher-probability play.
- Volume Flow Analytics (VFA)
The weekly fractal near 100.996 has absorbed nearly five days of price action — a clear zone where buyers stepped in with size.
Above, the 106.463 fractal marks where sellers defended, creating two strong reference points that now frame the market.
These levels must break before any clear directional bias forms.
Until then, it’s still a waiting game.
- Macro Context
The U.S. dollar softened as traders expect more Fed rate cuts ahead, while Washington moves closer to reopening the government.
That calmer tone helped risk markets rebound — Bitcoin included.
If yields stay near 4.1% and confidence keeps building, crypto has room to recover.
But a sudden dollar rebound could flip sentiment fast.
🧠 CORE5 RULE: The next move doesn’t need you — it needs confirmation.
— CORE5DAN
Institutional Logic. Modern Technology. Real Freedom.

GOLD TODAY'S EXPECTED MOVEIn this analysis we are focusing on 2H time frame for finding the upcoming moves and changes in Gold price. So let's see what's happens and which opportunity market will give us.
Make sure Bearish confirmation must important, when you execute your trade.
Always use stoploss for your trade.
Always use proper money management and proper risk to reward ratio.
This is just my analysis or prediction.
Feel free to share your thoughts on this in the comments below. I’d love to hear your reflections.
#XAUUSD 2H Technical Analysis Expected Move.
