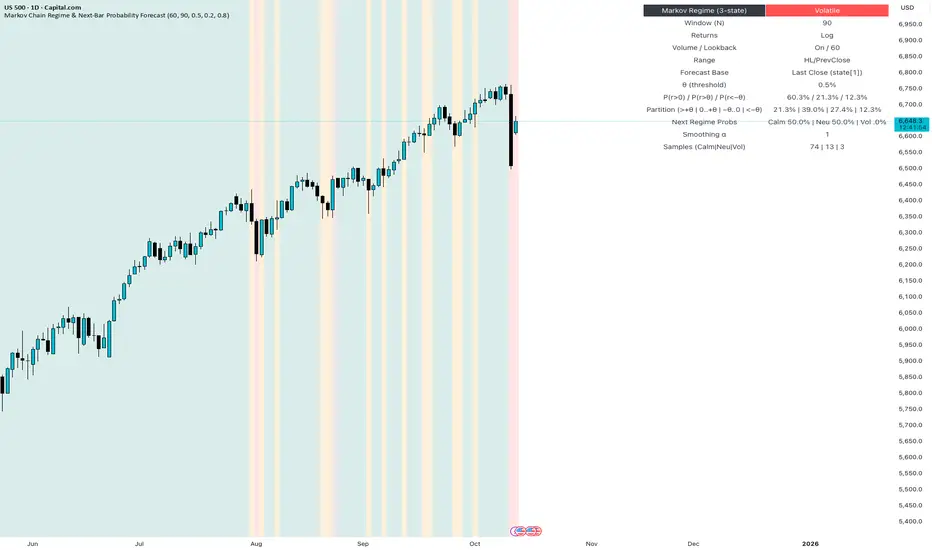
HOW-TO: Forecast Next-Bar Odds with Markov ProbCast🎯 Goal
In 5 minutes, you’ll add Markov ProbCast to a chart, calibrate the “big-move” threshold θ for your instrument/timeframe, and learn how to read the next-bar probabilities and regime signals
(🟩 Calm | 🟧 Neutral | 🟥 Volatile).
🧩 Add & basic setup
Open any chart and timeframe you trade.
Add Markov ProbCast — P(next-bar) Forecast Panel from the Public Library (search “Markov ProbCast”).
Inputs (recommended starting point):
• Returns: Log
• Include Volume (z-score): On (Lookback = 60)
• Include Range (HL/PrevClose): On
• Rolling window N (transitions): 90
• θ as percent: start at 0.5% (we’ll calibrate next)
• Freeze forecast at last close: On (stable readings)
• Display: leave plots/partition/samples On
📏 Calibrate θ (2-minute method)
Pick θ so the “>+θ” bucket truly flags meaningful bars for your market & timeframe. Try:
• If intraday majors / large caps: θ ≈ 0.2%–0.6% on 1–5m; 0.3%–0.8% on 15–60m.
• If high-vol crypto / small caps: θ ≈ 0.5%–1.5% on 1–5m; 0.8%–2.0% on 15–60m.
Then watch the Partition row for a day: if the “>+θ” bucket is almost never triggered, lower θ a bit; if it’s firing constantly, raise θ. Aim so “>+θ” captures move sizes you actually care about.
📖 Read the panel (what the numbers mean)
• P(next r > 0) : Directional tilt for the very next candle.
• P(next r > +θ) : Odds of a “big” upside move beyond your θ.
• P(next r < −θ) : Odds of a “big” downside move.
• Partition (>+θ | 0..+θ | −θ..0 | <−θ): Four buckets that ≈ sum to 100%.
• Next Regime Probs : Chance the market flips to 🟩 Calm / 🟧 Neutral / 🟥 Volatile next bar.
• Samples : How many historical next-bar examples fed each next-state estimate (confidence cue).
Note: Heavy calculations update on confirmed bars; with “Freeze” on, values won’t flicker intrabar.
📚 Two practical playbooks
Breakout prep
• Watch P(next r > +θ) trending up and staying elevated (e.g., > 25–35%).
• A rising Next Regime: Volatile probability supports expansion context.
• Combine with your trigger (structure break, session open, liquidity sweep).
Mean-reversion defense
• If already long and P(next r < −θ) lifts while Volatile odds rise, consider trimming size, widening stops, or waiting for a better setup.
• Mirror the logic for shorts when P(next r > +θ) lifts.
⚙️ Tuning & tips
• N=90 balances adaptivity and stability. For very fast regimes, try 60; for slower instruments, 120.
• Keep Freeze at close on for cleaner alerts/decisions.
• If Samples are small and values look jumpy, give it time (more bars) or increase N slightly.
🧠 Why this works (the math, briefly)
We learn a 3-state regime and its transition matrix A (A = P(Sₜ₊₁=j | Sₜ=i)), estimate next-bar event odds conditioned on the next state (e.g., q_gt(j)=P(rₜ₊₁>+θ | Sₜ₊₁=j)), then forecast by mixing:
P(event) = Σⱼ A · q(event | next=j).
Laplace/Beta smoothing, per-state sample gating, and unconditional fallbacks keep estimates robust.
❓FAQ
• Why do probabilities change across instruments/timeframes? Different volatility structure → different transitions and conditional odds.
• Why do I sometimes see “…” or NA? Not enough recent samples for a next-state; the tool falls back until data accumulate.
• Can I use it standalone? It’s a context/forecast panel—pair it with your entry/exit rules and risk management.
📣 Want more?
If you’d like an edition with alerts , σ-based θ, quantile regime cutoffs, and a compact ribbon—or a full strategy that uses these probabilities for entries, filters, and sizing—please Like this post and comment “Pro” or “Strategy”. Your feedback decides what we release next.
Markovchain
Prophet Algo Picks - Jan 24,2024Prophet algo uses markov probabilities to get bullish and bearish probabilities for the day. Uses a custom machine learning algo which backtested gave a 75% win rate when trying to predict daily movements.
Definitions:
Positive day meaning : When the Closing price for the day is greater than the opening price
Negative day meaning : When the Closing price for the day is lower than the opening price
Markov model does not care about the intraday price movements, just the difference between opening and closing prices
If you would like to analyze intraday movements, use our technical tools, option chain and weekly stock forecasts to get further insights
NYSE:ABT
Category: Positive
Bullish Probability: 82.35%
Bearish Probability: 17.65%
NYSE:BALL
Category: Positive
Bullish Probability: 78.05%
Bearish Probability: 21.95%
NASDAQ:FITB
Category: Negative
Bullish Probability: 24.49%
Bearish Probability: 75.51%
NASDAQ:FSLR
Category: Negative
Bullish Probability: 26.67%
Bearish Probability: 73.33%
NYSE:GPC
Category: Positive
Bullish Probability: 76.67%
Bearish Probability: 23.33%
NYSE:PAYC
Category: Positive
Bullish Probability: 75.00%
Bearish Probability: 25.00%
NYSE:VZ
Category: Negative
Bullish Probability: 15.00%
Bearish Probability: 85.00%
NYSE:VFC
Category: Negative
Bullish Probability: 23.08%
Bearish Probability: 76.92%

Next transition state lead to 31616.3 New Method I developed and want to test, so this is more of an experiment.
General idea is that while a name consolidates it will follow a continuous-time Markov chain (CTMC), and the next state will be determined by the probabilities of a stochastic matrix.
- let a section here be a single diamond and a state be a neighborhood of 4 diamonds. The diamonds are drawn by making a base symmetrical triangle using rays, and then cloned to run parallel to the base at equidistance +-1, +-2, +-3,+-4,...+-n from base with the probability of breakout increasing with increasing n.
- the most probable next state will be the range from 28516 - 30840, however, due to the accelerating rate of BTCs most recent transition over the state path (drawn in yellow/highlight and merely connects the observed states in sequence), there is a decent probability BTC will generate the escape velocity here to break above 30840 and test 31616.3 (green projected path), if rejected at or before 30840 it will most likely continue its consolidation (red path).
- Estimated time to reach 31616.3 is by May 28. If it can break 31616.3 good chances it will do so by forming an impulse wave, a corrective wave to test old resistance for support, and then attempt true breakout of range and on to more exciting days.
Happy Trading,
Nash John
