MASK/USDT — Testing Big Support! Big Rebound or Major Breakdown?
🔎 Overall Analysis
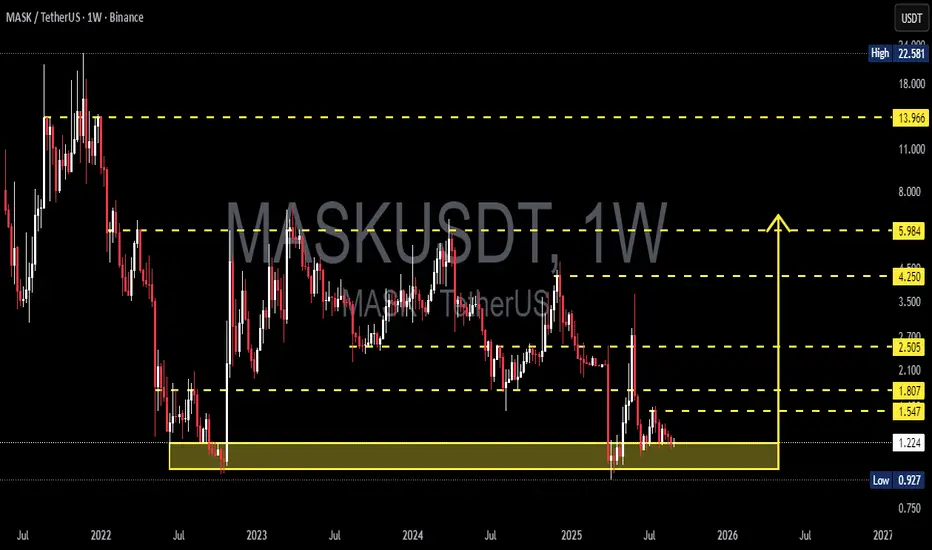
MASK is once again testing the historical support zone at 0.93 – 1.22 USDT (yellow box), an area that has repeatedly acted as a demand zone since 2022. Each time price revisited this region, it sparked strong rebounds.
However, the long-term structure remains bearish with a clear pattern of lower highs. This means that while support is strong, the broader trend is still downward unless we see a confirmed structural shift.
In short, MASK is now at a critical turning point: will this zone serve as a springboard for another rally, or will it finally give way and open the door for deeper downside?
---
📊 Key Technical Levels
Main Support Zone: 0.93 – 1.22 (yellow box).
Nearest Resistances:
1.547
1.807
2.505
4.250
5.984
13.966 (major resistance before ATH).
All-Time High: 22.58
---
🟢 Bullish Scenario
If MASK can hold above 1.22 and confirm a weekly close above 1.55–1.80, upside momentum may return.
Short-term target: 1.807.
Mid-term target: 2.505.
Long-term potential: 4.250 – 5.984 if a strong breakout occurs.
Bullish factors:
1. Historical demand zone (yellow box) has triggered multiple rebounds.
2. Noticeable volume spikes when price tests this support → sign of buyer interest.
3. Possible double bottom / accumulation base formation if price holds the zone.
---
🔴 Bearish Scenario
If MASK closes below 0.93 on the weekly chart, this support zone would break, signaling a strong bearish continuation.
The next downside levels are unclear (no major historical support below), leaving room for a capitulation move.
The bearish trend of lower highs would be further reinforced.
Bearish factors:
1. Larger trend remains down.
2. Every rally so far has ended with sharp rejections.
3. Weak buying momentum during upswings.
---
🧩 Chart Pattern Insights
Current price action shows consolidation within a demand zone — trapped between strong demand (0.93–1.22) and supply (1.55–1.80).
Repeated liquidity grabs / false breakouts (long wicks) suggest whales accumulating liquidity.
A strong base here could mark the beginning of a larger reversal — but without confirmation, it may also be distribution before a breakdown.
---
📌 Conclusion & Strategy
MASK is now at one of its most critical support levels in years.
As long as 0.93–1.22 holds, chances for a rebound remain.
Bullish confirmation requires a strong weekly close above 1.80.
A breakdown below 0.93 would open the door for further downside and potential capitulation.
👉 Best approach: wait for confirmation before committing heavily. Aggressive traders may consider small entries near support with a tight stop below 0.93.
---
#MASKUSDT #MASK #CryptoAnalysis #SupportResistance #WeeklyChart #TechnicalAnalysis #Altcoins #SwingTrading #CryptoCommunity
Maskcoin
MASKUSDT 1W AnalysisMASK ~ 1W Analysis
#MASK Buy back gradually from here if you still have confidence in this coin with a short term target of at least 20%+ from this support.

Mask Trying To BreakMASK/USDT , I anticipate a successful breakout of this horizontal resistance, potentially resulting in a 20-40% increase. Let's wait and see.
Note: This is simply an idea and not financial advice. Please conduct your own research before making any decisions.

MASKUSDT - Buy Opportunity!MASKUSDT (1D Chart) Technical analysis
MASKUSDT (1D Chart) Currently trading at $3
Buy level: Above $2.93
Stop loss: Below $2.42
TP1: $3.4
TP2: $4
TP3: $4.7
TP4: $6
Max Leverage 2x
Always keep Stop loss
Follow Our Tradingview Account for More Technical Analysis Updates, | Like, Share and Comment Your thoughts

Maskusdt Update Maskusdt
I am expecting price to breakdown from this channel after this uptrend as i mentioned
Let's see, for now we have to wait for confirmation no need to take unnecessary risk
Note : This is jist an early prediction, do your own research before taking any decision

Mask long idea hello Traders, here is the full analysis for this pair, let me know in the comment section below if you have any questions, the entry will be taken only if all rules of the strategies will be satisfied. I suggest you keep this pair on your watchlist and see if the rules of your strategy are satisfied. Please also refer to the Important Risk Notice linked below.

MASKUSDTAfter a good performance, the mask has now taken a bearish shape and is under a static resistance and a dynamic resistance, which caused the formation of a double top pattern a few days ago. My prediction for the next few days is that the price will move towards historical support and possibly Failure is support. which you can see in the chart.
⚠️ "Daily crypto market analyses I provide are personal opinions & not financial advice. Trading carries risks, so do your own research & seek advisor's help."

Mask Getting ready to Test 7$Seems Like Mask Wanna Continue Its Bullish Momentum Forming Falling Wedge In H4 Timeframe Incase Of Breakout Expecting Another 50 to 55% Bullish Wave

MASK Network price continues to consolidate and can fall -40%If you look at the price chart of MASKUSDT on the large timeframe, we can assume that "something big is in the works." But not all at once, as the consolidation that has been going on since November 2022 may last for at least another month.
MASK buyers have made more than 3 attempts to break above the strong liquidity zone, but each time there is less and less strength to move up.
This means that the MASKUSDT price needs to go lower, consolidate , recruit more members to the team called "to the mooon," and only then try to organize an up breakout.
We would be very happy if we could buy MASK at $2.35-2.50.
It would be a medium- or even long-term investment with a first take-profit of about $10
_____________________
Did you like our analysis? Leave a comment, like, and follow to get more

MASKUSDTHere is the analysis for MASKUSDT and you can visit our website for full article and can read about this pattern and Fibonacci ratios

MASKUSDT - Descending Channel BreakoutMASKUSDT (12h Chart) Technical analysis
MASKUSDT (12h Chart) Currently trading at $3.95
Buy level: Above $3.8
Stop loss: Below $3
TP1: $4.5
TP2: $5.3
TP3: $6.4
TP4: $8
Max Leverage 2x/Spot market
Always keep Stop loss
Follow Our Tradingview Account for More Technical Analysis Updates, | Like, Share and Comment Your thoughts

Mask Getting Ready For Another Bullish Impulse Seems Like Getting Ready For Another Bullish Impulse
Forming Descending Channel In H4 Timeframe Incase Of Breakout Expecting 60 - 65% Bullish Move

MASK ANALYSIS (1D)Hi, dear traders. how are you ? Today we have a viewpoint to BUY/SELL the MASK symbol.
It seems that we are in an abc pattern whose wave b has become diametric and now we are in wave e of the diametric wave b.
For risk management, please don't forget stop loss and capital management
When we reach the first target, save some profit and then change the stop to entry
Comment if you have any questions
Thank You

MASK LONG SETUPHi, dear traders. how are you ? Today we have a viewpoint to BUY/LONG the MASK symbol.
For risk management, please don't forget stop loss and capital management
When we reach the first target, save some profit and then change the stop to entry
Comment if you have any questions
Thank You

Mask Getting ready For Another Breakout Seems Like Mask Wants To Continue Bullish Moves
Forming Bullish Pennant In H4 Timeframe Incase Of Breakout Expecting 45 -50% Bullish Move

Mask Breaking Out Finally Breaking Channel In weekly Timeframe
Incase Of breakout expecting 180 to 200% bulish Move


MASK wave count updateI hope you are fine
I think we are in a big flat, where wave b is a triangle, and now we are in wave e of this triangle. After the completion of this triangular wave e, we will have a big drop in the form of a flat c wave
Comment if you have any questions
Thank You

MASK USDT X marks the SHORTThis trade will probably be filled tomorrow but i am setting my orders now.
It agrees with the idea that BTC will go to 17250 and then drop again.
Setting a SHORT order at
3.56 (75% of position)
3.67 (25% of position)
Three take profit prices (probably will be updated)
3.422 $
3.311 $
3.241 $
Stop loss if any 1 hour candle closes above our entry price.
LEVERAGE X2
If for any reason anything changes, i will update the idea here guys.
FOLLOW FOR MORE!

MASKUSDTbreakout has already done
looks ready to fly
not a financial advice do your research before taking any action

