Mastercard Picks Polygon for Self-Custody Identity UpgradeMastercard has expanded its Mastercard Crypto Credential program to self-custody wallets, and selected Polygon as the first blockchain network to support the rollout. Together with Polygon Labs and Mercuryo, Mastercard is introducing verified, username-style aliases that replace long wallet addresses, bringing a familiar, Web2-like UX to Web3 value transfers.
The upgrade enables users to link a self-custody wallet to a verified alias, receive assets using that username, and optionally mint a soulbound credential on Polygon. Mercuryo handles KYC onboarding and credential issuance, while Polygon provides the speed, reliability, and low-cost infrastructure required for identity and payments at global scale.
Polygon’s selection is driven by its enterprise-friendly architecture: sub-cent fees, instant settlement, high throughput, and no reorg risk following the recent Rio and Heimdall v2 upgrades. With stablecoin volume already in the billions monthly and strong penetration among neobanks and payment providers, Polygon is well-positioned to power next-generation digital identity and payment rails. The collaboration marks a major step toward mainstream-ready self-custody, intuitive, secure, and trusted.
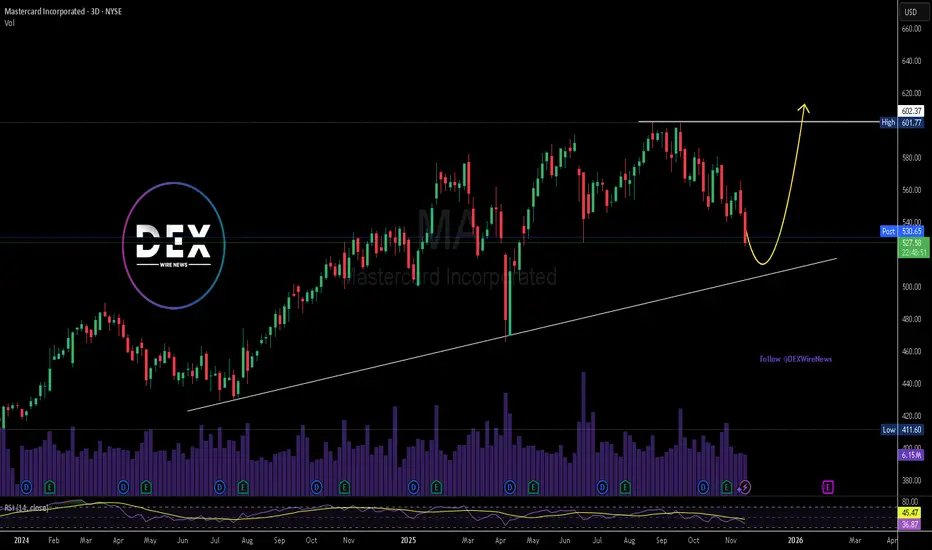
Technical Outlook, Mastercard (MA)
Mastercard’s stock is pulling back toward a multi-year ascending trendline, aligning with a major liquidity zone below the $527 low. The chart shows a potential sling low forming, with price rebounding from trendline support historically before rallying toward prior highs.
If bulls hold support, the next upside target is the $600–$602 resistance level. A breakout above this zone could open a path toward new all-time highs, aligning with improving sentiment around digital payments and Mastercard’s increasing involvement in blockchain infrastructure.
Momentum indicators signal near-term exhaustion, but the macro trend remains intact. A clean reaction from support could trigger a medium-term recovery.
Mastercardsignals
Mastercard Expands Fintech Footprint Through Globba Partnership Mastercard Inc. (NYSE: NYSE:MA ) continues to reinforce its leadership in global payment infrastructure with the launch of Globba™, a next-generation cross-border payment solution developed in collaboration with FNB and RMB Private Banking. Powered by Mastercard Move, the platform simplifies international money transfers for South Africans, offering fast, transparent, and traceable transactions to over 120 countries.
Fundamentally, this partnership highlights Mastercard’s growing footprint in Africa’s rapidly digitizing economy. The continent’s cross-border remittance flows have expanded sharply, with Mastercard research noting that 60% of South Africans sent money abroad in 2024, up from 59% in 2022. Globba™ integrates Mastercard Move’s reach across 200+ countries and 150+ currencies, reflecting the company’s commitment to inclusion and financial connectivity. This positions Mastercard as a key enabler in Africa’s G20-aligned modernization of payment systems, potentially driving new revenue streams in both consumer and B2B remittance corridors.
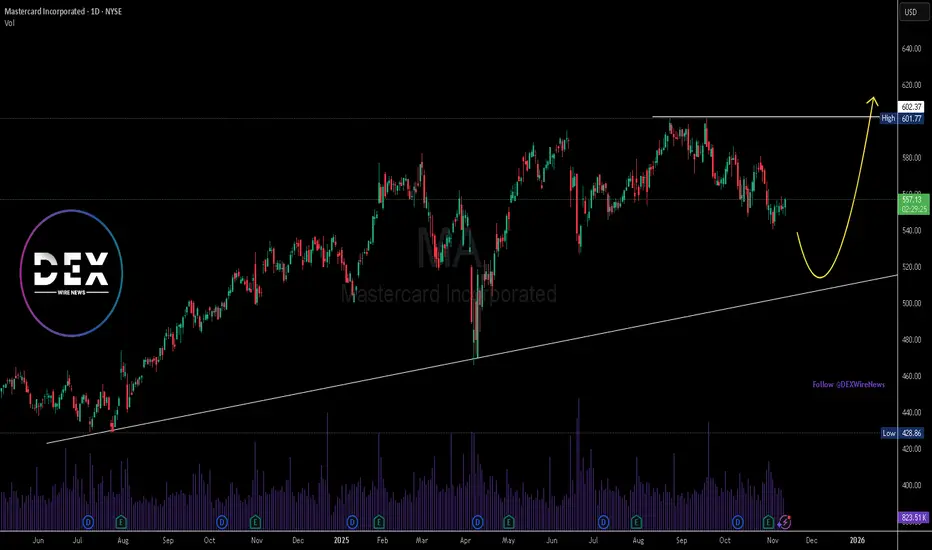
Technically, Mastercard’s stock ( NYSE:MA ) shows a strong long-term uptrend despite recent consolidation. The daily chart indicates support around the $510 zone, with a possible short-term pullback before rebounding toward resistance near $602, as outlined by the yellow projection curve in the chart. Sustaining above $540 could trigger bullish momentum, targeting a retest of all-time highs above $600. Rising volume and consistent higher lows underscore accumulation within a strong structural uptrend, suggesting long-term investors may see continued appreciation aligned with Mastercard’s expansion into emerging digital economies.
As Mastercard combines innovation with global scale, its fundamentals remain strong and its chart poised for potential breakout momentum into 2026.
MASTERCARD Best Buy Entry Now, Target $577.50.
## 💳 MA Options Play: Weekly Bullish Setup with Caution!
**Mastercard (MA)** showing bullish momentum — but options flow says: “Proceed carefully.”
---
### 🟢 Bullish Signals (4/5 Models Agree):
* 📈 Weekly RSI uptrending
* 🔊 Strong weekly volume
* 🌀 Low volatility = cleaner setup
* 🧠 Multiple models (Grok, Claude, Llama, DeepSeek) lean BULLISH
### 🔴 Caution Flag:
* ⚠️ Bearish options flow detected (institutions possibly hedging)
---
### 🔍 Trade Setup:
**🎯 MA \$577.50 CALL**
* 💵 Entry: \$0.80
* 🎯 Target: \$1.20
* 🛑 Stop: \$0.40
* 📆 Expiry: Aug 5, 2025
* ⚖️ Risk: \~50% of premium
* 🕒 Entry: Market Open
---
### 🧠 Consensus Rating:
☑️ **Confidence: 65% (Moderate Bullish)**
☑️ Volume + RSI = Green Lights
☑️ Options flow = Yellow Light
---
### 🎯 Strategy Tip:
Small size. Quick exit. Watch options flow LIVE — if it shifts bullish, ride momentum. If not? Tight risk control.

MASTERCARD Best buy entry now. Target $625.Mastercard (MA) has been trading within almost a 3-year Channel Up that only broke (but recovered naturally) during Trump's trade war. Still, the 1W MA100 (green trend-line) contained the downfall, as it always had.
Normally the Bearish Legs of this pattern tend to find Support on the 1W MA50 (blue trend-line), as the latest one did 3 weeks ago. Now that the price is trading still on the 0.382 Fibonacci retracement level, it historically is the best buy opportunity, as per all previous Bullish Legs.
The Channel Up has always priced its Higher High (top) on at least the -0.236 Fibonacci extension. As a result, we are targeting $625.00 before the year ends.
-------------------------------------------------------------------------------
** Please LIKE 👍, FOLLOW ✅, SHARE 🙌 and COMMENT ✍ if you enjoy this idea! Also share your ideas and charts in the comments section below! This is best way to keep it relevant, support us, keep the content here free and allow the idea to reach as many people as possible. **
-------------------------------------------------------------------------------
💸💸💸💸💸💸
👇 👇 👇 👇 👇 👇

MASTERCARD Huge sell signal emerged, hit 1D MA50 after 4 months.Mastercard (MA) has been trading within a 2-year Channel Up that has given us very accurate trades. Our previous signal (April 02, see chart below), was a sell right on the pattern's top that easily hit our $440 Target:
Once more we see a long-term Top on this stock as the price almost priced a Higher High and on yesterday's Fed fueled pull-back, it hit its 1D MA50 (blue trend-line) for the first time in 4 months (since August 06).
Apart from that, the 1D RSI has been on a Bearish Divergence of Lower Highs (against the Higher Highs of the Bullish Leg/ dotted Channel Up) since October 18. All such previous Bearish Divergences within this 2-year Channel Up, have started the Bearish Legs (red ellipses) of the pattern, which hit at least their 0.382 Fibonacci retracement levels.
As a result, we have a high probability short signal at our hands, targeting $495.00 (Fib 0.382).
-------------------------------------------------------------------------------
** Please LIKE 👍, FOLLOW ✅, SHARE 🙌 and COMMENT ✍ if you enjoy this idea! Also share your ideas and charts in the comments section below! This is best way to keep it relevant, support us, keep the content here free and allow the idea to reach as many people as possible. **
-------------------------------------------------------------------------------
💸💸💸💸💸💸
👇 👇 👇 👇 👇 👇

MASTERCARD short-term weakness is a buy opportunity. Target $515Mastercard (MA) gave us an excellent sell signal on our last call (April 02, see chart below), reaching our exact Target ($440.00) before turning sideways and reach this way a Higher Low:
That Higher Low was a bottom on the 2-year Channel Up pattern that has been dominating the long-term price action of the stock. As you can see it hit the 1D MA200 (orange trend-line) and the 0.382 Fibonacci retracement level and has rebounded since, which is similar to the March 16 2023 Low.
The similarities are evident on this chart between the Bullish and Bearish Legs of the Channel Up and the Sine Waves help at giving us a sense of Highs and Lows. The 1D RSI sequences between the two main fractals are also similar and this shows that probably we are at a similar symmetrical level as on July 14 2023.
As a result, we expect a short-term pull-back towards the 1D MA50 (blue trend-line) and then final rally towards the elections for a Higher High around $515.00, which will be just below the -0.236 Fibonacci extension (similar to the September 14 2023 High). Then we expect the stock to yet again seek the bottom of the Channel Up near the 1W MA100 (red trend-line) at $460.00.
-------------------------------------------------------------------------------
** Please LIKE 👍, FOLLOW ✅, SHARE 🙌 and COMMENT ✍ if you enjoy this idea! Also share your ideas and charts in the comments section below! This is best way to keep it relevant, support us, keep the content here free and allow the idea to reach as many people as possible. **
-------------------------------------------------------------------------------
💸💸💸💸💸💸
👇 👇 👇 👇 👇 👇

MASTERCARD Short-term pull-back has begunLast time (August 23 2023, see chart below) we looked at Mastercard (MA) the 1D MA50 (blue trend-line) gave us a solid buy opportunity, which easily hit our 415.00 Target:
The price is now starting to pull-back after marginally breaking the top (Higher Highs trend-line) of the 1.5 year Channel Up (blue). It already broke below the medium-term (dotted) Channel Up and is headed towards the 1D MA50 (blue trend-line).
With the 1D RSI already on Lower Highs (i.e. a Bearish Divergence against the stock's Higher Highs), we believe this is an early Sell Signal on the short-term. The March 13 2023 Target was the 0.382 Fibonacci retracement level, so we are currently aiming for $440.00.
-------------------------------------------------------------------------------
** Please LIKE 👍, FOLLOW ✅, SHARE 🙌 and COMMENT ✍ if you enjoy this idea! Also share your ideas and charts in the comments section below! This is best way to keep it relevant, support us, keep the content here free and allow the idea to reach as many people as possible. **
-------------------------------------------------------------------------------
💸💸💸💸💸💸
👇 👇 👇 👇 👇 👇

MASTERCARD On a buy signalIt's been too long since we last looked into a Mastercard Inc (MA) trade, with last time though (see chart below) providing a good pull-back buy opportunity:
This time the price is on a 1D MA50 (blue trend-line) rebound, in fact a Double Bottom rebound if we count the August 03 Low. With the 1D MACD about to give the ultimate buy confirmation on the Bullish Cross (you can buy after it is formed), we are bullish, targeting 415 (completes a +16.00% rise).
The long-term pattern is a Channel Up since the March 16 Low. Any closing above it, brings the upper Fibonacci levels in focus as potential targets.
-------------------------------------------------------------------------------
** Please LIKE 👍, FOLLOW ✅, SHARE 🙌 and COMMENT ✍ if you enjoy this idea! Also share your ideas and charts in the comments section below! **
-------------------------------------------------------------------------------
💸💸💸💸💸💸
👇 👇 👇 👇 👇 👇

Mastercard a long term opportunityMastercard Inc NYSE:MA
- Historically cycles are between 34 - 40 months
- Now on month 40 of a decline/consolidation cycle
- New cycle into bull phase highly probable
- Above 10 month, 200 week & 200 day SMA
- Recently had lowest oversold RSI level ever!
- Monthly MACD Cross
In addition to the above points, a number of bullish parameters are lining up on the chart.
On the daily and the weekly we breaking out of a parallel channel. We are testing the upper resistance of the parallel channel for the 5th time and appear to be breaking through. Parallel channels have one of thee best records in terms of trading pattern success rates.
The RSI was at its most oversold level ever in Sept 2022 and this may have acted as a spring to help propel price with enough momentum to breach through the overhead resistance.
In summary, the cycles suggest we are about to move into a bull market with the aid of a price spring from significantly oversold levels. We are breaking out of a parallel channel and have the 10 month, 200 week and 200 day SMA's under price as support and they are all sloping upwards.
The parallel channel target provides +41% return (see chart). I have also shown were a 100% return would fall on the chart. If we were to reach the top of the channel within the typical 40 month cycle by Sept 2026 we could see a 200% return in what is a very well entrenched and established stock/company.
NYSE:MA is highly established entity as the 20th largest company in the world by market cap at $372bln. A 2x in market cap would make it a $1 trillion company (how likely this is I don't know). Mastercard pay a very small $0.57 dividend each quarter per share ($2.83 annualized). Its less than a percent in dividend yield but its something else to factor in.
KEY DATE: Earnings report on 27th July 2022 (no negative earnings report since 2020).

MA are you rdy for short ?🧨🧨👌The master card company is the leader of the financial fraudsters
What we are seeing in the Mastercard trend is an upward trend, because when more money is printed and economies go towards destruction, at first glance, we can see that the shares of banking companies will grow, but let me listen to my friends. It has and should be prepared for the fact that MasterCard shares will fall badly. Although this company wants to resist, you cannot fight with numbers. This number you see is just a bubble that will burst soon.
The future targets of MasterCard shares are $341.31, the next target is $316.71, and the third target is $279.19, which should be seen and will be seen.

MASTERCARD About to break into long-term bullish territoryMastercard Inc (MA) is rebounding again back towards the top of its +1 year Channel Down pattern after the December 02 rejection on the 262.000 Resistance, which happened to be also at the top (Lower Highs trend-line) of the Channel.
If the price breaks above, that alone would be a major bullish break-out signal for the long-term but ideally we would like to see a cross above the (red) Resistance Zone for confirmation. Beyond that, the upside targets are the 382.00 April 28 High and 400.00 February 02 High.
If on the other hand the 1D MA50 (blue trend-line) breaks first, we expect a pull-back to the (green) Support Zone (around 305.00) before the uptrend is resumed.
-------------------------------------------------------------------------------
** Please LIKE 👍, SUBSCRIBE ✅, SHARE 🙌 and COMMENT ✍ if you enjoy this idea! Also share your ideas and charts in the comments section below! This is best way to keep it relevant, support me, keep the content here free and allow the idea to reach as many people as possible. **
-------------------------------------------------------------------------------
You may also TELL ME 🙋♀️🙋♂️ in the comments section which symbol you want me to analyze next and on which time-frame. The one with the most posts will be published tomorrow! 👏🎁
-------------------------------------------------------------------------------
💸💸💸💸💸💸
👇 👇 👇 👇 👇 👇
