MATIC/USDTCRYPTOCAP:MATIC is looking good in a daily chart, after flipping the zone in red take an entry and then enjoy. Always use stop-loss. Everything is on the chart
Maticusd

Uptrend turning point : 0.9483Hello traders!
If you "Follow" us, you can always get new information quickly.
Please also click “Boost”.
Have a good day.
-------------------------------------
(MATICUSDT chart)
(1M charts)
Since it has not yet risen above the MS-Signal indicator, it is difficult to say that it has turned into an upward trend.
Accordingly, the key is whether it can rise above 0.9279.
(1W chart)
The key is whether the price can be maintained above 0.7529 and rise above 0.9391.
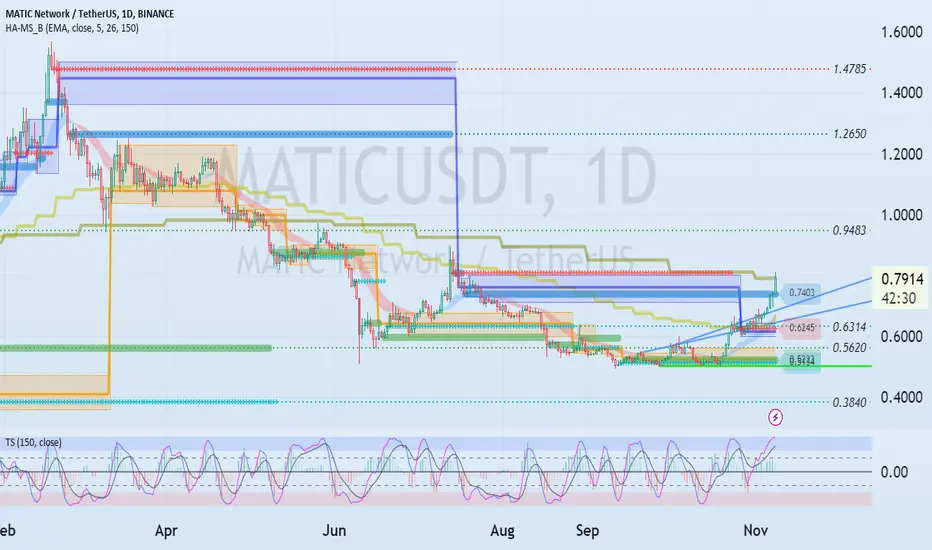
(1D chart)
Looking at the overall picture, I think the range from 0.3840-0.5620 to 0.9483 is an important support and resistance range.
Accordingly, the direction in which one deviates from this section is important.
This is the current 1M chart's M-Signal indicator touched.
Therefore, the key is whether it can rise above the M-Signal indicator on the 1M chart and rise above 0.9483.
If this is not the case and it falls below 0.7403, there is a possibility that it may fall to around 0.6314, so you need to think about a response plan.
If the price rises above 0.9483 and holds, it is expected to turn into an upward trend.
--------------------------------------------------
- The big picture
The full-fledged upward trend is expected to begin when the price rises above 29K.
This is the section expected to be touched in the next bull market, 81K-95K.
-------------------------------------------------- -------------------------------------------
** All explanations are for reference only and do not guarantee profit or loss in investment.
** Trading volume is displayed as a candle body based on 10EMA.
How to display (in order from darkest to darkest)
More than 3 times the trading volume of 10EMA > 2.5 times > 2.0 times > 1.25 times > Trading volume below 10EMA
** Even if you know other people’s know-how, it takes a considerable amount of time to make it your own.
** This chart was created using my know-how.
---------------------------------
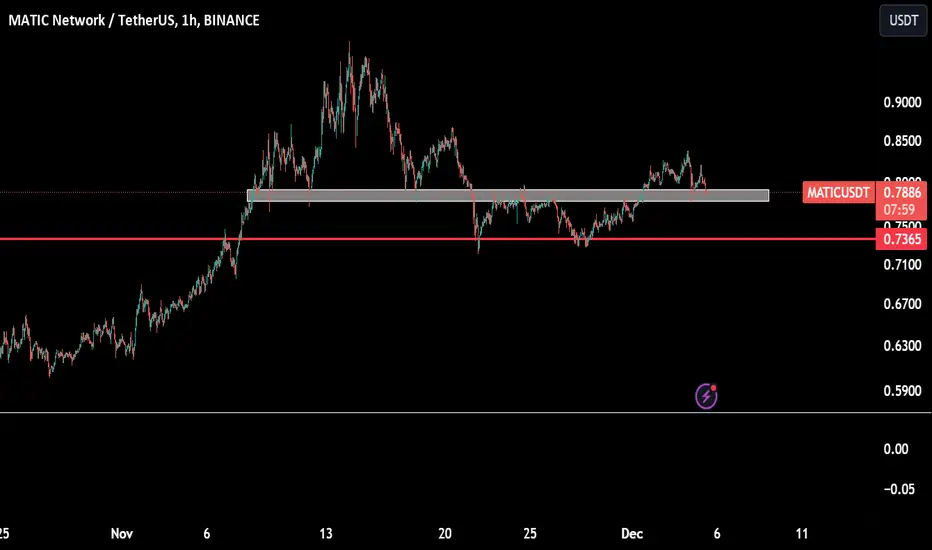
Is a double top forming on MATIC?I want to draw your attention to the fact that a technical analysis pattern called a double top is forming on the MATIC chart.
In case the local neckline, which is at a strong Fibonacci level of 0.618, is broken, we can expect the price to drop to around $0.56.
I believe it may be a good idea to place buy orders for the asset in the zone of $0.58-$0.60.
Please note that this is not financial advice, and any actions you take are at your own risk!

MATIC/BTC huge move About to happenMATIC / BTC
This massive horizontal support against BTC was greatest one for MATIC since 2021 and never broken since that
Price is testing it again and on a quickly reaction the weekly candle got absorbed indicating bulls are buying here
If bulls will save their ass here again, mega bullish move will be followed for MATIC in next weeks in both BTC and USDT charts
If this support lost we gonna cash hard
#DYOR

Matic short ⏰ period analysis 📌Completely ⚡ short period analysis based on Trend support and supply and demand
With movement shift // pls #DYOR
👉 I am expecting COINBASE:MATICUSD shifted 🙄 it's movement bullish side 😛 in day frame LL >> HL
Use 1% position size of ur liquid 💰
Leverage must be below 4X cross 🤞
⏰ expecting 30-50 day's below later invalid 📌
🔥Buy :: $0.5 - $0.54 < split liquid 💰 60% - 40% >
🎯 :: $0.6238 - $0.6475 < move stop lose to entry or profit >
🎯 :: $0.7280 - $0.7575 < 💯% exit >
Stop 🚏 lose < #SL > ::- $0.4804

MATIC Doesn't look goodLose the rectangle box, and MATIC doesn't look so good. Red line could be next very fast
MATIC keep bouncing off 78.6 FIB, preppin for UPSIDE.MATIC, keeps touching the 78.6 FIB level -- and it keeps being rejected to the upside. This convey a strong order block support at this range.
Expect matic to go horizontal for a bit before a significant price change to the upside. The squeeze to the upside is imminent.
Spotted at 0.98
TAYOR.
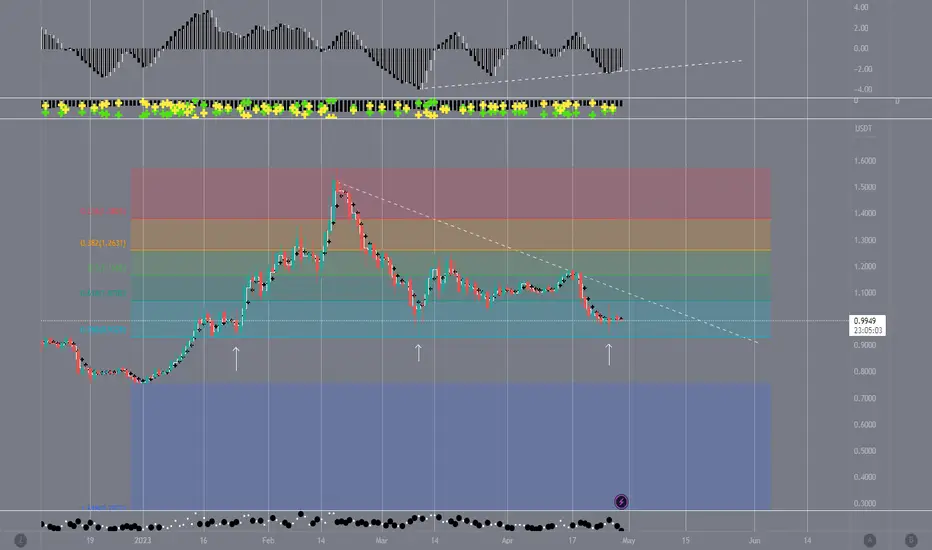
#POLYGON #MATIC Long-Term targets, until end of 2025#POLYGON #MATIC Long-Term targets, until end of 2025
According to Elliott's wave count indicated on the chart, the rise from 2020 to 2021 took place during a five-wave, where either wave 1 is bigger than a five-wave or wave A is bigger than a three-wave.
Considering the possibilities ahead, we can estimate the possible goals of Link until the end of 2025 as follows:
TARGET1: 8$
TARGET2: 24$
TARGTE3: 48$
TARGET4: 145$
ENTRY: 0.85-0.60$
STOPLOSS: 0.50$

Going Long Matic here to 90 Cents PlusThis looks to be good support here for Matic. I have waited patiently for entry and .74 cents looks to be as good as any with all SMAs (50,100,200 day) on the underside for support along with a significant level. Also, RSI has reached support in conjuction with the pullback here. I will be taking profits along the way and expect to be out 75% by the time we reach .95 cents, dragging my stops up along the way to ensure the trade is all profit. I expect to let the remaining 25% ride after hitting .95 cents in hopes that it may jump up and above that ascending TL which would be uber bullish for this coin.
Entry - .7424
Target - about .95
SL - currently .60 (my stops are very loose)
RRR - 1.5 (better with tighter SLs of course)
This is not fin advice. I show you the way I trade for your education and entertainment only.
Stewdamus


Empty seller in low levelAnalysis 📈 = when in flag down in bullrun if to low support level since for buy.
(Buy/Sell) 📊 = 0.6150$
*-Stop Loss = 0.5948$
*-Take Profit 🎯 = 0.6568$ - 0.6979$ - 0.7322$
*-Risk Management 🚧 = 3%
👨🎓 Experience and Education: Our trading team has five years of experience in financial markets, especially cryptocurrencie

MATIC Potential Playout !MATIC / USDT
Price tries to break the A&V pattern which is strong bullish pattern
Incase of the breakout succeeds and candle closed above the pattern we can see a rise in price up to 76% from here
Keep an eye on it
Note :
1- breakout not done yet
2- BTC should be stable for this scenario to play out

Get Ready to Ride the MATIC Rocket to $1 - It's Pump Time!MATIC token is gearing up for a monumental pump, and it's aiming straight for the $1 mark!
Yes, you heard it right! MATIC is on the rise, and we have all the reasons to be thrilled about it. This incredible opportunity is knocking at our doors, and it's time to seize it with both hands. So, buckle up and get ready to embark on a thrilling journey towards profits and success!
Here's why you should consider joining the MATIC long party:
1. **MATIC's Impressive Performance**: Over the past few weeks, MATIC has showcased remarkable resilience and growth. With its solid fundamentals and a dedicated community backing it, MATIC has proven its potential to soar to new heights.
2. **Market Sentiment**: The overall market sentiment is overwhelmingly positive towards MATIC. Experts and analysts are buzzing with excitement, predicting a substantial surge in its value. It's the perfect time to jump on board and ride the wave of success!
3. **Technological Advancements**: MATIC's innovative layer 2 scaling solution has been gaining significant traction lately. This groundbreaking technology has the potential to revolutionize the blockchain industry, attracting more investors and driving up the demand for MATIC.
Now, it's time for the call-to-action! Don't miss out on this golden opportunity to long MATIC and maximize your profits. Here's what you can do to join the action:
1. **Conduct Thorough Research**: Before making any investment, ensure you have a solid understanding of MATIC's fundamentals, recent developments, and market trends. Knowledge is power, and it will help you make informed decisions.
2. **Set Realistic Targets**: While we're all excited about MATIC's potential, it's essential to set realistic profit targets and manage your risk. Plan your trades carefully, and don't forget to implement stop-loss orders to protect your investments.
3. **Stay Informed**: Keep a close eye on the latest news, social media buzz, and market trends surrounding MATIC. By staying informed, you'll be able to adjust your trading strategy accordingly and make the most of this exciting pump.
Remember, this article is not financial advice, but rather an enthusiastic heads-up about a promising opportunity. Always do your due diligence, consult with professionals, and trade responsibly.
Let us embrace this thrilling moment with open arms. Get your trading platforms ready, prepare your strategies, and let's ride the MATIC rocket together towards the $1 target! Exciting times await us, and I couldn't be more thrilled to share this journey with all of you.

MATICUSDT UPSIDE IS COMINGMATIC has breakout on the weekly and there is upside coming in the next 4 months
not FA.

MATIC Surges 6% as Whales Jump In!
MATIC token has just experienced a remarkable surge of 6%, and the cherry on top? Whales are diving into this promising opportunity!
Yes, you read that right! The MATIC token has been making waves in the market, and it's time for us to ride this exhilarating wave. With whales investing in MATIC, it's a clear sign that the smart money is betting big on its future potential. This is a golden opportunity for us to join the ranks of these savvy investors and potentially reap substantial profits.
So, what are you waiting for? It's time to seize the moment and take advantage of this exciting development. I encourage you to seriously consider going long on MATIC, as this surge, coupled with whale investments, indicates a strong bullish sentiment surrounding the token. By going long, we position ourselves to potentially benefit from the anticipated upward momentum.
Why should you consider MATIC? Well, apart from the recent surge and whale interest, MATIC has been gaining significant traction in the market due to its innovative scalability solutions for Ethereum. As the crypto world continues to evolve, MATIC's technology is well-positioned to address the scalability issues faced by many blockchain platforms. This potential for widespread adoption makes MATIC an attractive long-term investment opportunity.
Remember, timing is crucial in the crypto market, and this surge presents a unique chance to capitalize on the growing interest in MATIC. Don't let this opportunity slip through your fingers! Conduct thorough research, analyze the market trends, and consider adding MATIC to your portfolio.
If you're ready to take the plunge and long MATIC, I suggest exploring reputable exchanges that provide a seamless trading experience and offer the necessary tools to maximize your gains. Ensure you stay updated with the latest news and developments surrounding MATIC to make informed decisions.
As always, please remember that investing in cryptocurrencies carries risks, and it's essential to make decisions based on your own financial situation and risk tolerance.

MATICUSD: One more tick upwards, then correction.Polygon is cruising past the 1D MA200 on largely overbought 1D technicals (RSI = 82.582, MACD = 0.047, ADX = 72.673). We expect exhaustion to kick in near 0.87900 (Fibonacci 0.5 level) followed by a lengthy pullback to the 1D MA50. That will be the next buy opportunity, targeted at the R1 level and 0.786 Fibonacci (TP = 1.18950).
## If you like our free content follow our profile to get more daily ideas. ##
## Comments and likes are greatly appreciated. ##

MATICUSDT Potential Targets!MATICUSDT (1D Chart) Technical analysis
MATICUSDT (1D Chart) Currently trading at $0.646
Buy level: Above $0.64
Stop loss: Below $0.55
TP1: $0.7
TP2: $0.8
TP3: $0.88
TP4: $1
Max Leverage 3x
Always keep Stop loss
Follow Our Tradingview Account for More Technical Analysis Updates, | Like, Share and Comment Your thoughts

Matic longMy plan for $MATIC... 2 scenario's I'm looking for...
Alarms set around 0.5 fib and $0,70✅ Patience...
#trading #maticusdt #polygon
@0xPolygon
@0xPolygonLabs

MATICUSD Double bullish break-out.Polygon (MATICUSD) closed yesterday above the 1D MA100 (green trend-line) for the first time in 6 months. At the same time it broke above the top (Lower Highs trend-line) of the Falling Wedge pattern since February 18. The 1D RSI was already on a Higher Lows Bullish Divergence since Augst 22 so this is a technical bullish break-out for the long-term. Our target is the 1D MA200 (orange trend-line) at 0.7000.
-------------------------------------------------------------------------------
** Please LIKE 👍, FOLLOW ✅, SHARE 🙌 and COMMENT ✍ if you enjoy this idea! Also share your ideas and charts in the comments section below! This is best way to keep it relevant, support us, keep the content here free and allow the idea to reach as many people as possible. **
-------------------------------------------------------------------------------
💸💸💸💸💸💸
👇 👇 👇 👇 👇 👇

MATIC Surges 3% - Time to Long and Ride the Wave!MATIC token has experienced a remarkable surge, soaring up by a staggering 3% in just a short span of time! This is an exciting development that should not be overlooked, and I encourage you to seize this opportunity and consider going long on MATIC.
The recent 3% surge in MATIC is a clear indication of the growing strength and potential of this remarkable cryptocurrency. As traders, we are always on the lookout for promising opportunities, and MATIC has consistently proven itself as a force to be reckoned with in the market. This surge serves as a testament to the resilience and upward trajectory of this incredible token.
Now, you might be wondering why this surge matters and what it means for you as a trader. Well, let me tell you, it's time to get excited! A 3% increase may seem small to some, but it's the beginning of a potential rally that could propel MATIC to new heights. By going long on MATIC, you position yourself to reap the benefits of this upward momentum, potentially maximizing your profits in the process.
So, how can you take advantage of this exciting opportunity? It's simple! Consider opening a long position on MATIC, placing your trust in its potential for further growth. By doing so, you align yourself with the positive market sentiment surrounding this token, positioning yourself for potential gains as the price continues to climb.
Remember, the crypto market is highly dynamic and ever-changing. Opportunities like these are what make trading so thrilling and rewarding. However, it's important to always conduct your own research and exercise caution when making investment decisions. While MATIC's recent surge is a promising sign, it's crucial to analyze the market trends and indicators before taking any action.
As always, I encourage you to stay informed, keep an eye on the market, and make well-informed decisions based on your own risk appetite and trading strategy. Don't miss out on this exciting opportunity to long MATIC and potentially ride the wave of its upward momentum!
Wishing you profitable trades and an exciting journey ahead!

0.3840-0.5620: Important boundary rangeHello?
Hello traders!
If you "Follow" us, you can always get new information quickly.
Please also click “Boost”.
Have a good day.
-------------------------------------
(MATICUSDT chart)
(1M charts)
The StochRSI indicator has entered the oversold zone and a change in slope has occurred.
Accordingly, the possibility of a trend reversal in the StochRSI indicator is increasing.
The key is whether the price can be maintained above 0.4010.
(1W chart)
On the 1W chart, the 0.559 point corresponds to an important support and resistance point.
Accordingly, the key is whether the price can be maintained around 0.559 and rise.
(1D chart)
With the 0.3840-0.5620 range as the boundary range, we believe that anything below 0.3840 corresponds to the mid- to long-term investment period.
Accordingly, if it falls below 0.3840, it is recommended to stop trading and wait for it to rise.
In order to reverse the trend, the price must be maintained by rising above the MS-Signal indicator on the 1M, 1W, and 1D charts.
Accordingly, the price must be maintained by rising above the M-Signal indicator corresponding to the MS-Signal indicator.
(MS-Signal indicator is composed of M-Signal indicator and S-Signal indicator.)
Since it has not risen above the MS-Signal indicator on the 1D chart, it has not been able to turn into a short-term upward trend.
Therefore, in order to turn into a short-term uptrend, the price must rise above 0.5620 and maintain the price.
-------------------------------------------------- -------------------------------------------
** All explanations are for reference only and do not guarantee profit or loss in investment.
** Trading volume is displayed as a candle body based on 10EMA.
How to display (in order from darkest to darkest)
More than 3 times the trading volume of 10EMA > 2.5 times > 2.0 times > 1.25 times > Trading volume below 10EMA
** Even if you know other people’s know-how, it takes a considerable amount of time to make it your own.
** This chart was created using my know-how.
---------------------------------

MATICUSD ❕ uptrendTrading volumes remain stable.
The price chart has formed an ascending structure.
I think that MATIC can continue the upward movement.
